| Param | Original file | Final file |
|---|---|---|
| Filename | modeM0/AS1A12_044T21_9000005512_39943cztM0_level2.fits | modeM0/AS1A12_044T21_9000005512_39943cztM0_level2_quad_clean.evt |
| Size (bytes) | 507,369,600 | 87,243,840 |
| Size | 483.9 MB | 83.2 MB |
| Events in quadrant A | 3,557,566 | 611,737 |
| Events in quadrant B | 2,680,355 | 630,915 |
| Events in quadrant C | 6,631,032 | 519,533 |
| Events in quadrant D | 5,474,042 | 484,734 |
| Mode M9 | |||
|---|---|---|---|
| Quadrant | BADHDUFLAG | Total packets | Discarded packets |
| A | 0 | 24 | 0 |
| B | 0 | 24 | 0 |
| C | 0 | 24 | 0 |
| D | 0 | 25 | 0 |
| Mode SS | |||
|---|---|---|---|
| Quadrant | BADHDUFLAG | Total packets | Discarded packets |
| A | 0 | 114 | 0 |
| B | 0 | 114 | 0 |
| C | 0 | 114 | 0 |
| D | 0 | 114 | 0 |
| Mode M0 | |||
|---|---|---|---|
| Quadrant | BADHDUFLAG | Total packets | Discarded packets |
| A | 0 | 14158 | 3 |
| B | 0 | 11818 | 2 |
| C | 0 | 23678 | 2 |
| D | 0 | 20154 | 2 |
| Quadrant | Total seconds | Saturated seconds | Saturation percentage |
|---|---|---|---|
| A | 5643 | 143 | 2.534113% |
| B | 5643 | 35 | 0.620237% |
| C | 5643 | 902 | 15.984405% |
| D | 5643 | 871 | 15.435052% |
Noise dominated data is calculated using 1-second bins in cleaned event files. If a bin has >2000 counts, and if more than 50% of those come from <1% of pixels, then it is considered to be noise-dominated and hence unusable.
| Quadrant | # 1 sec bins | Bins with >0 counts | Bins with >2000 counts | High rate bins dominated by noise | Noise dominated (total time) | Noise dominated (detector-on time) | Marked lightcurve |
|---|---|---|---|---|---|---|---|
| A | 7167 | 5644 | 140 | 140 | 1.95% | 2.48% | 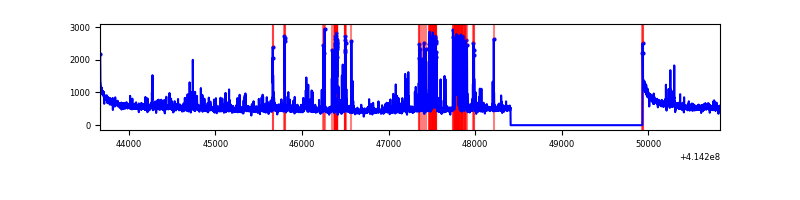 |
| B | 7167 | 5644 | 22 | 22 | 0.31% | 0.39% | 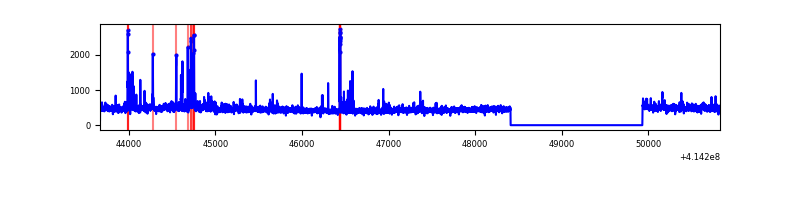 |
| C | 7166 | 5643 | 786 | 786 | 10.97% | 13.93% | 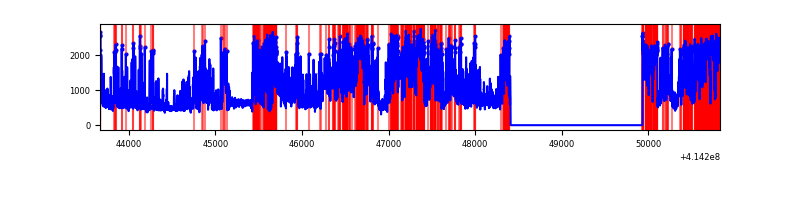 |
| D | 7167 | 5644 | 882 | 882 | 12.31% | 15.63% |  |
Top three noisy pixels from each quadrant. If the there are fewer than three noisy pixels in the level2.evt file, extra rows are filled as -1
| Pixel properties | Quadrant properties | ||||||
|---|---|---|---|---|---|---|---|
| Quadrant | DetID | PixID | Counts | Sigma | Mean | Median | Sigma |
| A | 10 | 83 | 495290 | 3921.64 | 616 | 603 | 126.1 |
| A | 2 | 79 | 478995 | 3792.46 | 616 | 603 | 126.1 |
| A | 6 | 10 | 106767 | 841.62 | 616 | 603 | 126.1 |
| B | 5 | 255 | 83891 | 689.56 | 616 | 598 | 120.8 |
| B | 0 | 230 | 65765 | 539.5 | 616 | 598 | 120.8 |
| B | 5 | 32 | 60990 | 499.97 | 616 | 598 | 120.8 |
| C | 9 | 54 | 4107159 | 30756.44 | 573 | 577 | 133.5 |
| C | 15 | 214 | 224534 | 1677.34 | 573 | 577 | 133.5 |
| C | 0 | 10 | 26714 | 195.75 | 573 | 577 | 133.5 |
| D | 2 | 249 | 1465136 | 10459.85 | 561 | 545 | 140.0 |
| D | 2 | 250 | 767670 | 5478.67 | 561 | 545 | 140.0 |
| D | 12 | 227 | 712598 | 5085.36 | 561 | 545 | 140.0 |
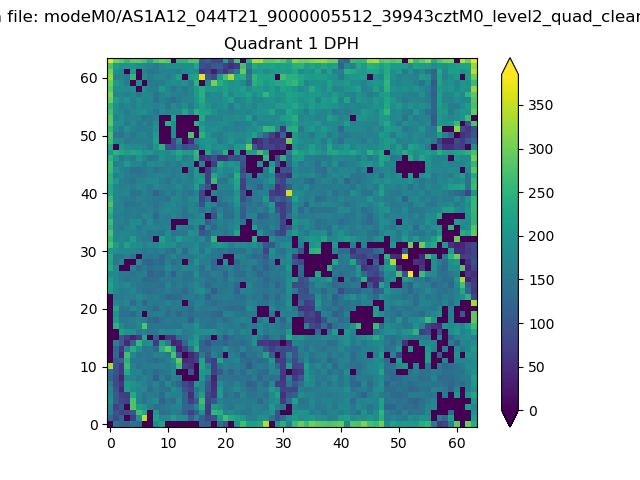
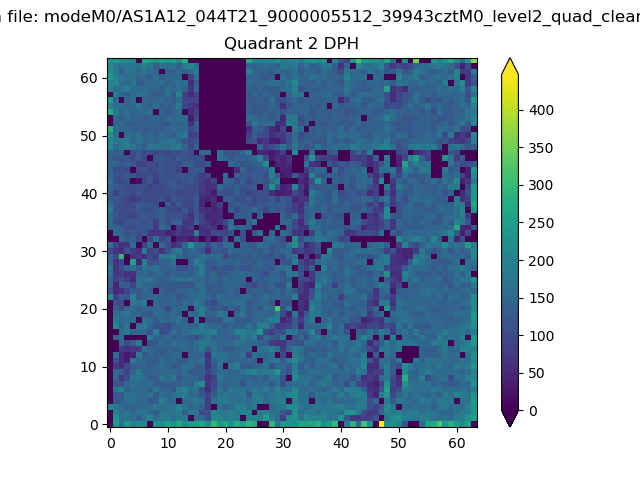
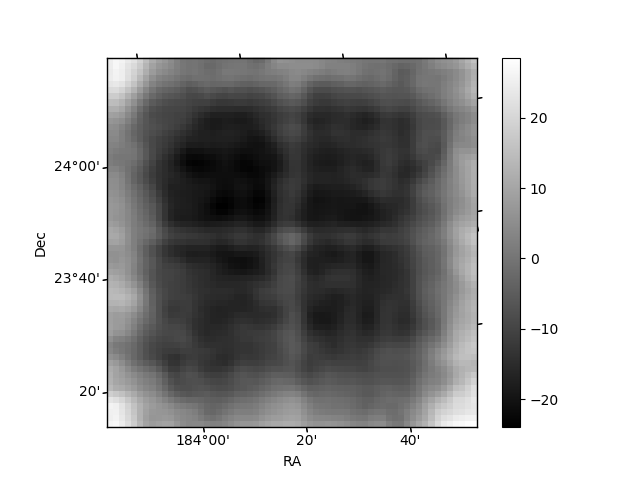
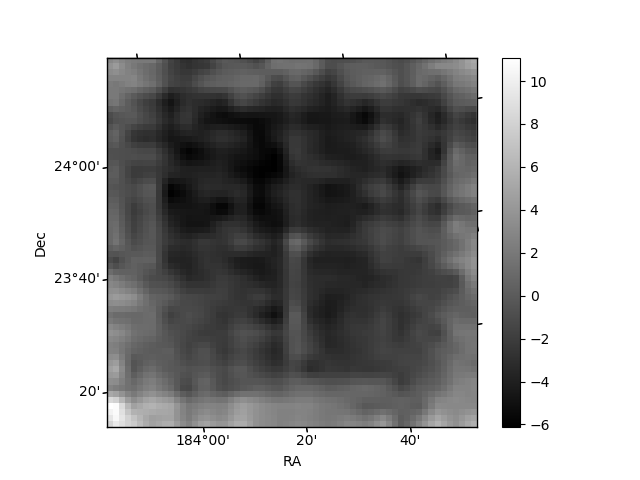
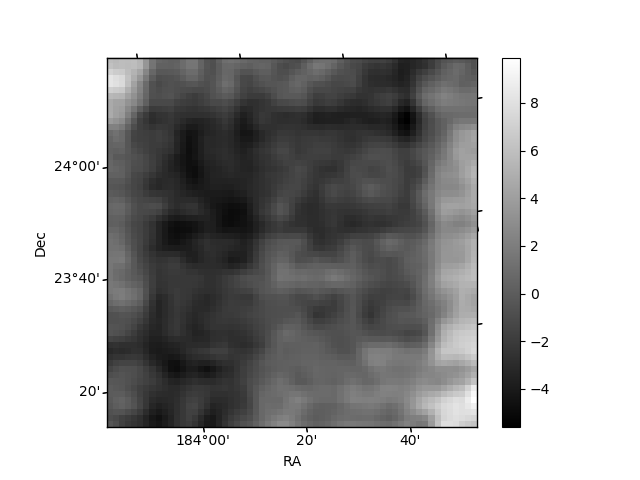
Histogram calculated using DETX and DETY for each event in the final _common_clean file
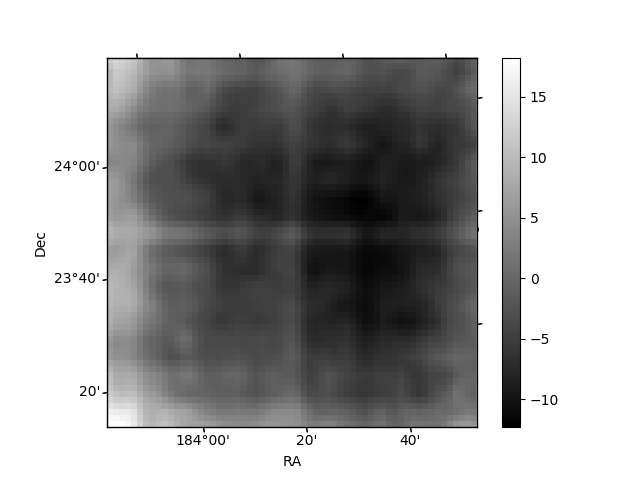
| Quadrant A | 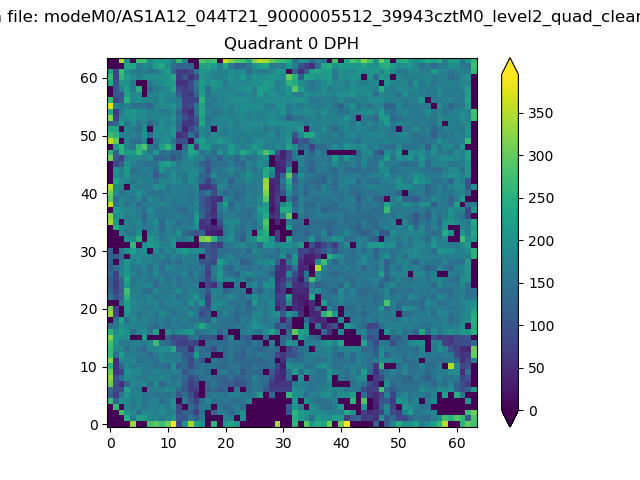 |
 |
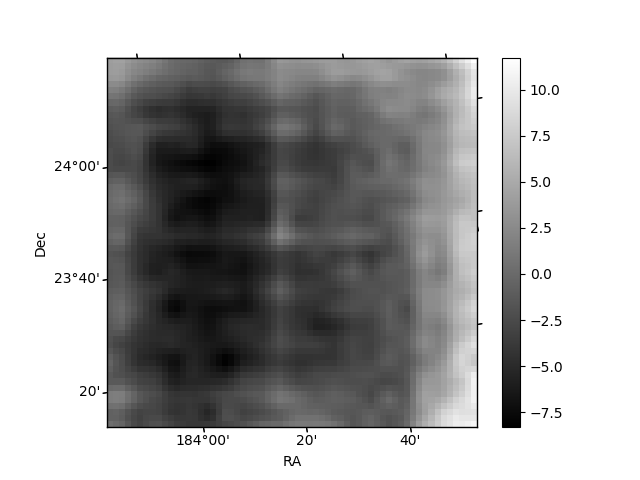
Quadrant B |
|---|---|---|---|
| Quadrant D | 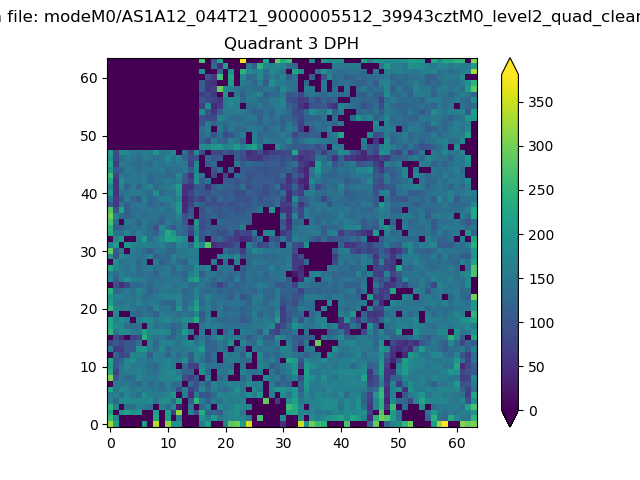 |
 |
Quadrant C |
| Plot type | Count rate plots | Images |
|---|---|---|
| Comparison with Poisson distribution Blue bars denote a histogram of data divided into 1 sec bins. Red curve is a Poisson curve with rate = median count rate of data. |
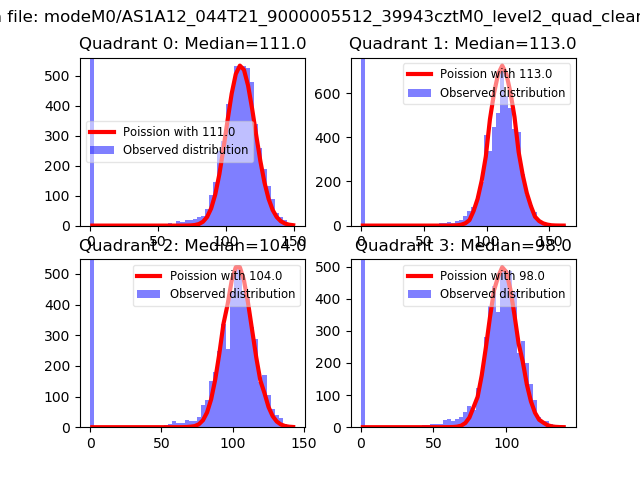 |
 |
| Quadrant-wise count rates Data is divided into 100 sec bins |
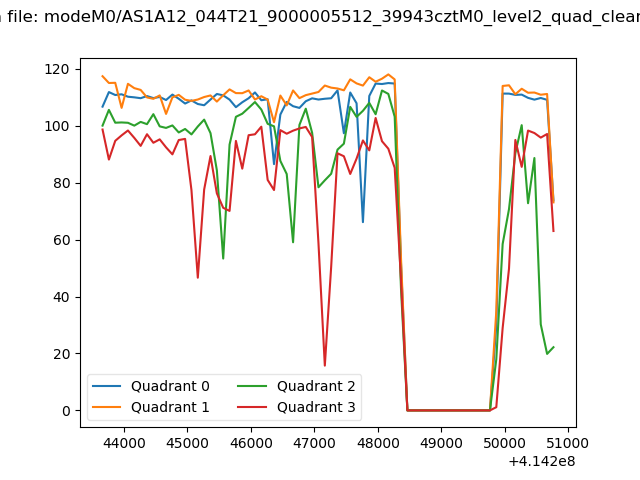 |
|
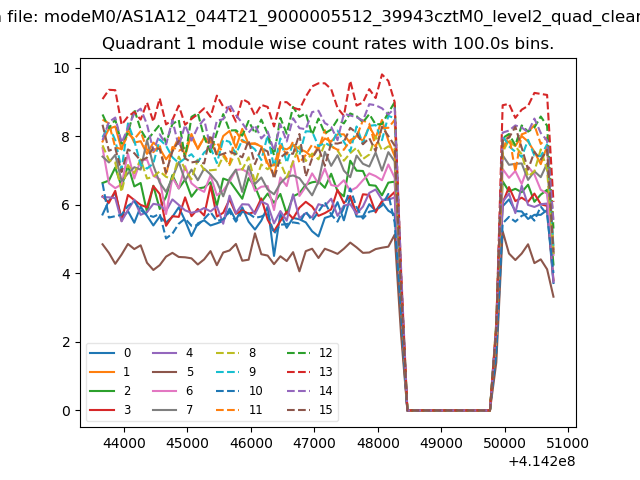
| Module-wise count rates for Quadrant A Data is divided into 100 sec bins |
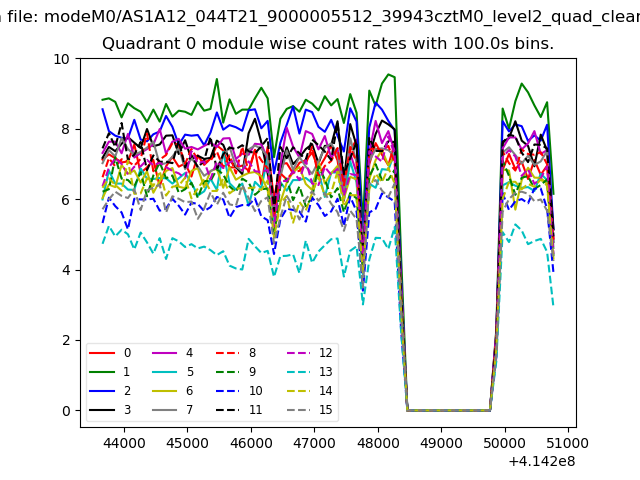 |
 |
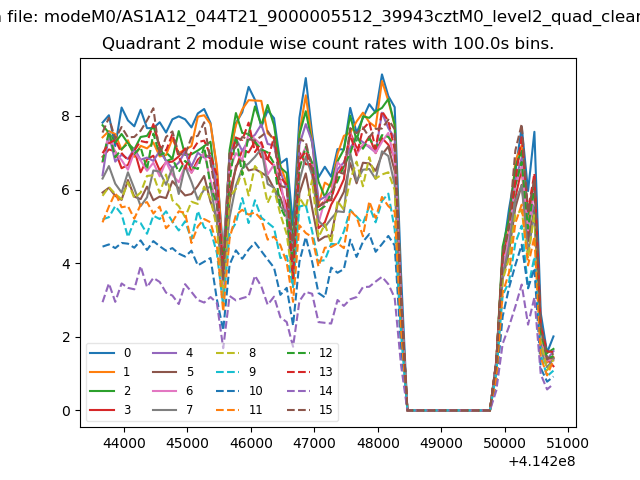
| Module-wise count rates for Quadrant B Data is divided into 100 sec bins |
 |
 |
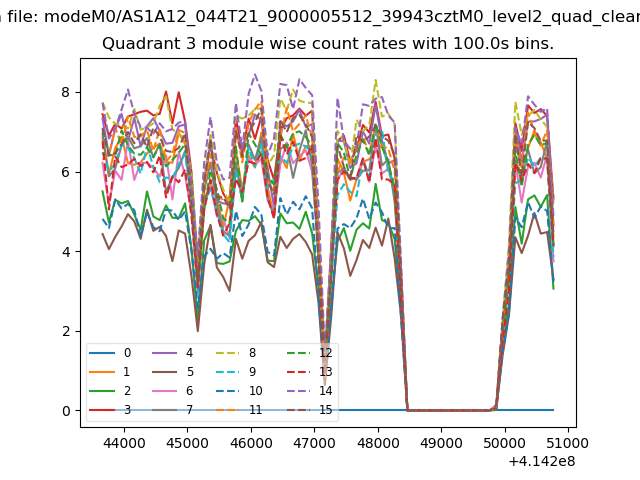
| Module-wise count rates for Quadrant C Data is divided into 100 sec bins |
 |
 |
| Module-wise count rates for Quadrant D Data is divided into 100 sec bins |
 |
 |
| Parameter | Plot |
|---|---|
| CZT HV Monitor | 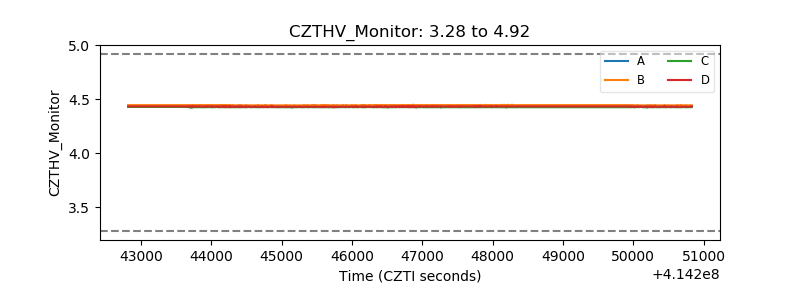 |
| D_VDD | 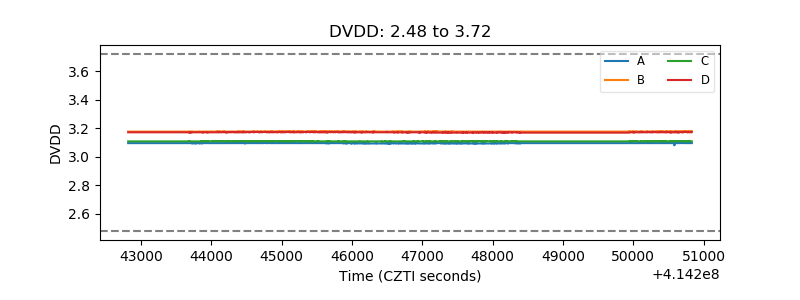 |
| Temperature 1 | 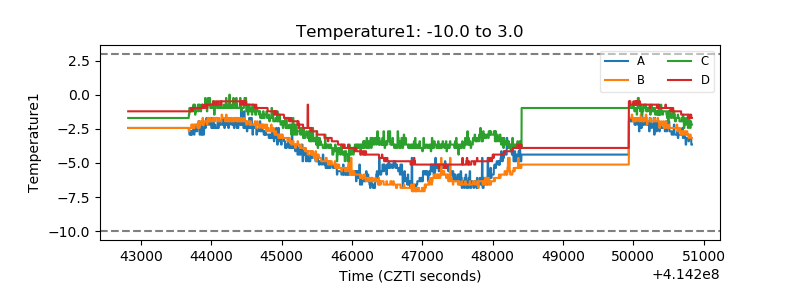 |
| Veto HV Monitor | 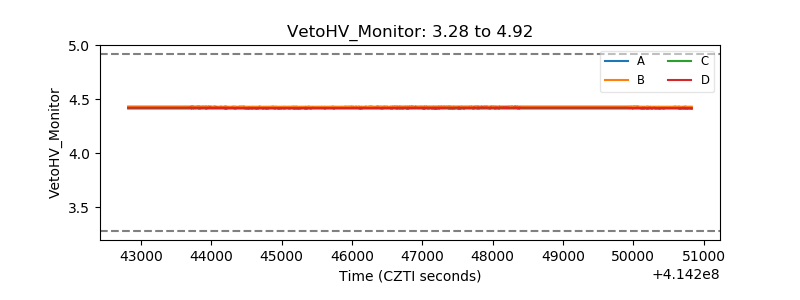 |
| Veto LLD | 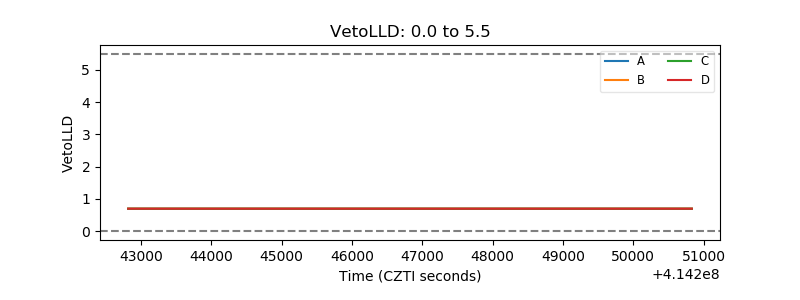 |
| Alpha Counter | 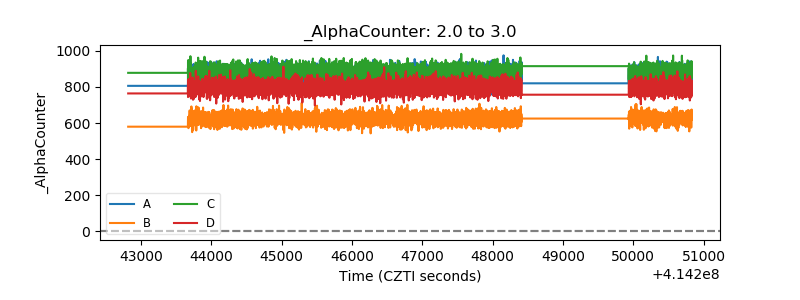 |
| _CPM_Rate | 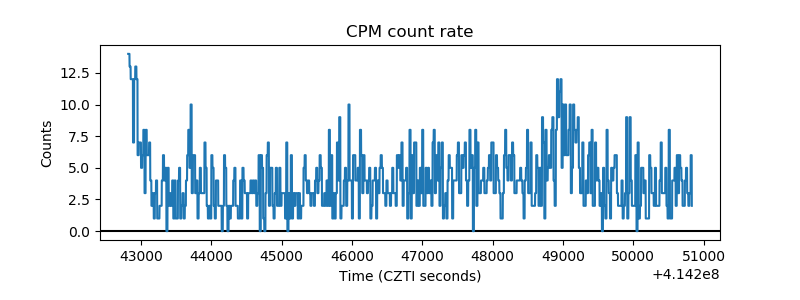 |
| CZT Counter | 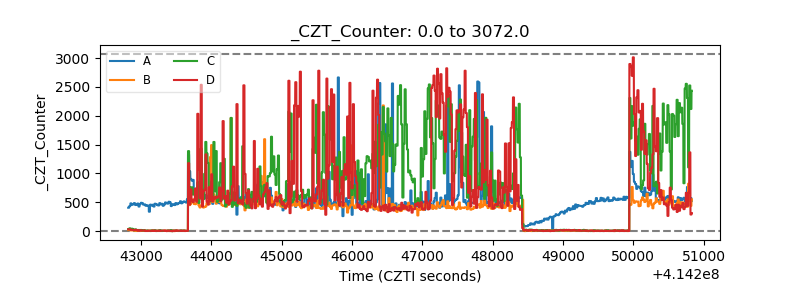 |
| +2.5 Volts monitor | 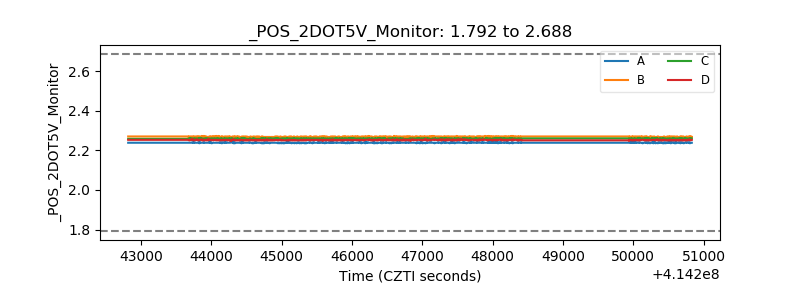 |
| +5 Volts monitor | 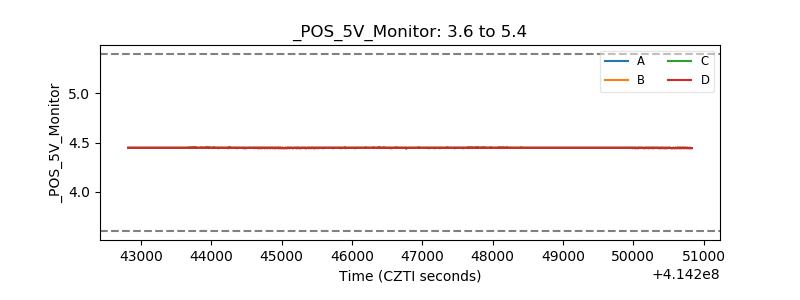 |
| _ROLL_ROT | 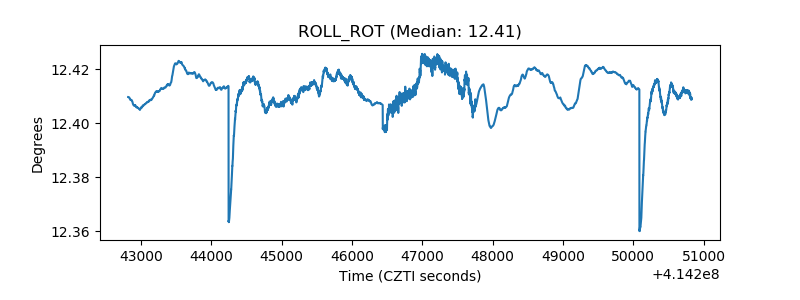 |
| _Roll_DEC | 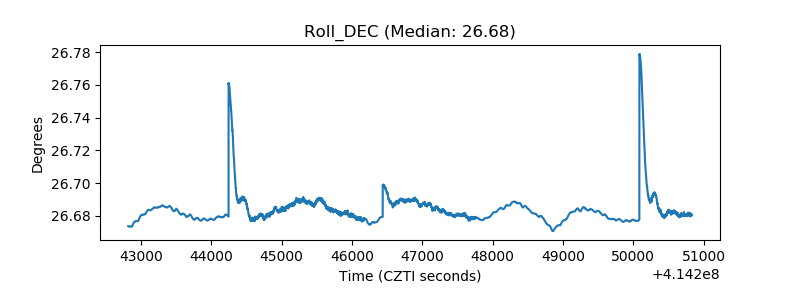 |
| _Roll_RA |  |
| Veto Counter | 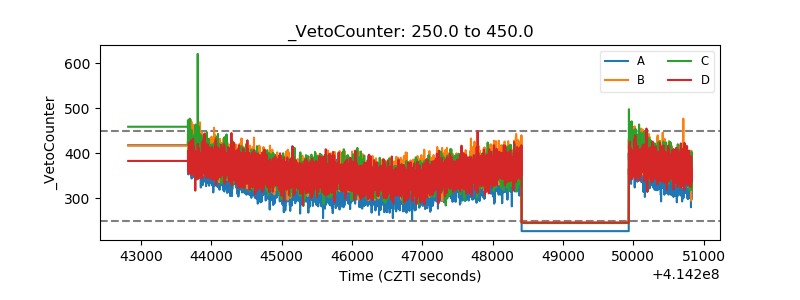 |