| Param | Original file | Final file |
|---|---|---|
| Filename | modeM0/AS1A12_044T21_9000005512_39944cztM0_level2.fits | modeM0/AS1A12_044T21_9000005512_39944cztM0_level2_quad_clean.evt |
| Size (bytes) | 514,255,680 | 90,002,880 |
| Size | 490.4 MB | 85.8 MB |
| Events in quadrant A | 3,155,401 | 654,610 |
| Events in quadrant B | 2,881,250 | 658,096 |
| Events in quadrant C | 8,442,666 | 439,669 |
| Events in quadrant D | 4,097,616 | 560,043 |
| Mode M9 | |||
|---|---|---|---|
| Quadrant | BADHDUFLAG | Total packets | Discarded packets |
| A | 0 | 25 | 0 |
| B | 0 | 25 | 0 |
| C | 0 | 25 | 0 |
| D | 0 | 26 | 0 |
| Mode SS | |||
|---|---|---|---|
| Quadrant | BADHDUFLAG | Total packets | Discarded packets |
| A | 0 | 120 | 0 |
| B | 0 | 120 | 0 |
| C | 0 | 120 | 0 |
| D | 0 | 120 | 0 |
| Mode M0 | |||
|---|---|---|---|
| Quadrant | BADHDUFLAG | Total packets | Discarded packets |
| A | 0 | 13075 | 3 |
| B | 0 | 12599 | 2 |
| C | 0 | 29127 | 2 |
| D | 0 | 16475 | 2 |
| Quadrant | Total seconds | Saturated seconds | Saturation percentage |
|---|---|---|---|
| A | 5906 | 24 | 0.406366% |
| B | 5906 | 49 | 0.829665% |
| C | 5906 | 2089 | 35.370809% |
| D | 5906 | 350 | 5.926177% |
Noise dominated data is calculated using 1-second bins in cleaned event files. If a bin has >2000 counts, and if more than 50% of those come from <1% of pixels, then it is considered to be noise-dominated and hence unusable.
| Quadrant | # 1 sec bins | Bins with >0 counts | Bins with >2000 counts | High rate bins dominated by noise | Noise dominated (total time) | Noise dominated (detector-on time) | Marked lightcurve |
|---|---|---|---|---|---|---|---|
| A | 7250 | 5907 | 18 | 18 | 0.25% | 0.30% |  |
| B | 7250 | 5907 | 37 | 37 | 0.51% | 0.63% |  |
| C | 7250 | 5907 | 1897 | 1897 | 26.17% | 32.11% | 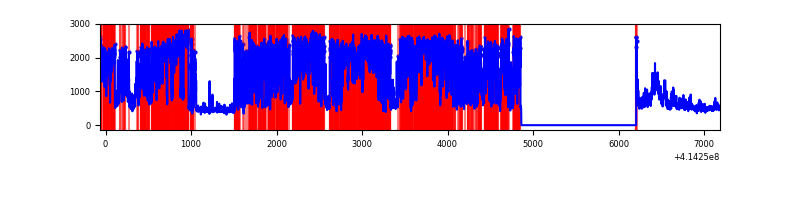 |
| D | 7250 | 5907 | 307 | 307 | 4.23% | 5.20% | 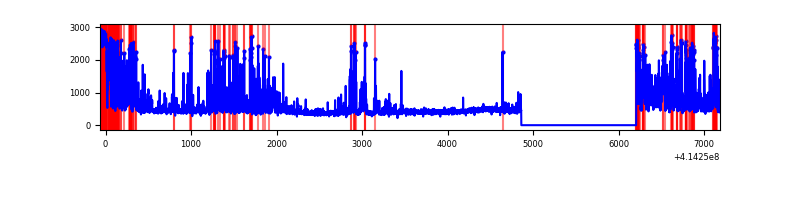 |
Top three noisy pixels from each quadrant. If the there are fewer than three noisy pixels in the level2.evt file, extra rows are filled as -1
| Pixel properties | Quadrant properties | ||||||
|---|---|---|---|---|---|---|---|
| Quadrant | DetID | PixID | Counts | Sigma | Mean | Median | Sigma |
| A | 10 | 83 | 516569 | 3866.73 | 651 | 640 | 133.4 |
| A | 13 | 248 | 57605 | 426.93 | 651 | 640 | 133.4 |
| A | 2 | 79 | 19807 | 143.65 | 651 | 640 | 133.4 |
| B | 5 | 255 | 223861 | 1756.92 | 643 | 626 | 127.1 |
| B | 0 | 230 | 52962 | 411.9 | 643 | 626 | 127.1 |
| B | 0 | 183 | 33549 | 259.11 | 643 | 626 | 127.1 |
| C | 9 | 54 | 5971628 | 45246.62 | 560 | 564 | 132.0 |
| C | 15 | 214 | 221186 | 1671.8 | 560 | 564 | 132.0 |
| C | 3 | 233 | 28267 | 209.92 | 560 | 564 | 132.0 |
| D | 2 | 249 | 717217 | 4697.31 | 617 | 600 | 152.6 |
| D | 2 | 250 | 362516 | 2372.3 | 617 | 600 | 152.6 |
| D | 13 | 249 | 232688 | 1521.3 | 617 | 600 | 152.6 |
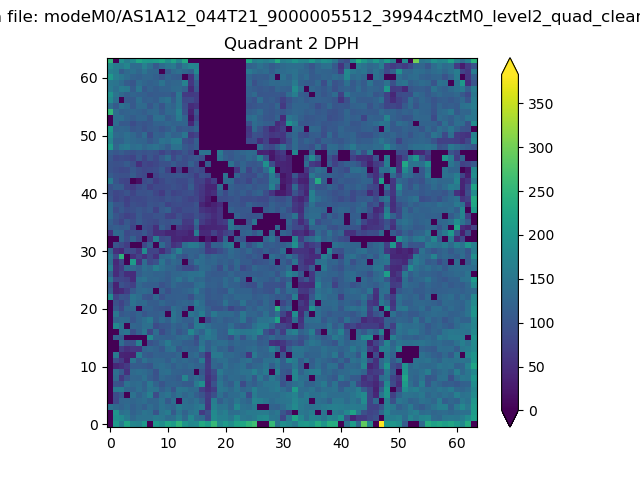
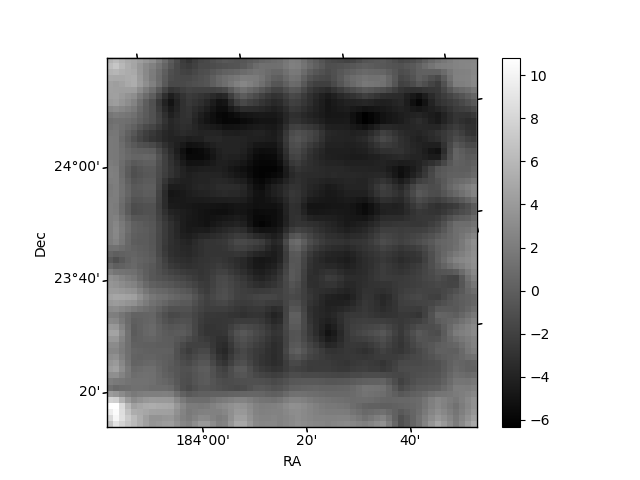
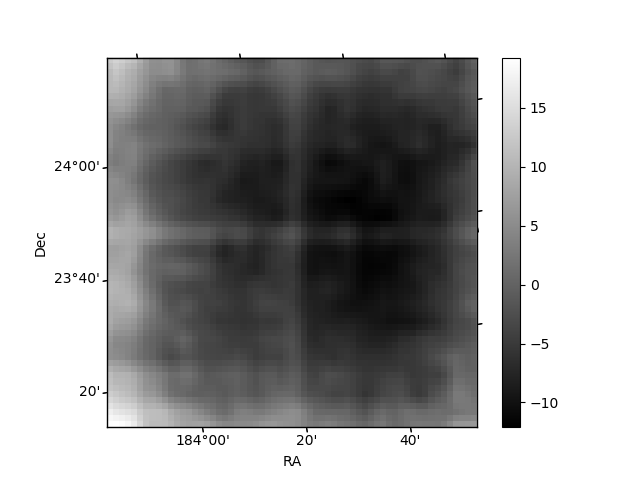
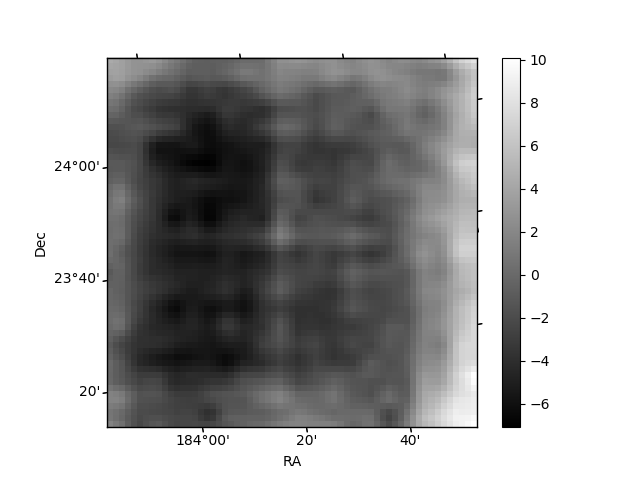
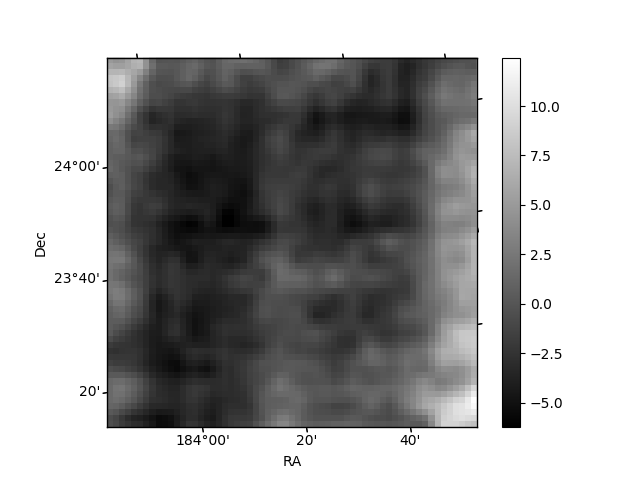
Histogram calculated using DETX and DETY for each event in the final _common_clean file
| Quadrant A | 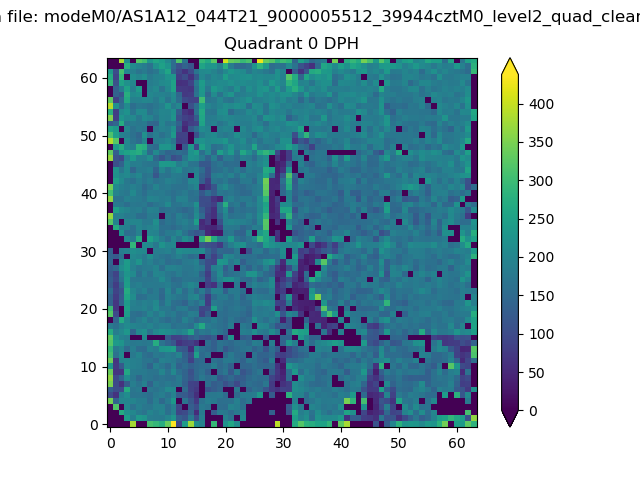 |
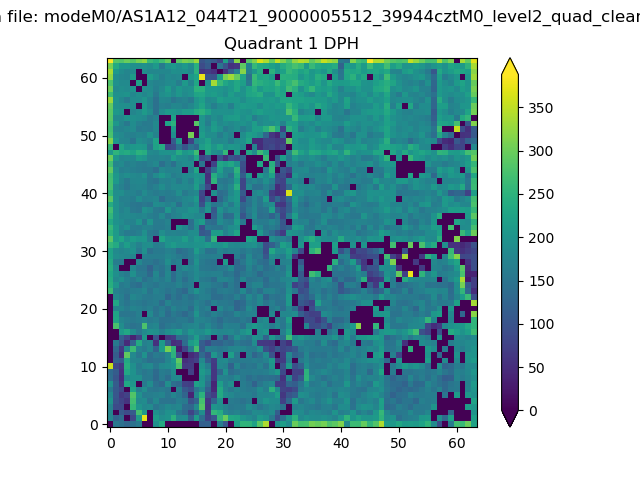 |
Quadrant B |
|---|---|---|---|
| Quadrant D | 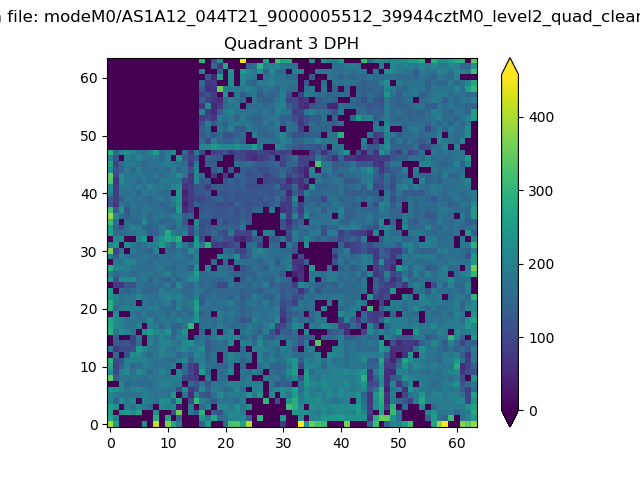 |
 |
Quadrant C |
| Plot type | Count rate plots | Images |
|---|---|---|
| Comparison with Poisson distribution Blue bars denote a histogram of data divided into 1 sec bins. Red curve is a Poisson curve with rate = median count rate of data. |
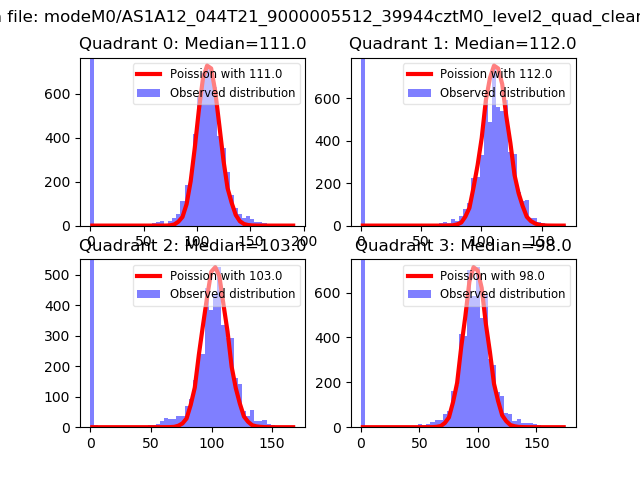 |
 |
| Quadrant-wise count rates Data is divided into 100 sec bins |
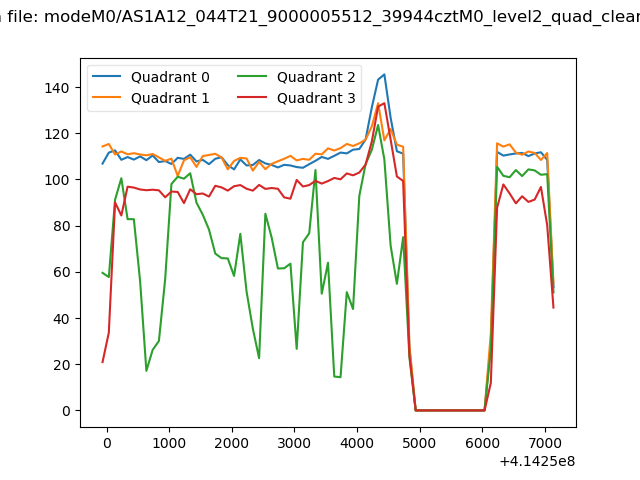 |
|
| Module-wise count rates for Quadrant A Data is divided into 100 sec bins |
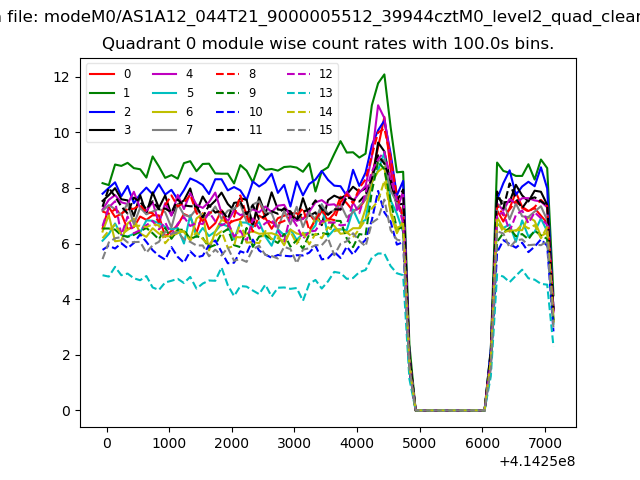 |
 |
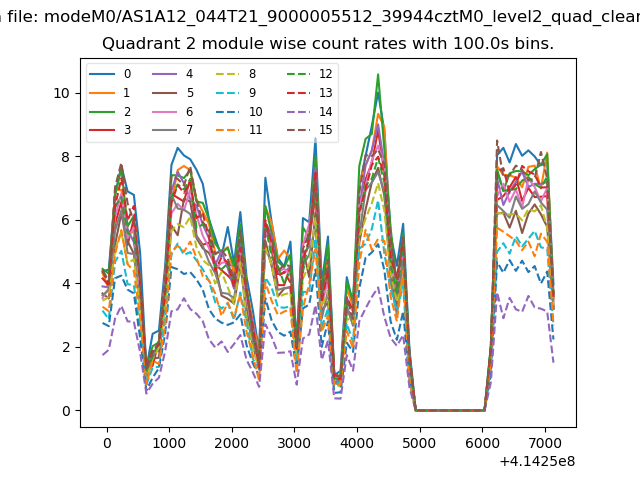
| Module-wise count rates for Quadrant B Data is divided into 100 sec bins |
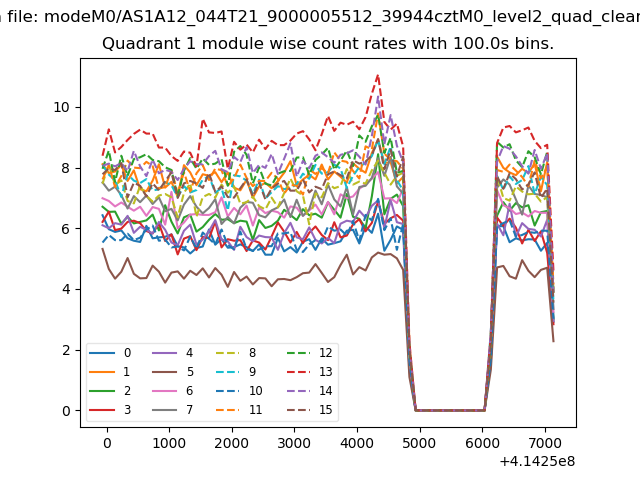 |
 |
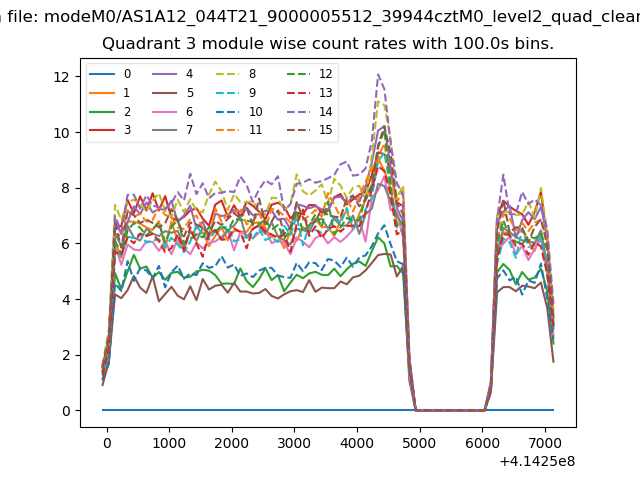
| Module-wise count rates for Quadrant C Data is divided into 100 sec bins |
 |
 |
| Module-wise count rates for Quadrant D Data is divided into 100 sec bins |
 |
 |
| Parameter | Plot |
|---|---|
| CZT HV Monitor | 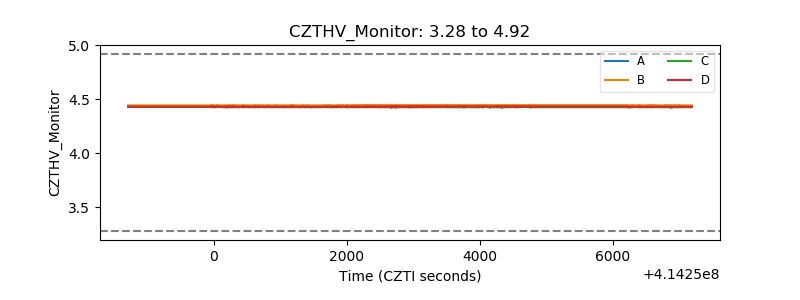 |
| D_VDD | 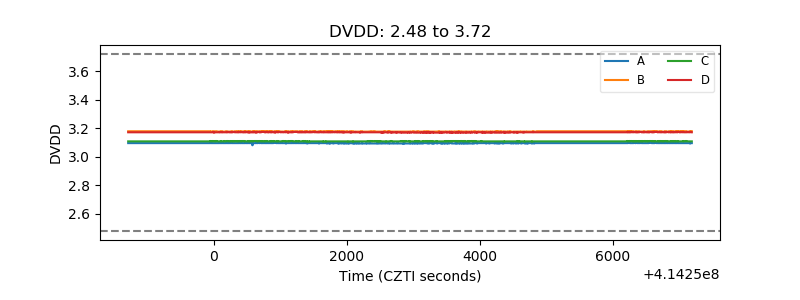 |
| Temperature 1 | 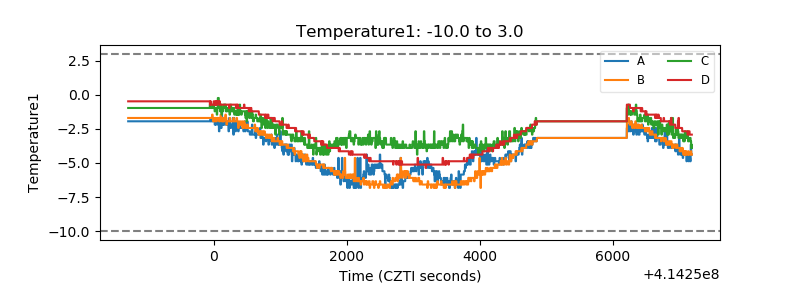 |
| Veto HV Monitor | 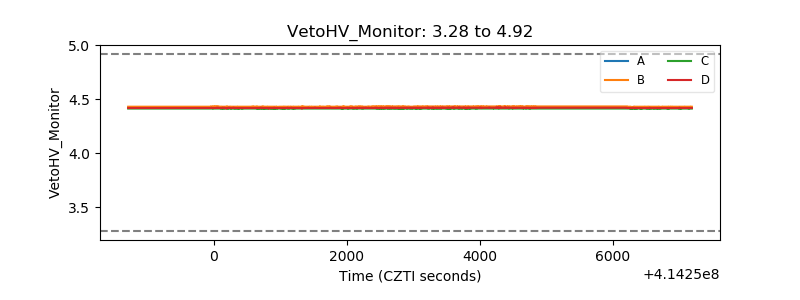 |
| Veto LLD | 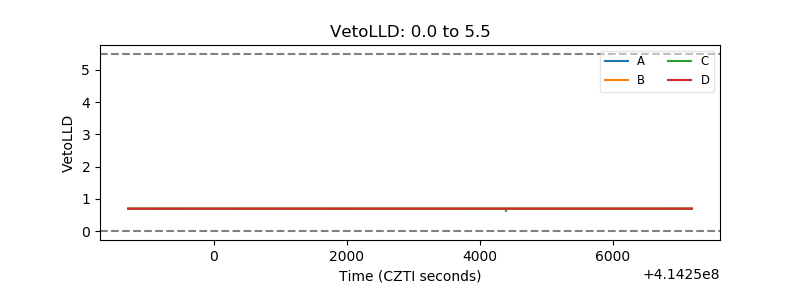 |
| Alpha Counter | 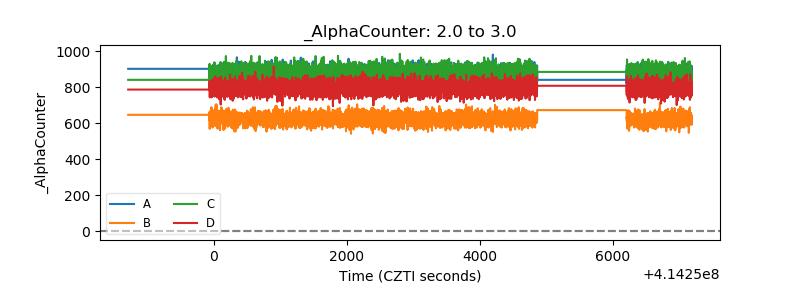 |
| _CPM_Rate | 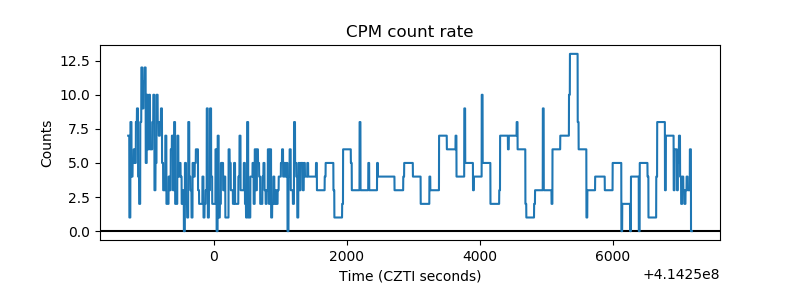 |
| CZT Counter | 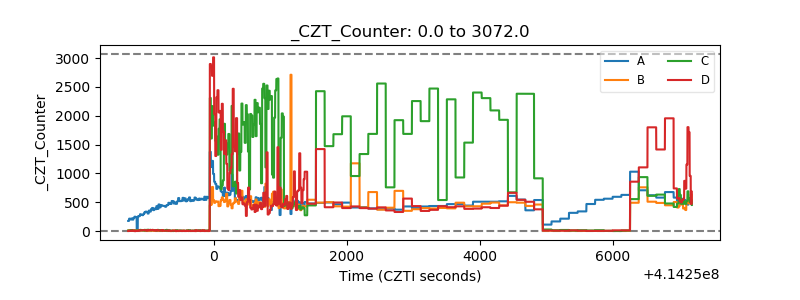 |
| +2.5 Volts monitor | 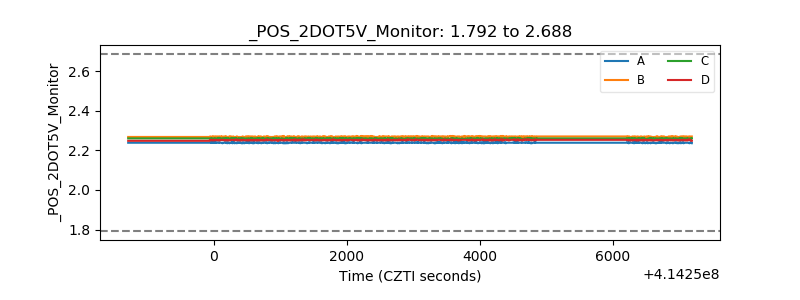 |
| +5 Volts monitor | 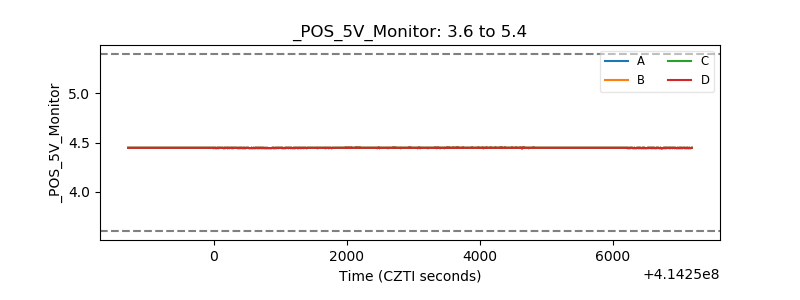 |
| _ROLL_ROT | 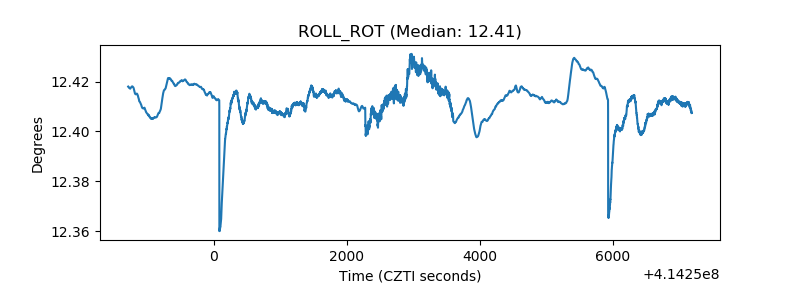 |
| _Roll_DEC | 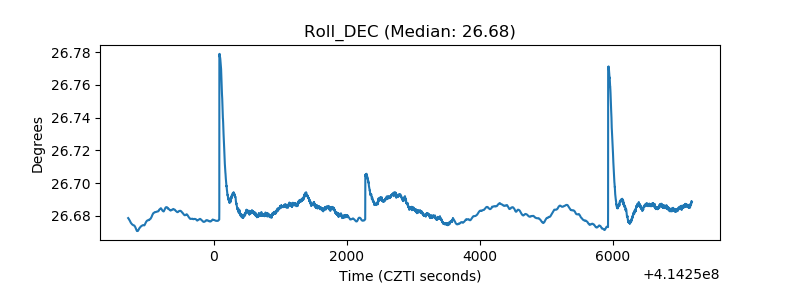 |
| _Roll_RA | 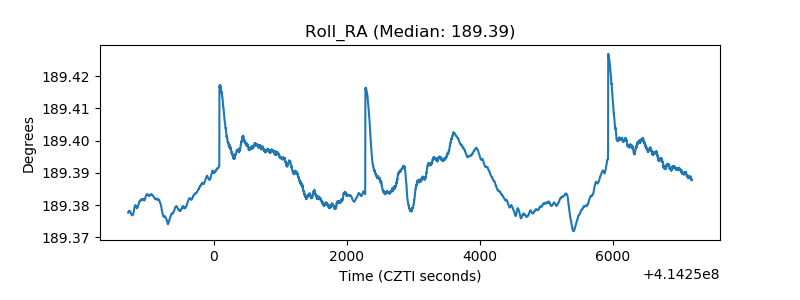 |
| Veto Counter | 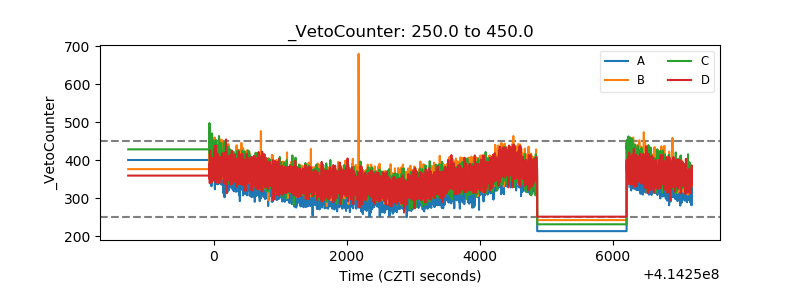 |