| Param | Original file | Final file |
|---|---|---|
| Filename | modeM0/AS1A12_044T21_9000005512_39945cztM0_level2.fits | modeM0/AS1A12_044T21_9000005512_39945cztM0_level2_quad_clean.evt |
| Size (bytes) | 178,937,280 | 38,459,520 |
| Size | 170.6 MB | 36.7 MB |
| Events in quadrant A | 1,312,625 | 263,617 |
| Events in quadrant B | 1,169,988 | 266,429 |
| Events in quadrant C | 2,086,857 | 235,576 |
| Events in quadrant D | 1,866,631 | 226,657 |
| Mode M9 | |||
|---|---|---|---|
| Quadrant | BADHDUFLAG | Total packets | Discarded packets |
| A | 0 | 13 | 0 |
| B | 0 | 13 | 0 |
| C | 0 | 13 | 0 |
| D | 0 | 13 | 0 |
| Mode SS | |||
|---|---|---|---|
| Quadrant | BADHDUFLAG | Total packets | Discarded packets |
| A | 0 | 52 | 0 |
| B | 0 | 52 | 0 |
| C | 0 | 52 | 0 |
| D | 0 | 52 | 0 |
| Mode M0 | |||
|---|---|---|---|
| Quadrant | BADHDUFLAG | Total packets | Discarded packets |
| A | 0 | 5384 | 1 |
| B | 0 | 5089 | 1 |
| C | 0 | 7793 | 1 |
| D | 0 | 7233 | 1 |
| Quadrant | Total seconds | Saturated seconds | Saturation percentage |
|---|---|---|---|
| A | 2386 | 7 | 0.293378% |
| B | 2386 | 11 | 0.461023% |
| C | 2386 | 180 | 7.544007% |
| D | 2386 | 139 | 5.825650% |
Noise dominated data is calculated using 1-second bins in cleaned event files. If a bin has >2000 counts, and if more than 50% of those come from <1% of pixels, then it is considered to be noise-dominated and hence unusable.
| Quadrant | # 1 sec bins | Bins with >0 counts | Bins with >2000 counts | High rate bins dominated by noise | Noise dominated (total time) | Noise dominated (detector-on time) | Marked lightcurve |
|---|---|---|---|---|---|---|---|
| A | 3730 | 2387 | 7 | 7 | 0.19% | 0.29% | 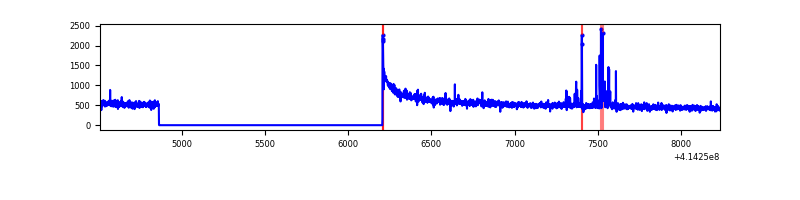 |
| B | 3730 | 2387 | 6 | 6 | 0.16% | 0.25% | 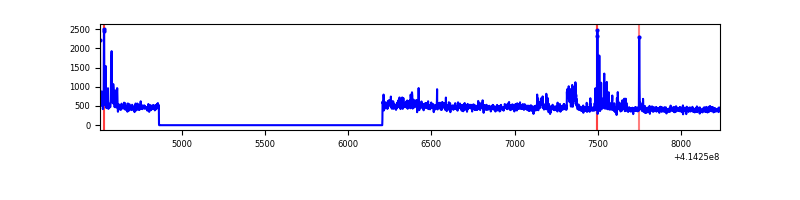 |
| C | 3730 | 2387 | 159 | 159 | 4.26% | 6.66% | 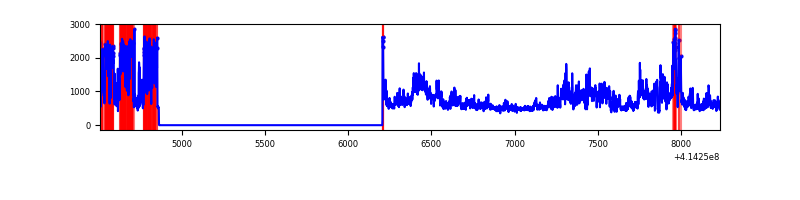 |
| D | 3730 | 2387 | 115 | 115 | 3.08% | 4.82% | 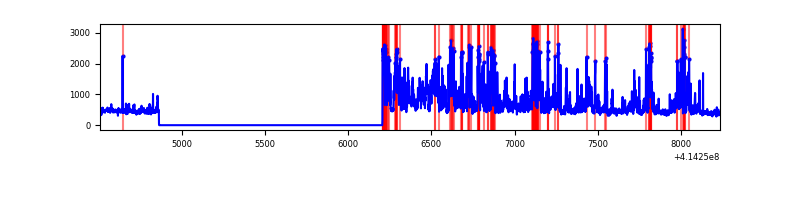 |
Top three noisy pixels from each quadrant. If the there are fewer than three noisy pixels in the level2.evt file, extra rows are filled as -1
| Pixel properties | Quadrant properties | ||||||
|---|---|---|---|---|---|---|---|
| Quadrant | DetID | PixID | Counts | Sigma | Mean | Median | Sigma |
| A | 10 | 83 | 230003 | 4077.99 | 265 | 260 | 56.3 |
| A | 13 | 248 | 34101 | 600.69 | 265 | 260 | 56.3 |
| A | 2 | 79 | 8240 | 141.65 | 265 | 260 | 56.3 |
| B | 0 | 183 | 55849 | 1051.8 | 263 | 256 | 52.9 |
| B | 5 | 255 | 27345 | 512.51 | 263 | 256 | 52.9 |
| B | 4 | 170 | 25460 | 476.85 | 263 | 256 | 52.9 |
| C | 9 | 54 | 977129 | 16004.49 | 252 | 254 | 61.0 |
| C | 15 | 214 | 98103 | 1603.1 | 252 | 254 | 61.0 |
| C | 0 | 10 | 15230 | 245.36 | 252 | 254 | 61.0 |
| D | 2 | 249 | 472337 | 7371.09 | 254 | 246 | 64.0 |
| D | 2 | 153 | 146642 | 2285.78 | 254 | 246 | 64.0 |
| D | 2 | 250 | 82428 | 1283.17 | 254 | 246 | 64.0 |
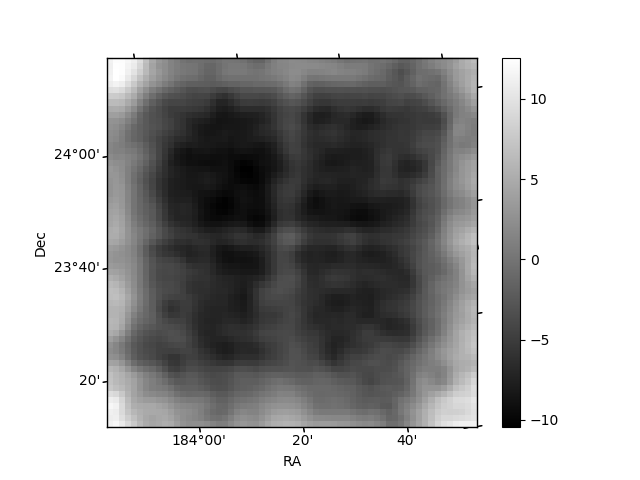
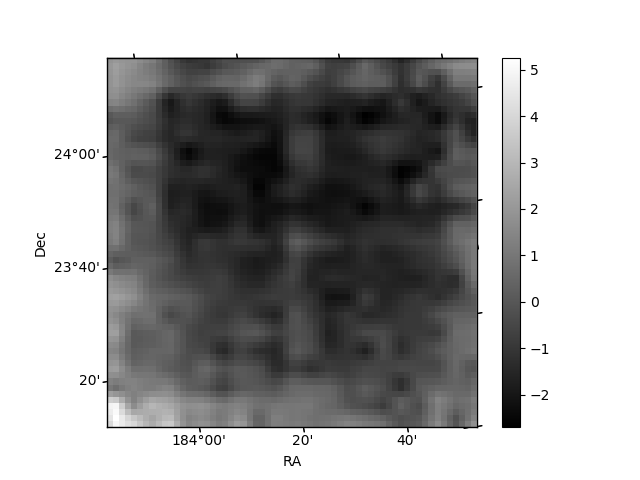
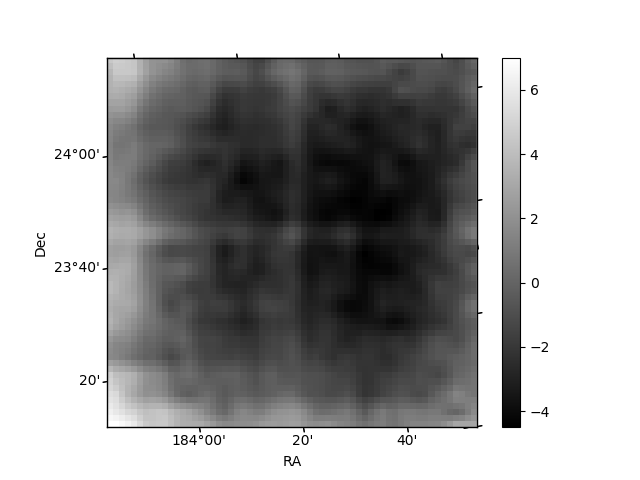
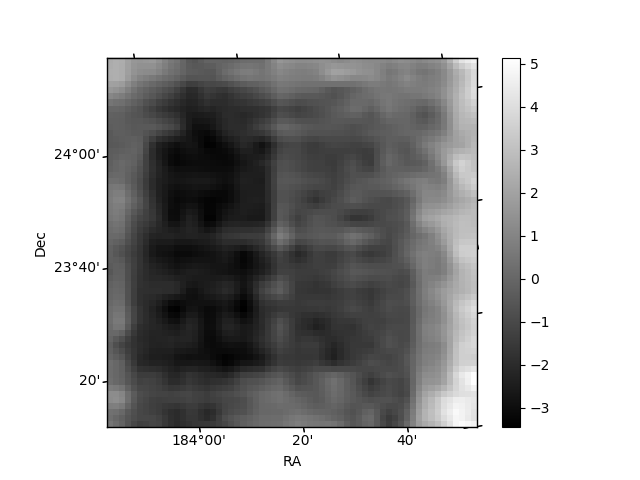
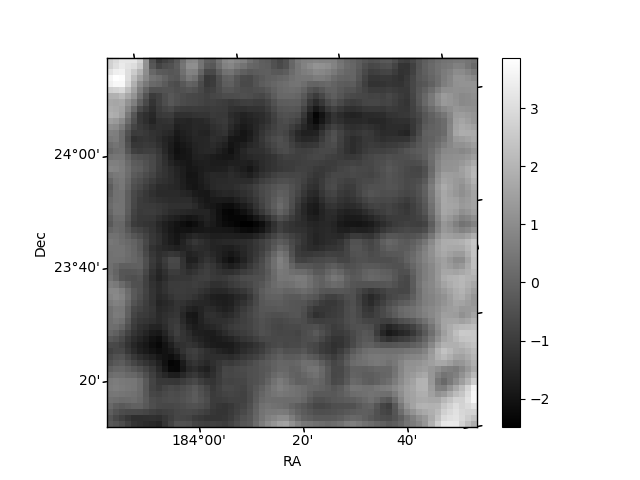
Histogram calculated using DETX and DETY for each event in the final _common_clean file
| Quadrant A | 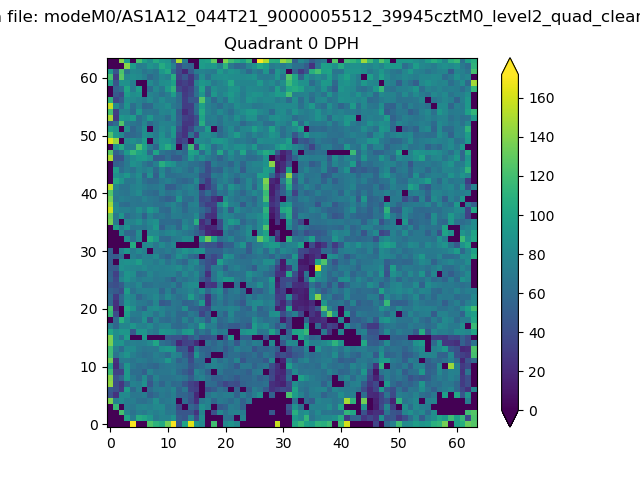 |
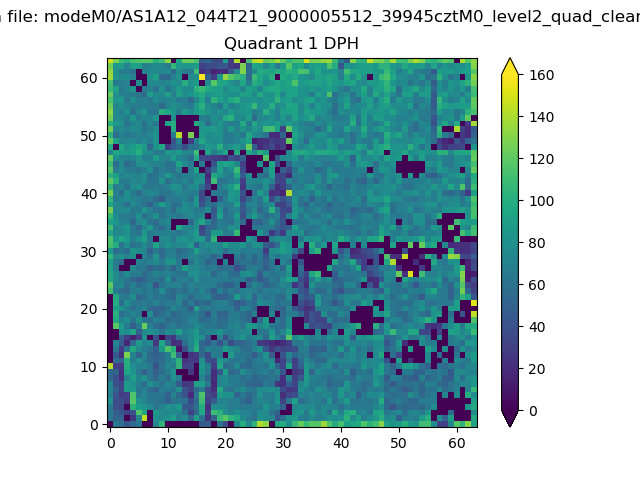 |
Quadrant B |
|---|---|---|---|
| Quadrant D |  |
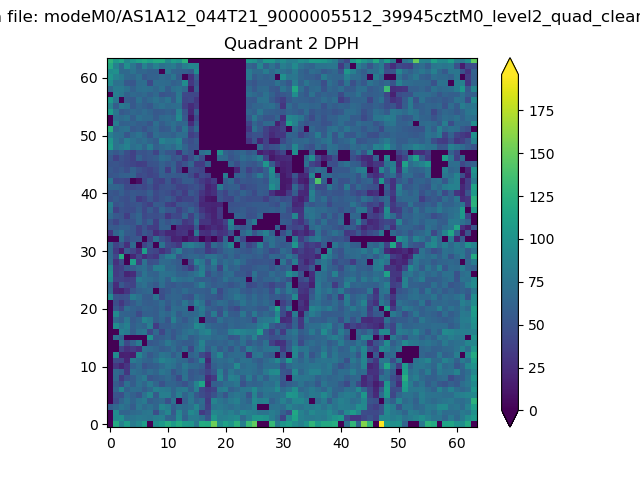 |
Quadrant C |
| Plot type | Count rate plots | Images |
|---|---|---|
| Comparison with Poisson distribution Blue bars denote a histogram of data divided into 1 sec bins. Red curve is a Poisson curve with rate = median count rate of data. |
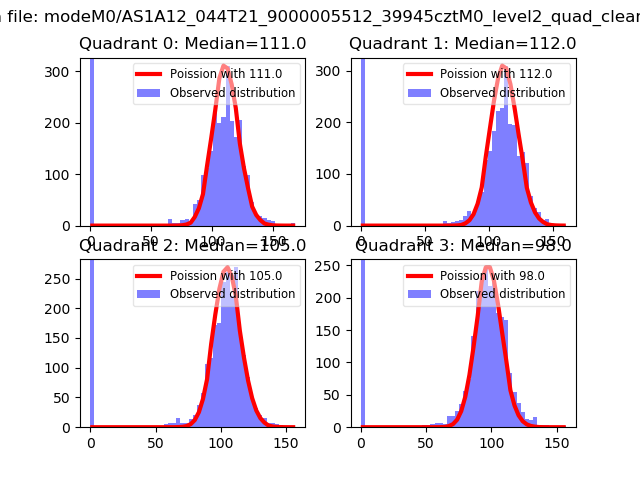 |
 |
| Quadrant-wise count rates Data is divided into 100 sec bins |
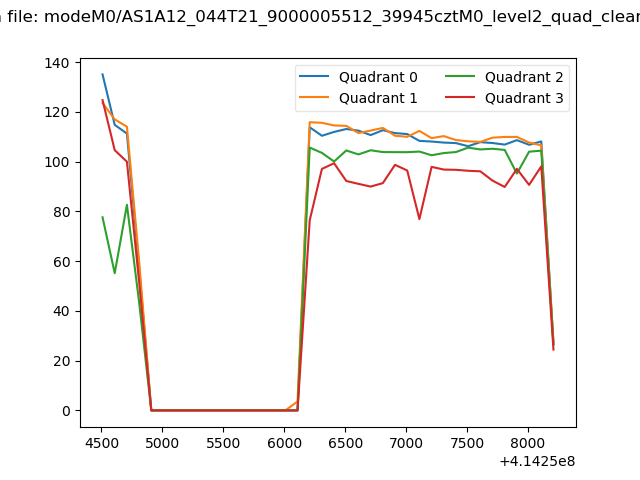 |
|
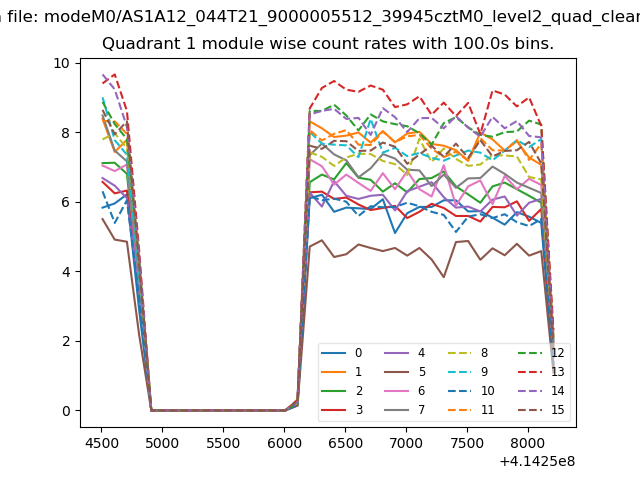
| Module-wise count rates for Quadrant A Data is divided into 100 sec bins |
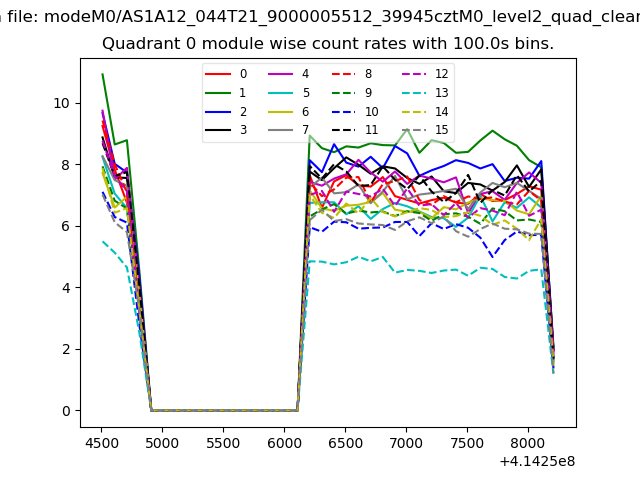 |
 |
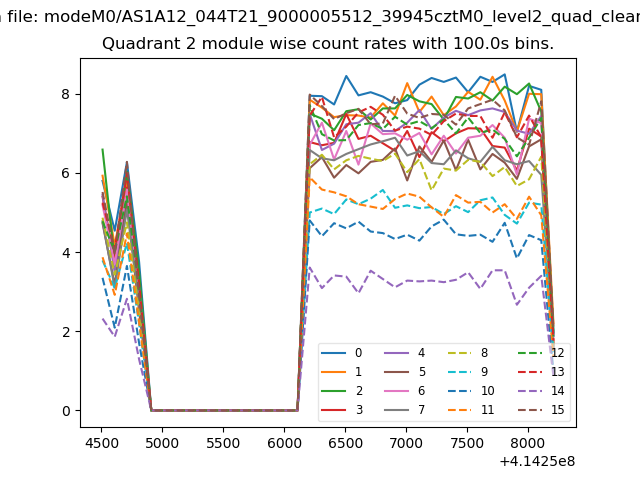
| Module-wise count rates for Quadrant B Data is divided into 100 sec bins |
 |
 |
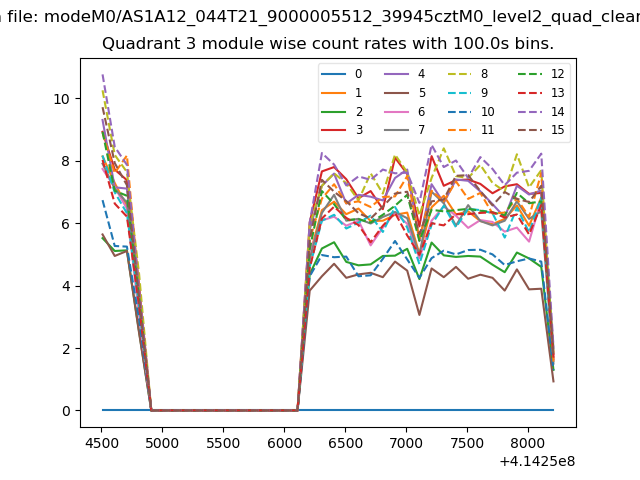
| Module-wise count rates for Quadrant C Data is divided into 100 sec bins |
 |
 |
| Module-wise count rates for Quadrant D Data is divided into 100 sec bins |
 |
 |
| Parameter | Plot |
|---|---|
| CZT HV Monitor | 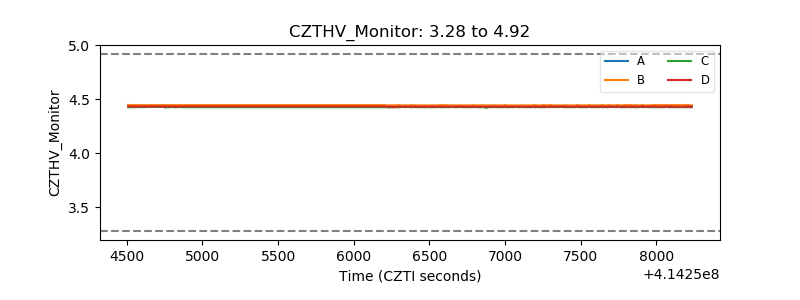 |
| D_VDD | 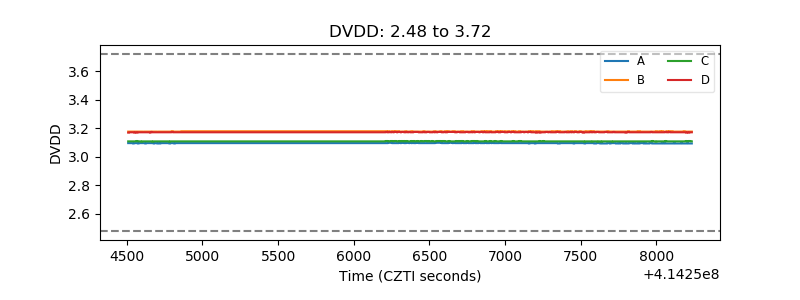 |
| Temperature 1 | 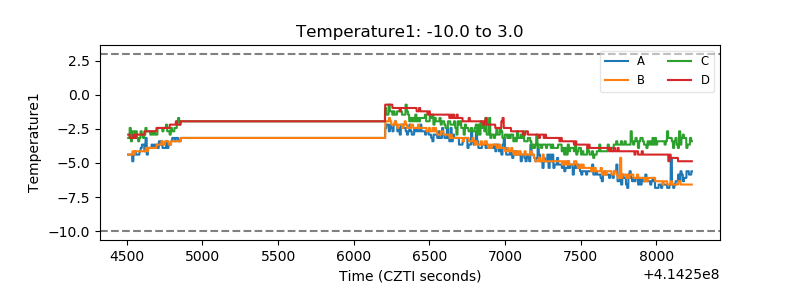 |
| Veto HV Monitor | 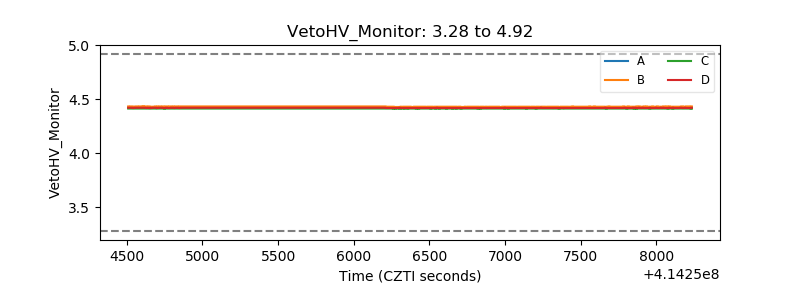 |
| Veto LLD | 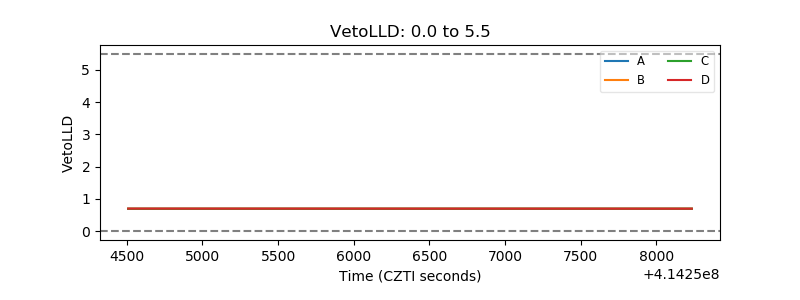 |
| Alpha Counter | 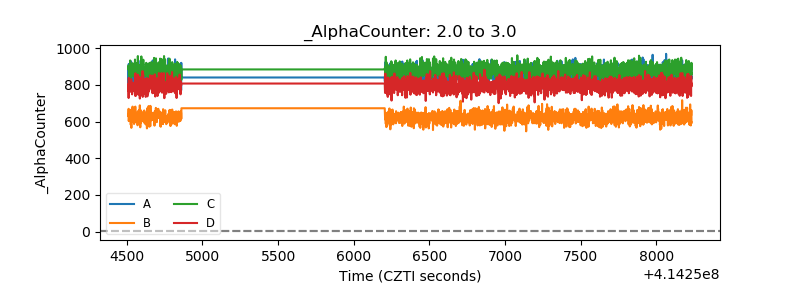 |
| _CPM_Rate | 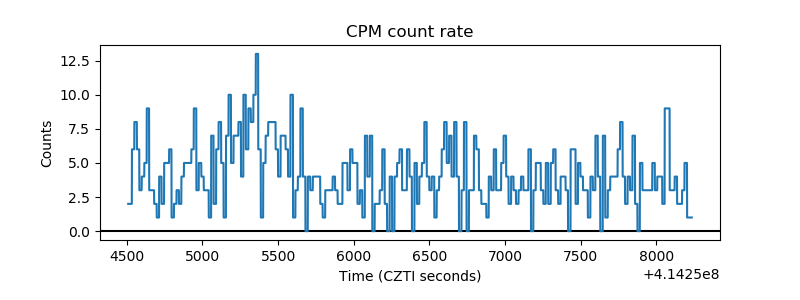 |
| CZT Counter | 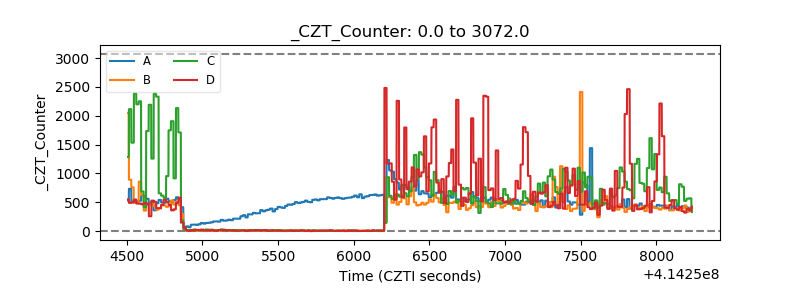 |
| +2.5 Volts monitor | 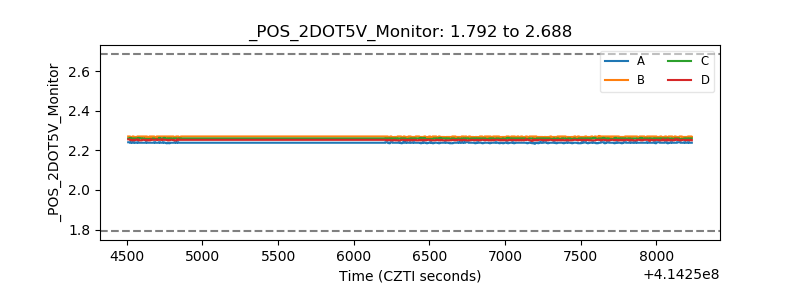 |
| +5 Volts monitor | 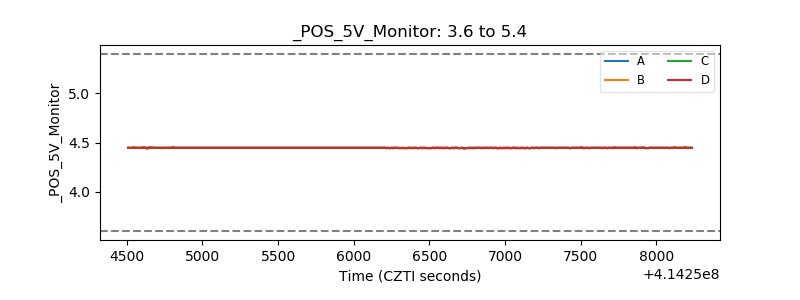 |
| _ROLL_ROT | 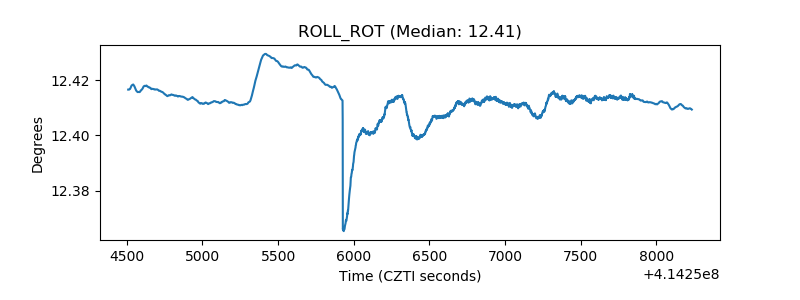 |
| _Roll_DEC | 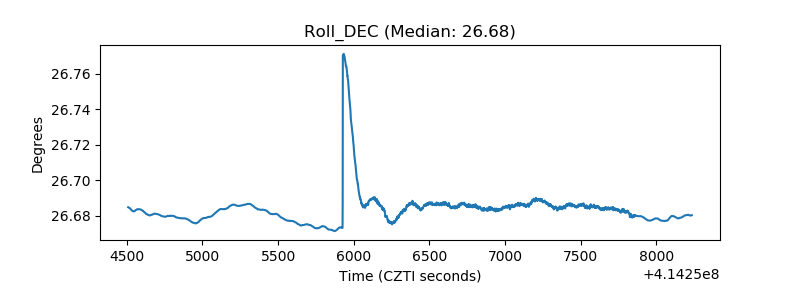 |
| _Roll_RA | 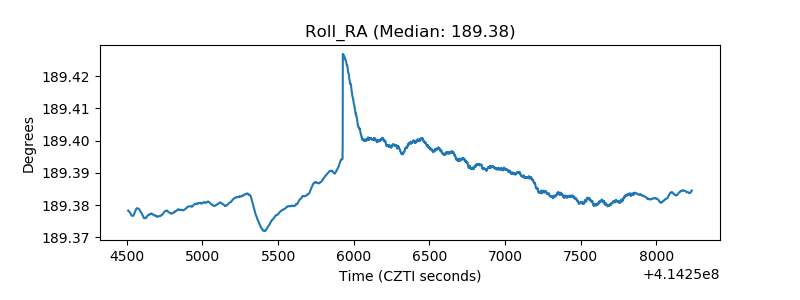 |
| Veto Counter | 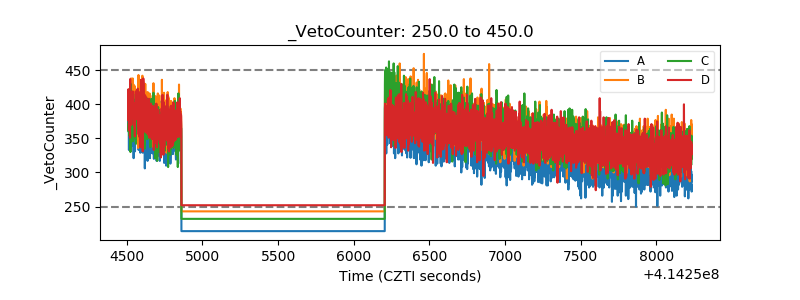 |