| Param | Original file | Final file |
|---|---|---|
| Filename | modeM0/AS1C07_001T01_9000005514_39945cztM0_level2.fits | modeM0/AS1C07_001T01_9000005514_39945cztM0_level2_quad_clean.evt |
| Size (bytes) | 195,255,360 | 54,535,680 |
| Size | 186.2 MB | 52.0 MB |
| Events in quadrant A | 1,711,762 | 368,400 |
| Events in quadrant B | 1,495,000 | 369,304 |
| Events in quadrant C | 1,996,478 | 348,638 |
| Events in quadrant D | 1,767,903 | 332,320 |
| Mode SS | |||
|---|---|---|---|
| Quadrant | BADHDUFLAG | Total packets | Discarded packets |
| A | 0 | 68 | 0 |
| B | 0 | 68 | 0 |
| C | 0 | 68 | 0 |
| D | 0 | 68 | 0 |
| Mode M9 | |||
|---|---|---|---|
| Quadrant | BADHDUFLAG | Total packets | Discarded packets |
| A | 0 | 13 | 0 |
| B | 0 | 13 | 0 |
| C | 0 | 13 | 0 |
| D | 0 | 13 | 0 |
| Mode M0 | |||
|---|---|---|---|
| Quadrant | BADHDUFLAG | Total packets | Discarded packets |
| A | 0 | 7102 | 2 |
| B | 0 | 6753 | 1 |
| C | 0 | 8100 | 1 |
| D | 0 | 7552 | 1 |
| Quadrant | Total seconds | Saturated seconds | Saturation percentage |
|---|---|---|---|
| A | 3274 | 8 | 0.244349% |
| B | 3274 | 6 | 0.183262% |
| C | 3274 | 77 | 2.351863% |
| D | 3274 | 37 | 1.130116% |
Noise dominated data is calculated using 1-second bins in cleaned event files. If a bin has >2000 counts, and if more than 50% of those come from <1% of pixels, then it is considered to be noise-dominated and hence unusable.
| Quadrant | # 1 sec bins | Bins with >0 counts | Bins with >2000 counts | High rate bins dominated by noise | Noise dominated (total time) | Noise dominated (detector-on time) | Marked lightcurve |
|---|---|---|---|---|---|---|---|
| A | 4587 | 3275 | 4 | 4 | 0.09% | 0.12% | 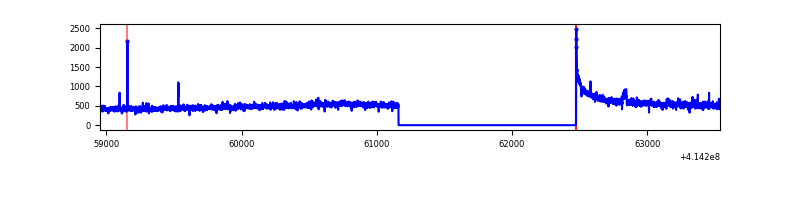 |
| B | 4587 | 3275 | 0 | 0 | 0.00% | 0.00% | 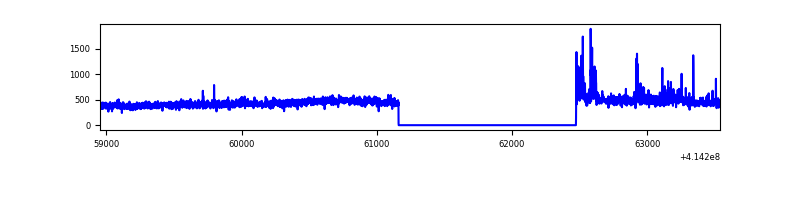 |
| C | 4587 | 3275 | 69 | 69 | 1.50% | 2.11% | 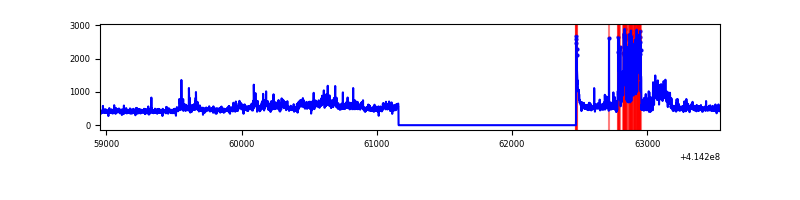 |
| D | 4587 | 3275 | 37 | 37 | 0.81% | 1.13% | 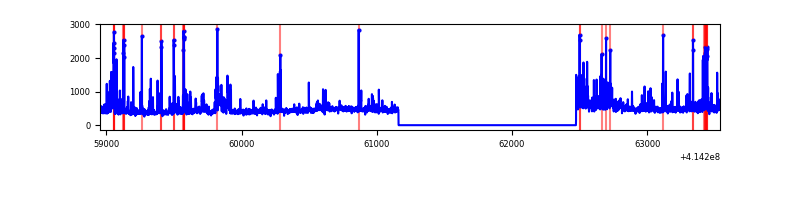 |
Top three noisy pixels from each quadrant. If the there are fewer than three noisy pixels in the level2.evt file, extra rows are filled as -1
| Pixel properties | Quadrant properties | ||||||
|---|---|---|---|---|---|---|---|
| Quadrant | DetID | PixID | Counts | Sigma | Mean | Median | Sigma |
| A | 10 | 83 | 273011 | 3605.66 | 360 | 351 | 75.6 |
| A | 2 | 79 | 24559 | 320.13 | 360 | 351 | 75.6 |
| A | 3 | 1 | 8080 | 102.21 | 360 | 351 | 75.6 |
| B | 0 | 230 | 35914 | 504.75 | 356 | 345 | 70.5 |
| B | 15 | 85 | 19255 | 268.34 | 356 | 345 | 70.5 |
| B | 5 | 255 | 14755 | 204.48 | 356 | 345 | 70.5 |
| C | 9 | 54 | 398080 | 4859.92 | 345 | 348 | 81.8 |
| C | 15 | 214 | 134574 | 1640.12 | 345 | 348 | 81.8 |
| C | 9 | 187 | 78237 | 951.73 | 345 | 348 | 81.8 |
| D | 2 | 250 | 181758 | 2101.48 | 348 | 338 | 86.3 |
| D | 2 | 249 | 96797 | 1117.33 | 348 | 338 | 86.3 |
| D | 12 | 227 | 47377 | 544.88 | 348 | 338 | 86.3 |
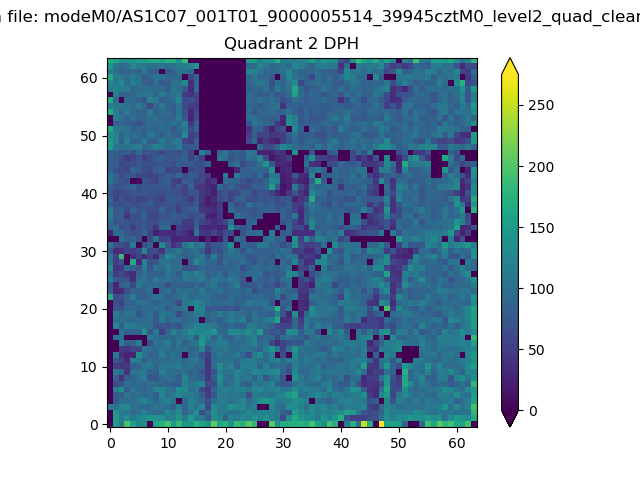
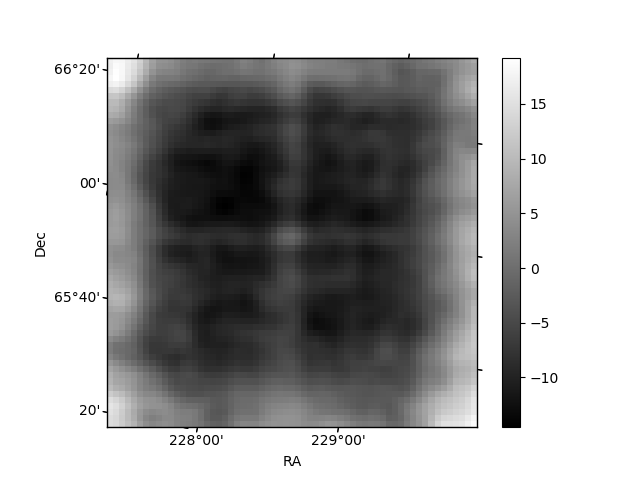
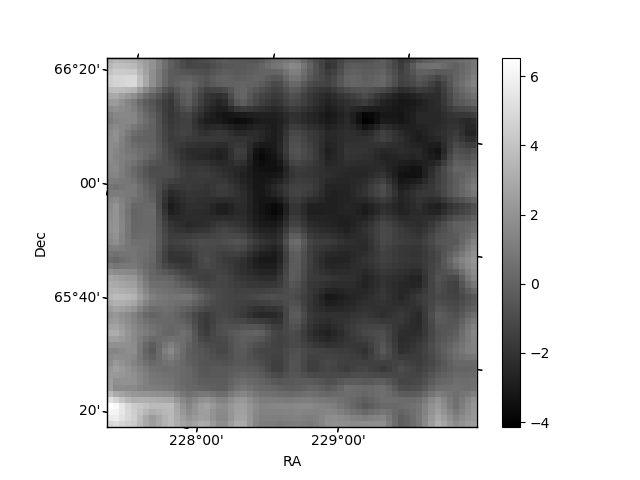
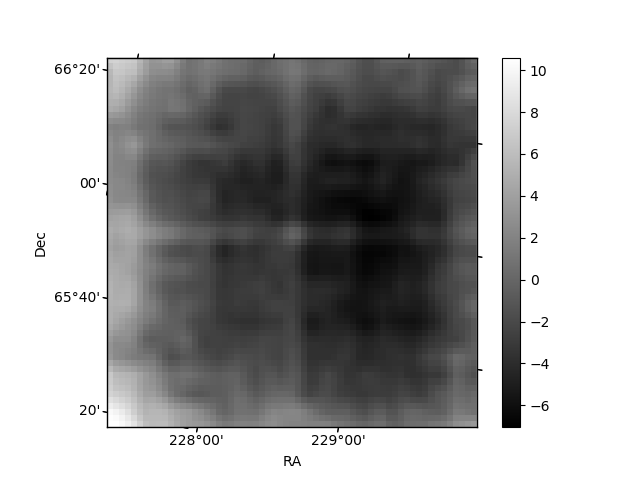
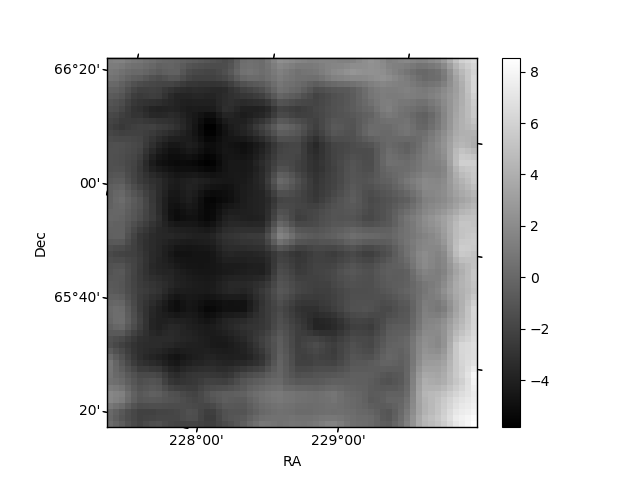
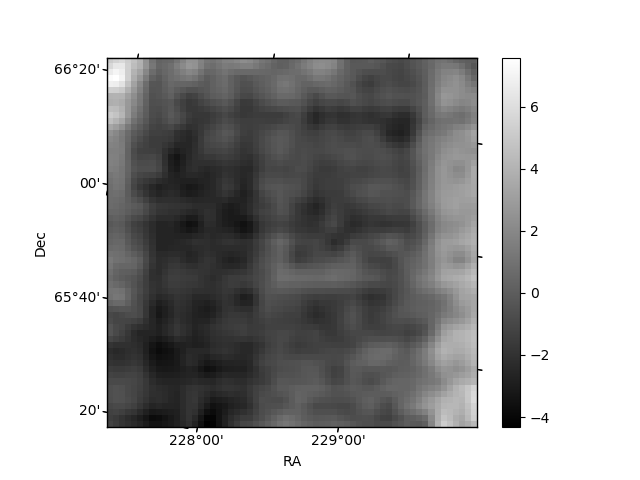
Histogram calculated using DETX and DETY for each event in the final _common_clean file
| Quadrant A | 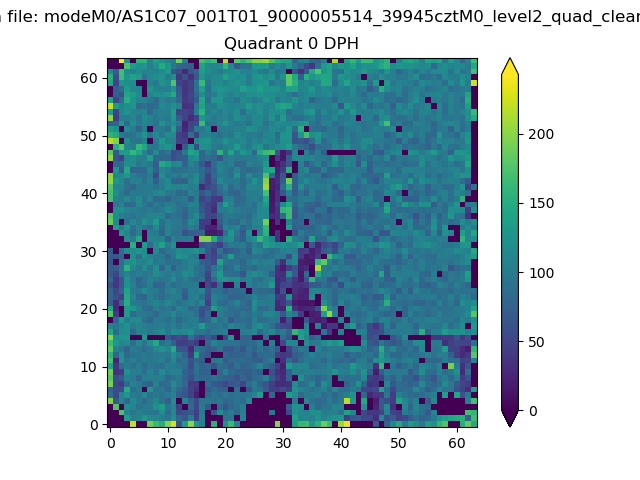 |
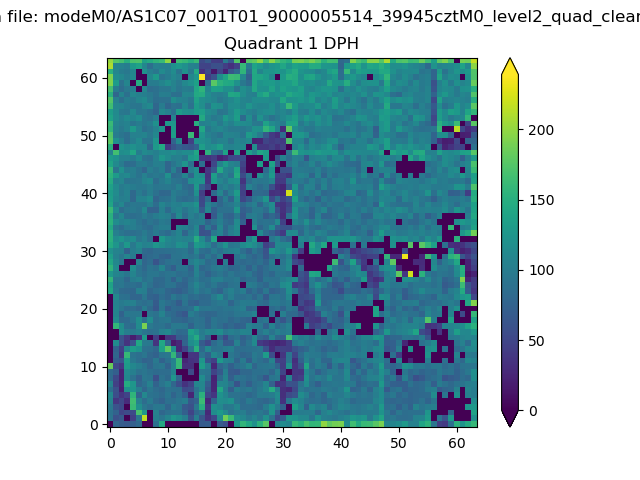 |
Quadrant B |
|---|---|---|---|
| Quadrant D | 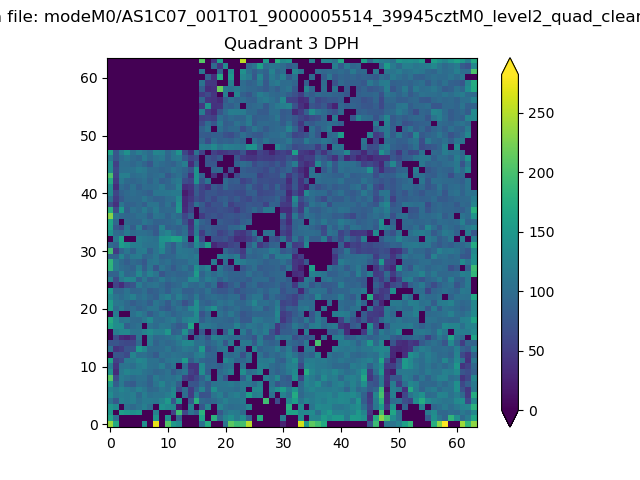 |
 |
Quadrant C |
| Plot type | Count rate plots | Images |
|---|---|---|
| Comparison with Poisson distribution Blue bars denote a histogram of data divided into 1 sec bins. Red curve is a Poisson curve with rate = median count rate of data. |
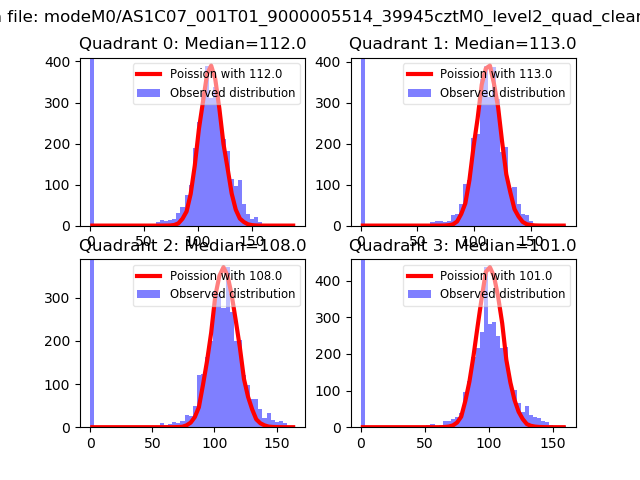 |
 |
| Quadrant-wise count rates Data is divided into 100 sec bins |
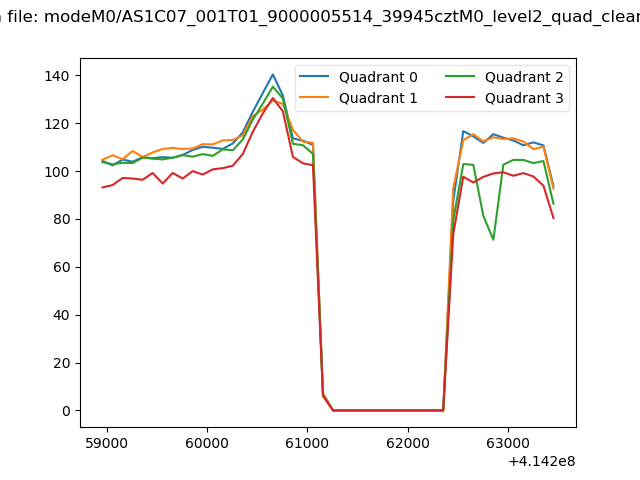 |
|
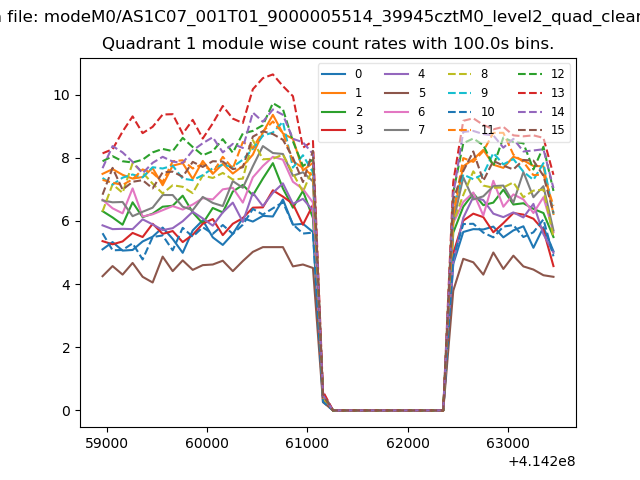
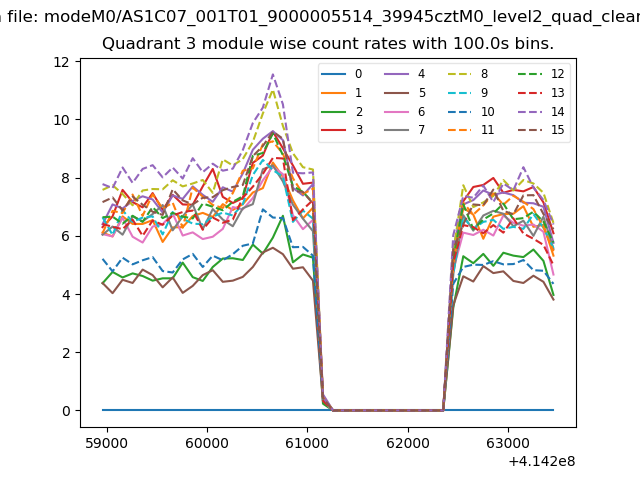
| Module-wise count rates for Quadrant A Data is divided into 100 sec bins |
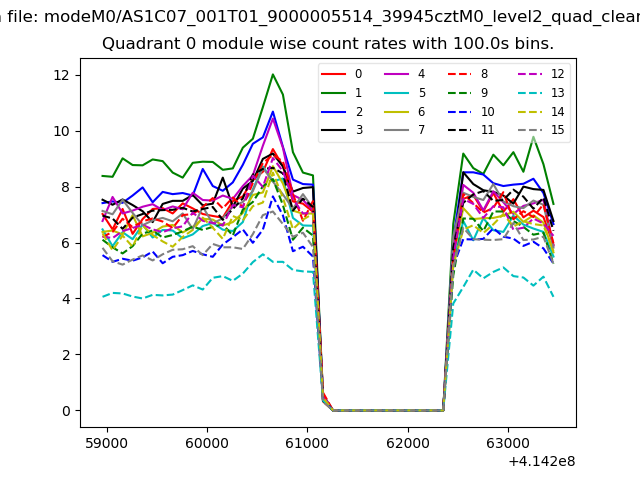 |
 |
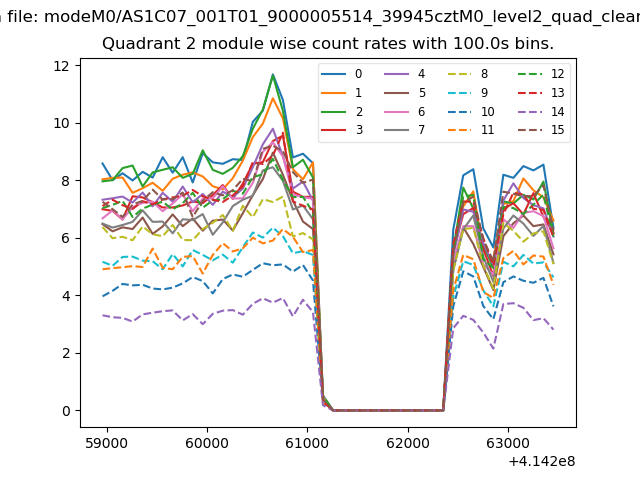
| Module-wise count rates for Quadrant B Data is divided into 100 sec bins |
 |
 |
| Module-wise count rates for Quadrant C Data is divided into 100 sec bins |
 |
 |
| Module-wise count rates for Quadrant D Data is divided into 100 sec bins |
 |
 |
| Parameter | Plot |
|---|---|
| CZT HV Monitor | 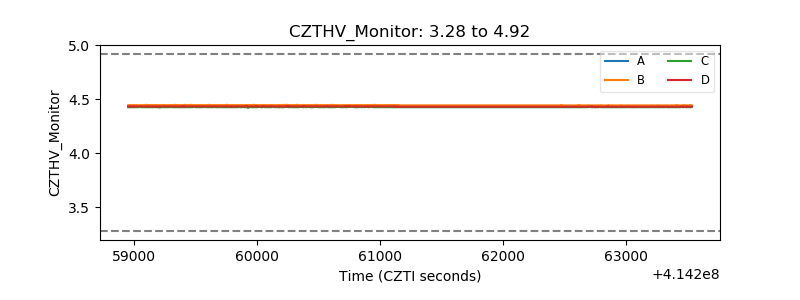 |
| D_VDD | 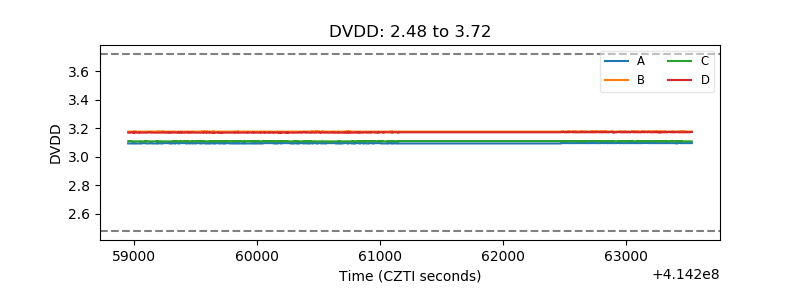 |
| Temperature 1 | 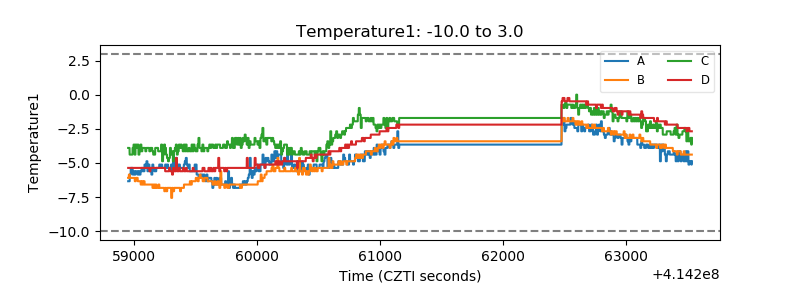 |
| Veto HV Monitor | 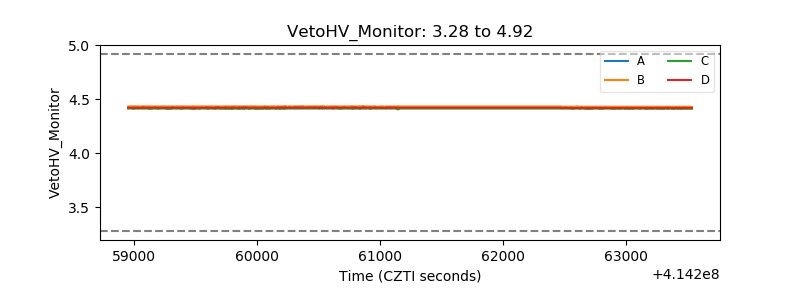 |
| Veto LLD | 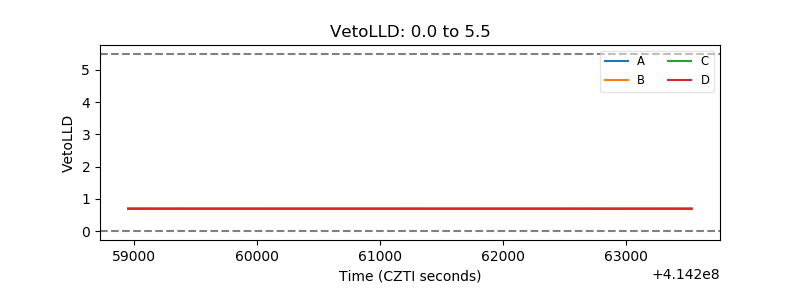 |
| Alpha Counter | 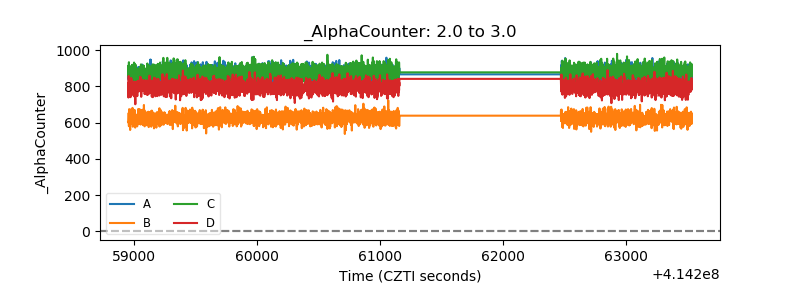 |
| _CPM_Rate | 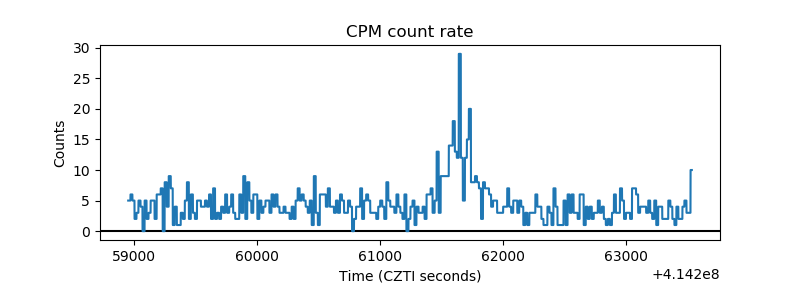 |
| CZT Counter | 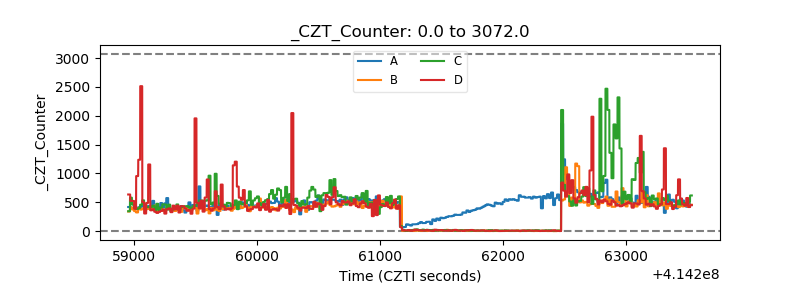 |
| +2.5 Volts monitor |  |
| +5 Volts monitor | 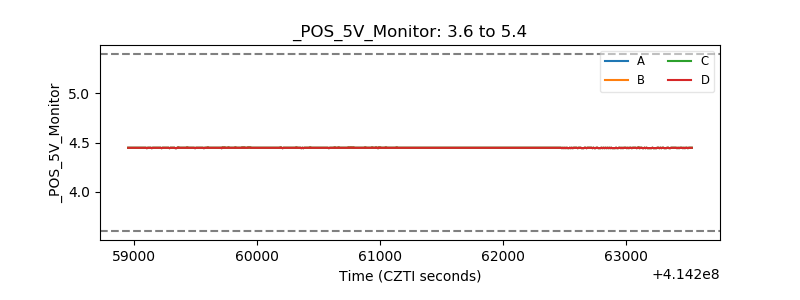 |
| _ROLL_ROT | 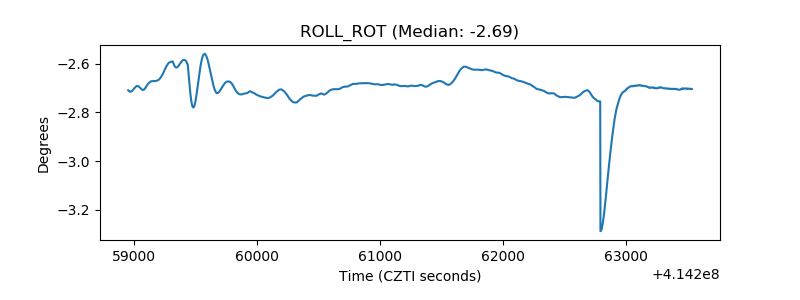 |
| _Roll_DEC | 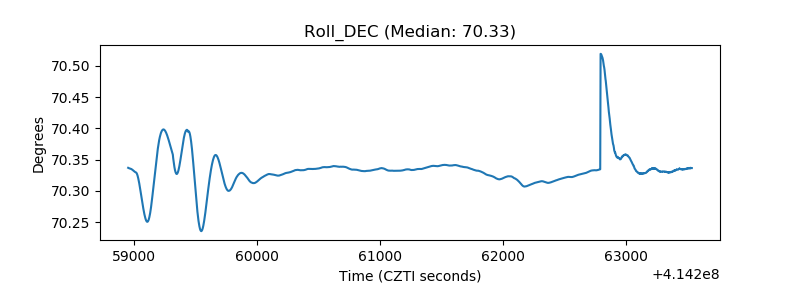 |
| _Roll_RA | 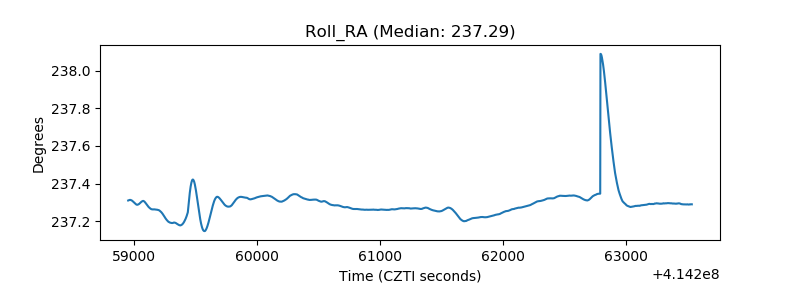 |
| Veto Counter | 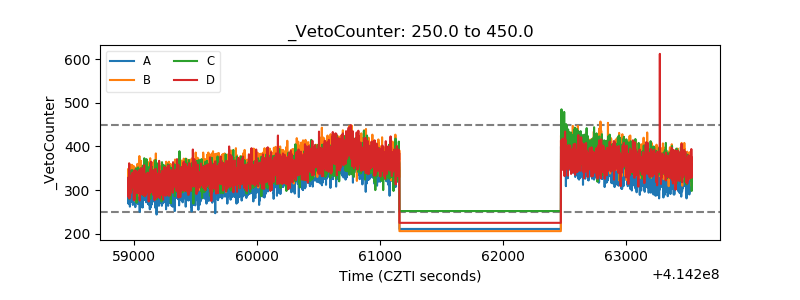 |