| Param | Original file | Final file |
|---|---|---|
| Filename | modeM0/AS1C07_001T01_9000005514_39947cztM0_level2.fits | modeM0/AS1C07_001T01_9000005514_39947cztM0_level2_quad_clean.evt |
| Size (bytes) | 716,999,040 | 169,948,800 |
| Size | 683.8 MB | 162.1 MB |
| Events in quadrant A | 5,665,542 | 1,161,375 |
| Events in quadrant B | 5,396,635 | 1,164,716 |
| Events in quadrant C | 8,132,830 | 1,048,223 |
| Events in quadrant D | 6,511,268 | 1,026,261 |
| Mode SS | |||
|---|---|---|---|
| Quadrant | BADHDUFLAG | Total packets | Discarded packets |
| A | 0 | 218 | 0 |
| B | 0 | 218 | 0 |
| C | 0 | 218 | 0 |
| D | 0 | 218 | 0 |
| Mode M9 | |||
|---|---|---|---|
| Quadrant | BADHDUFLAG | Total packets | Discarded packets |
| A | 0 | 29 | 0 |
| B | 0 | 29 | 0 |
| C | 0 | 29 | 0 |
| D | 0 | 30 | 0 |
| Mode M0 | |||
|---|---|---|---|
| Quadrant | BADHDUFLAG | Total packets | Discarded packets |
| A | 0 | 23856 | 3 |
| B | 0 | 23869 | 2 |
| C | 0 | 30973 | 2 |
| D | 0 | 27157 | 2 |
| Quadrant | Total seconds | Saturated seconds | Saturation percentage |
|---|---|---|---|
| A | 10763 | 63 | 0.585339% |
| B | 10763 | 164 | 1.523739% |
| C | 10763 | 866 | 8.046084% |
| D | 10763 | 320 | 2.973149% |
Noise dominated data is calculated using 1-second bins in cleaned event files. If a bin has >2000 counts, and if more than 50% of those come from <1% of pixels, then it is considered to be noise-dominated and hence unusable.
| Quadrant | # 1 sec bins | Bins with >0 counts | Bins with >2000 counts | High rate bins dominated by noise | Noise dominated (total time) | Noise dominated (detector-on time) | Marked lightcurve |
|---|---|---|---|---|---|---|---|
| A | 13600 | 10765 | 47 | 47 | 0.35% | 0.44% | 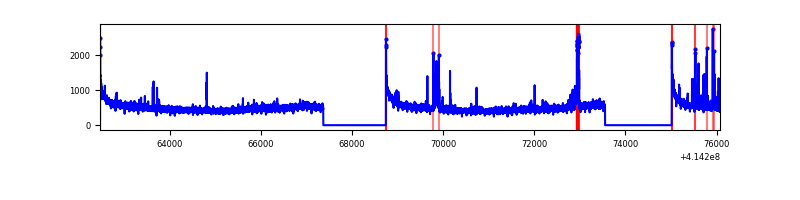 |
| B | 13600 | 10765 | 118 | 118 | 0.87% | 1.10% | 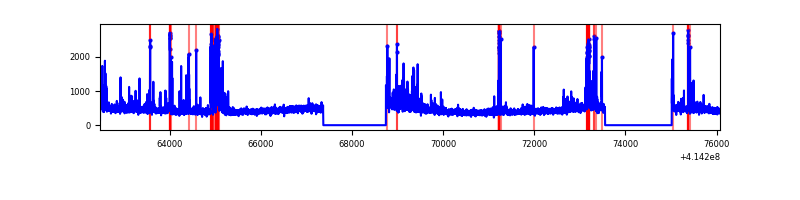 |
| C | 13600 | 10765 | 859 | 859 | 6.32% | 7.98% | 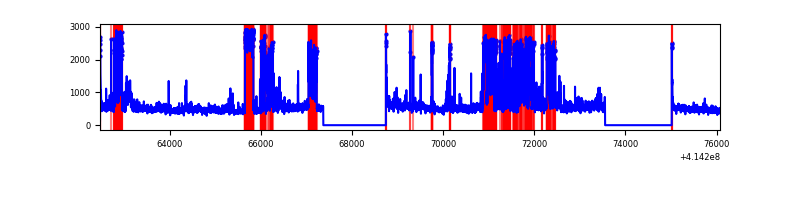 |
| D | 13599 | 10764 | 313 | 313 | 2.30% | 2.91% | 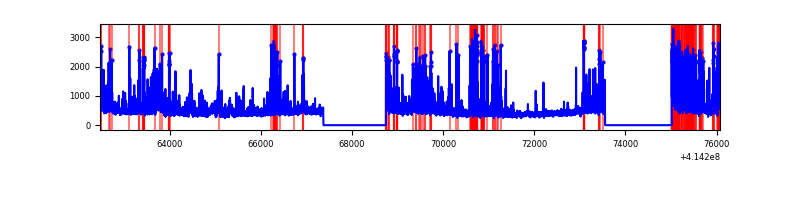 |
Top three noisy pixels from each quadrant. If the there are fewer than three noisy pixels in the level2.evt file, extra rows are filled as -1
| Pixel properties | Quadrant properties | ||||||
|---|---|---|---|---|---|---|---|
| Quadrant | DetID | PixID | Counts | Sigma | Mean | Median | Sigma |
| A | 10 | 83 | 844268 | 3602.82 | 1147 | 1124 | 234.0 |
| A | 15 | 223 | 173068 | 734.73 | 1147 | 1124 | 234.0 |
| A | 13 | 248 | 49616 | 207.21 | 1147 | 1124 | 234.0 |
| B | 5 | 255 | 340830 | 1540.19 | 1134 | 1101 | 220.6 |
| B | 4 | 171 | 262671 | 1185.85 | 1134 | 1101 | 220.6 |
| B | 0 | 230 | 99499 | 446.1 | 1134 | 1101 | 220.6 |
| C | 9 | 54 | 3206195 | 12657.88 | 1089 | 1094 | 253.2 |
| C | 15 | 214 | 432118 | 1702.24 | 1089 | 1094 | 253.2 |
| C | 9 | 187 | 98300 | 383.89 | 1089 | 1094 | 253.2 |
| D | 2 | 249 | 676669 | 2503.87 | 1109 | 1076 | 269.8 |
| D | 2 | 250 | 662573 | 2451.63 | 1109 | 1076 | 269.8 |
| D | 12 | 227 | 476092 | 1760.5 | 1109 | 1076 | 269.8 |
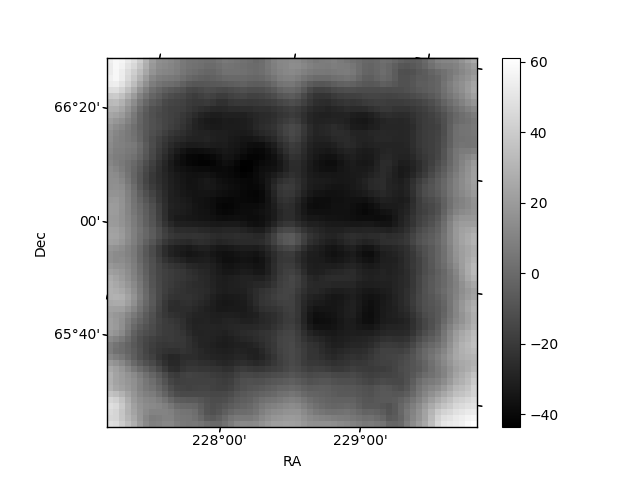
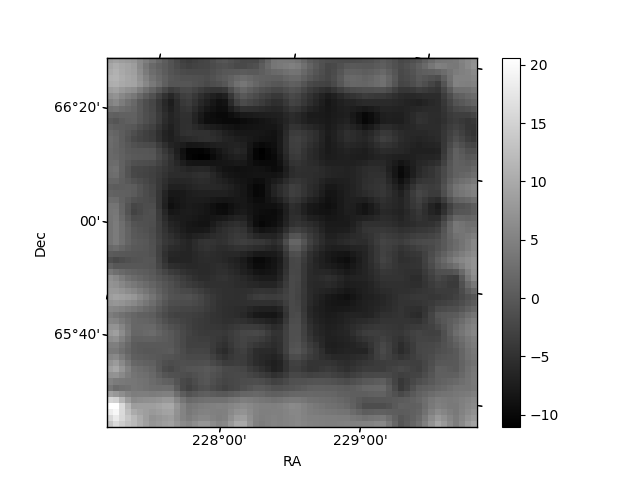
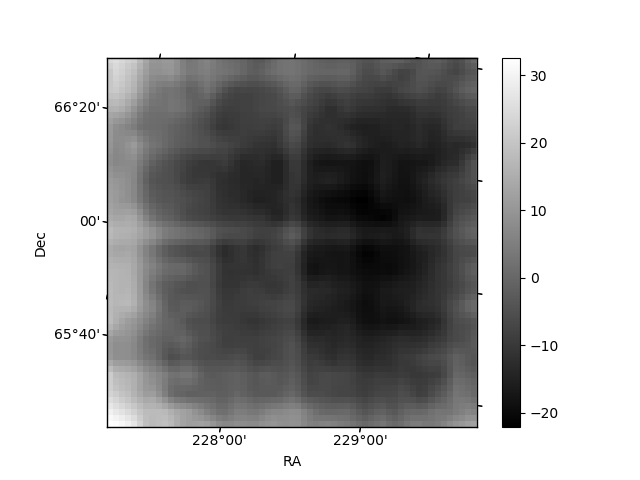
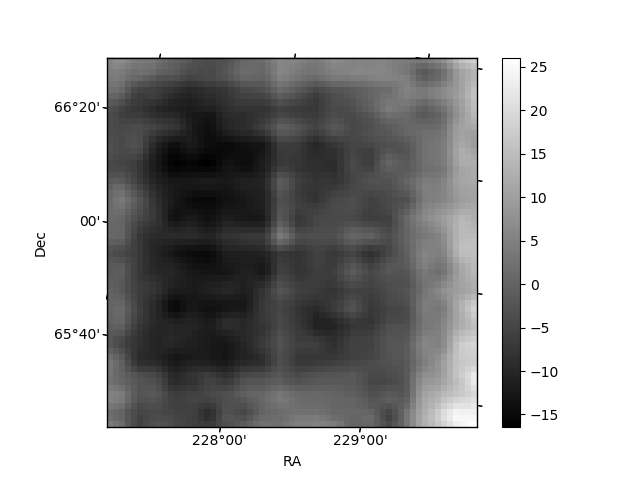
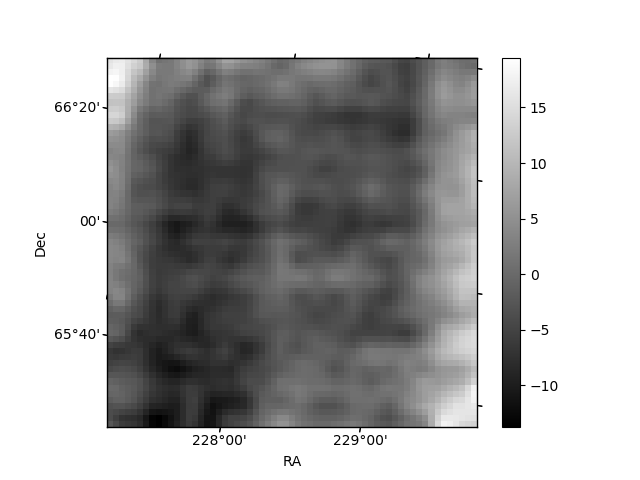
Histogram calculated using DETX and DETY for each event in the final _common_clean file
| Quadrant A | 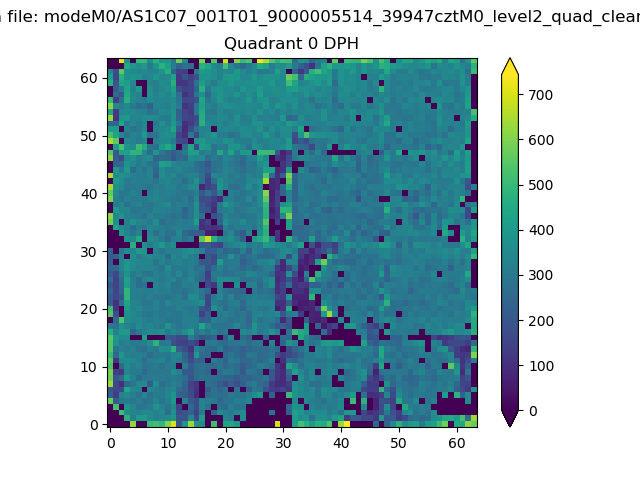 |
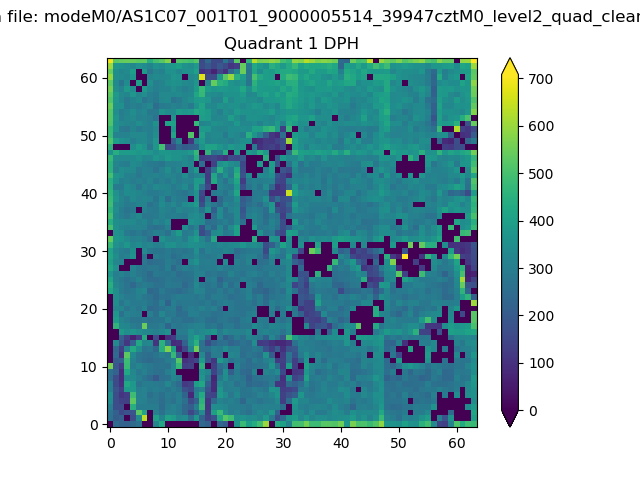 |
Quadrant B |
|---|---|---|---|
| Quadrant D | 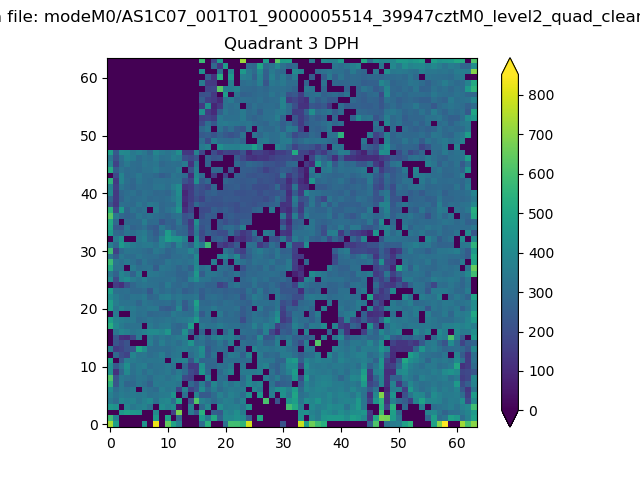 |
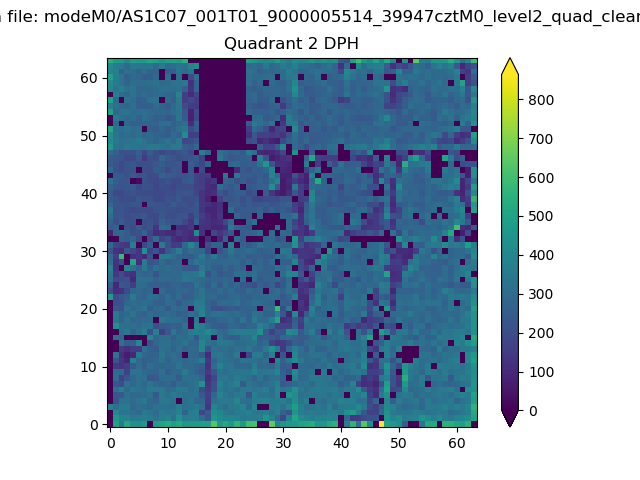 |
Quadrant C |
| Plot type | Count rate plots | Images |
|---|---|---|
| Comparison with Poisson distribution Blue bars denote a histogram of data divided into 1 sec bins. Red curve is a Poisson curve with rate = median count rate of data. |
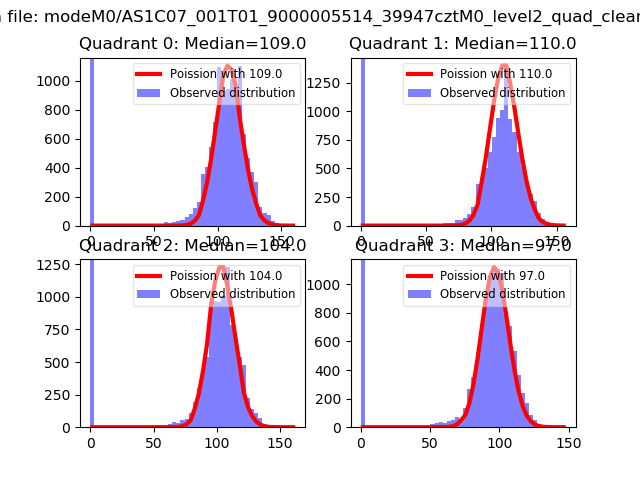 |
 |
| Quadrant-wise count rates Data is divided into 100 sec bins |
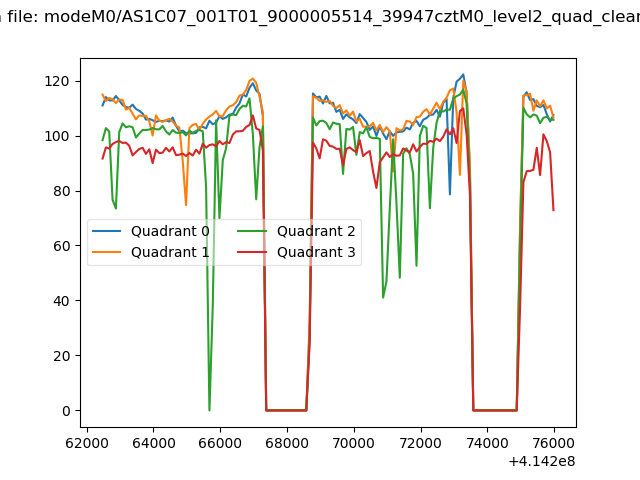 |
|
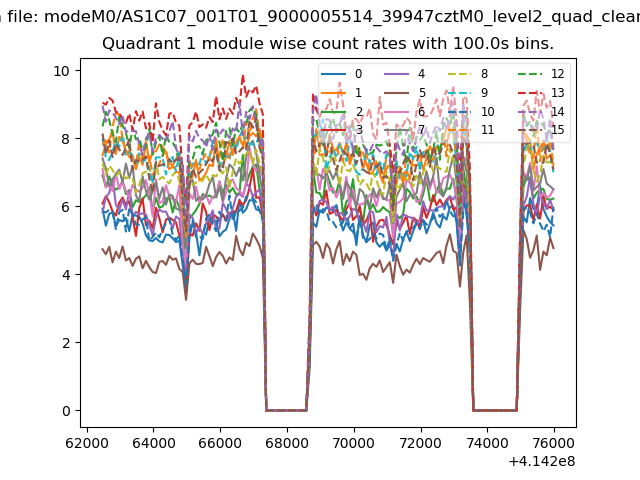
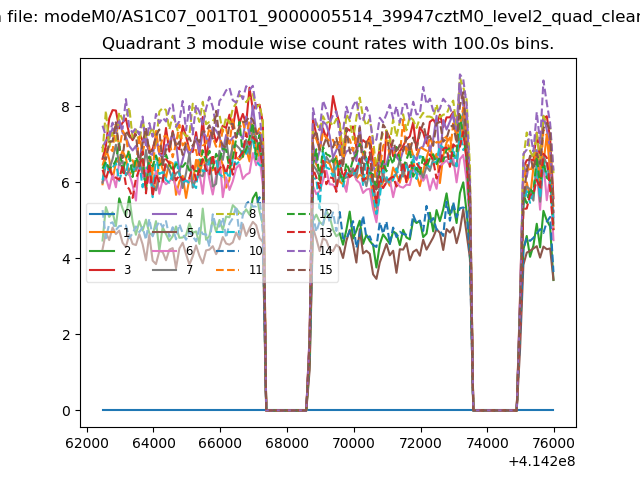
| Module-wise count rates for Quadrant A Data is divided into 100 sec bins |
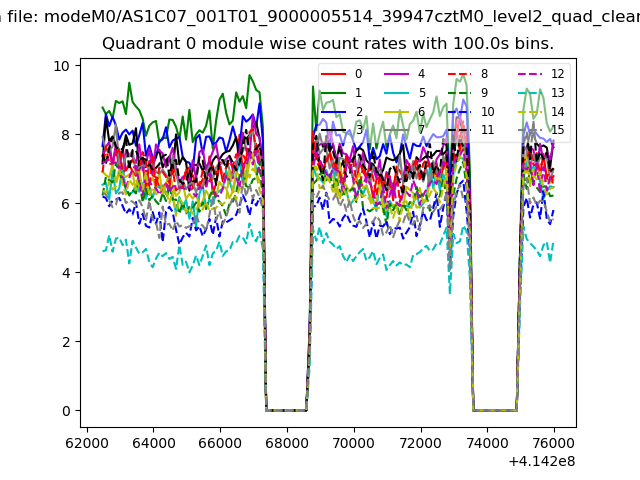 |
 |
| Module-wise count rates for Quadrant B Data is divided into 100 sec bins |
 |
 |
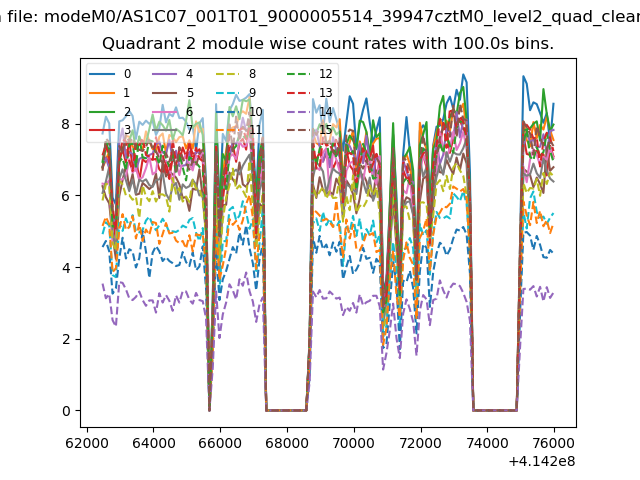
| Module-wise count rates for Quadrant C Data is divided into 100 sec bins |
 |
 |
| Module-wise count rates for Quadrant D Data is divided into 100 sec bins |
 |
 |
| Parameter | Plot |
|---|---|
| CZT HV Monitor |  |
| D_VDD | 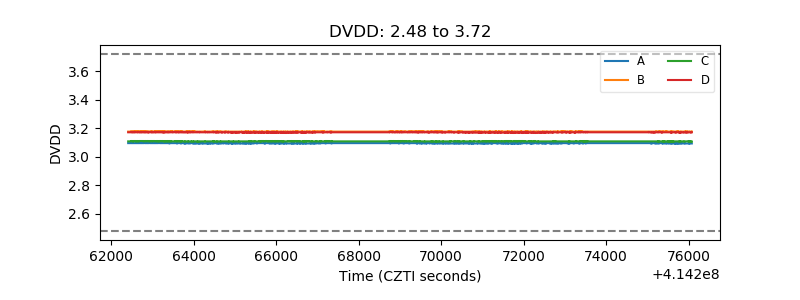 |
| Temperature 1 | 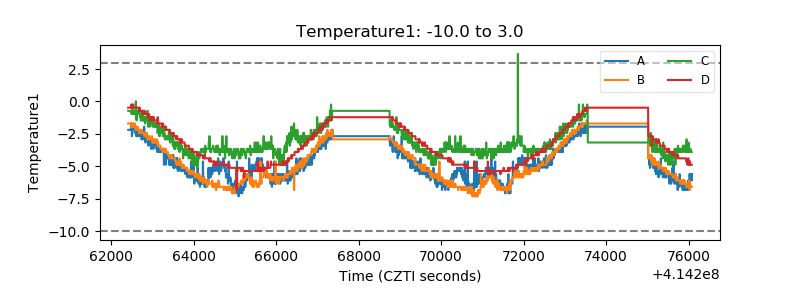 |
| Veto HV Monitor | 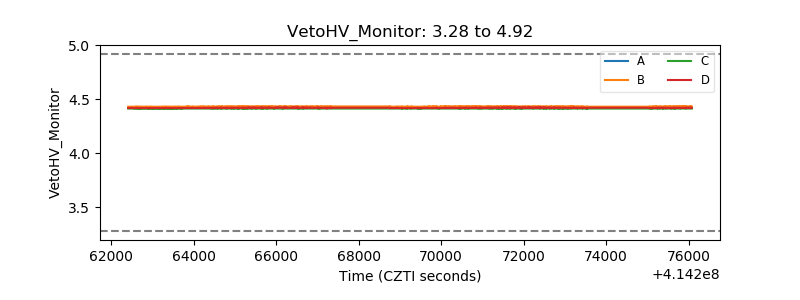 |
| Veto LLD | 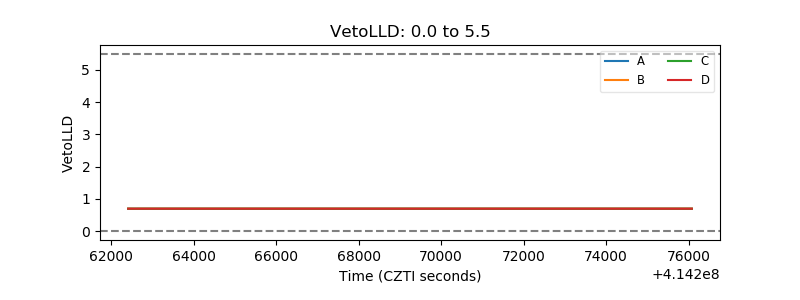 |
| Alpha Counter | 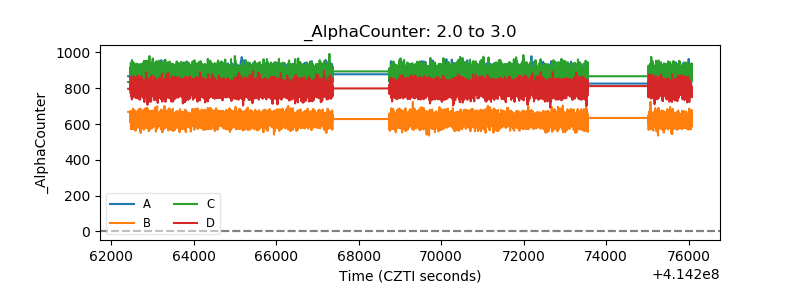 |
| _CPM_Rate | 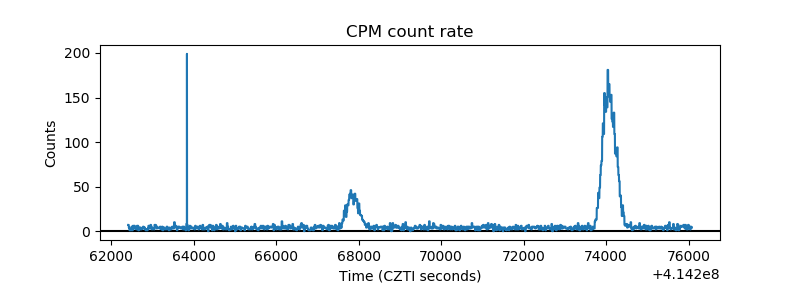 |
| CZT Counter | 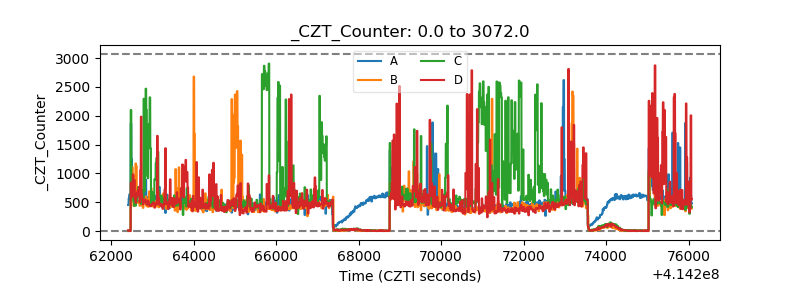 |
| +2.5 Volts monitor | 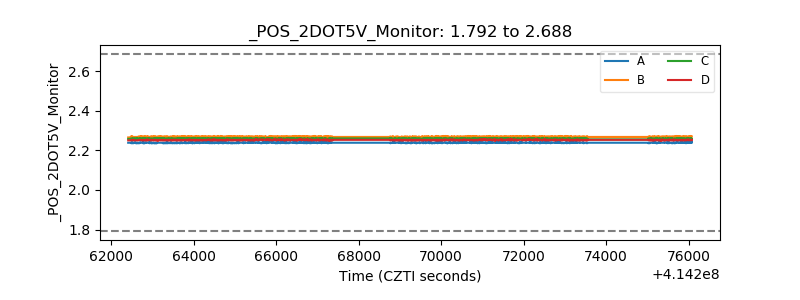 |
| +5 Volts monitor | 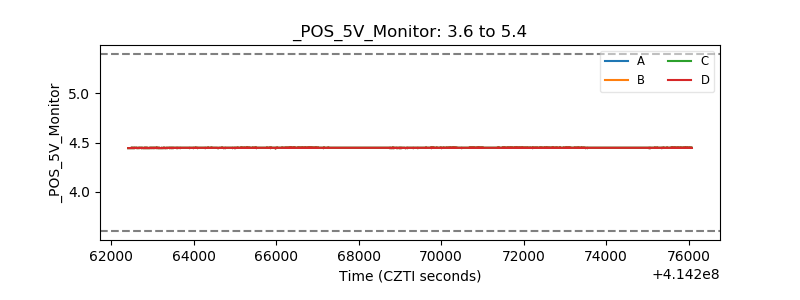 |
| _ROLL_ROT | 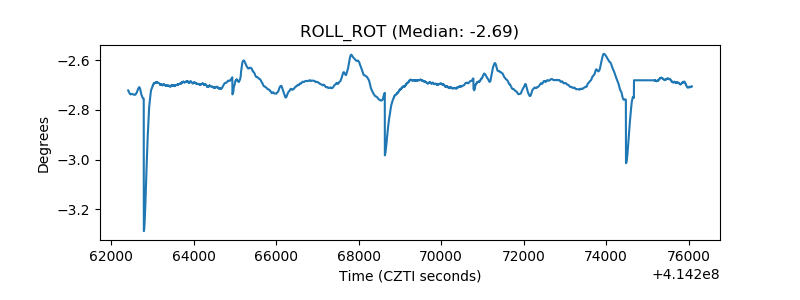 |
| _Roll_DEC | 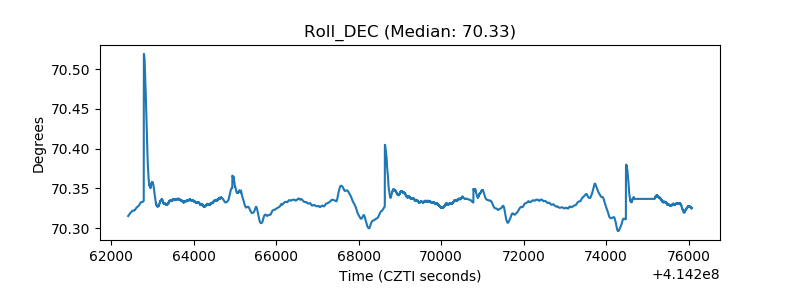 |
| _Roll_RA | 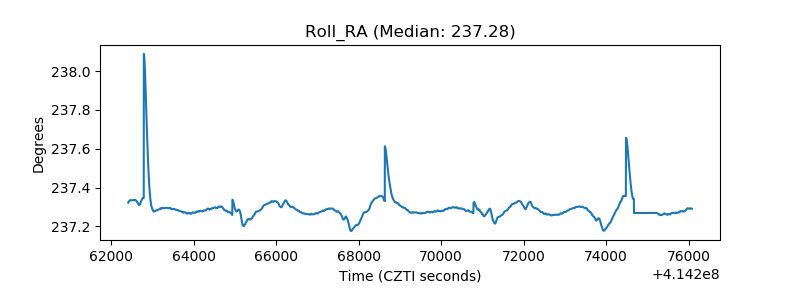 |
| Veto Counter | 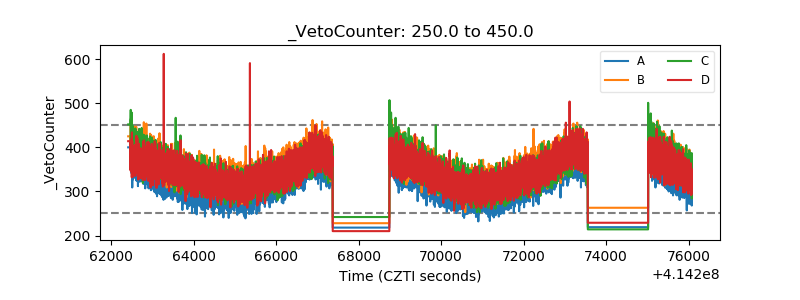 |