| Param | Original file | Final file |
|---|---|---|
| Filename | modeM0/AS1C07_001T01_9000005514_39948cztM0_level2.fits | modeM0/AS1C07_001T01_9000005514_39948cztM0_level2_quad_clean.evt |
| Size (bytes) | 377,717,760 | 90,267,840 |
| Size | 360.2 MB | 86.1 MB |
| Events in quadrant A | 2,968,625 | 620,254 |
| Events in quadrant B | 2,777,554 | 625,911 |
| Events in quadrant C | 2,626,224 | 606,861 |
| Events in quadrant D | 5,167,437 | 483,503 |
| Mode SS | |||
|---|---|---|---|
| Quadrant | BADHDUFLAG | Total packets | Discarded packets |
| A | 0 | 114 | 0 |
| B | 0 | 114 | 0 |
| C | 0 | 114 | 0 |
| D | 0 | 114 | 0 |
| Mode M9 | |||
|---|---|---|---|
| Quadrant | BADHDUFLAG | Total packets | Discarded packets |
| A | 0 | 24 | 0 |
| B | 0 | 24 | 0 |
| C | 0 | 24 | 0 |
| D | 0 | 25 | 0 |
| Mode M0 | |||
|---|---|---|---|
| Quadrant | BADHDUFLAG | Total packets | Discarded packets |
| A | 0 | 12596 | 2 |
| B | 0 | 12474 | 1 |
| C | 0 | 11622 | 1 |
| D | 0 | 19585 | 1 |
| Quadrant | Total seconds | Saturated seconds | Saturation percentage |
|---|---|---|---|
| A | 5675 | 22 | 0.387665% |
| B | 5675 | 55 | 0.969163% |
| C | 5675 | 11 | 0.193833% |
| D | 5675 | 889 | 15.665198% |
Noise dominated data is calculated using 1-second bins in cleaned event files. If a bin has >2000 counts, and if more than 50% of those come from <1% of pixels, then it is considered to be noise-dominated and hence unusable.
| Quadrant | # 1 sec bins | Bins with >0 counts | Bins with >2000 counts | High rate bins dominated by noise | Noise dominated (total time) | Noise dominated (detector-on time) | Marked lightcurve |
|---|---|---|---|---|---|---|---|
| A | 7227 | 5676 | 11 | 11 | 0.15% | 0.19% | 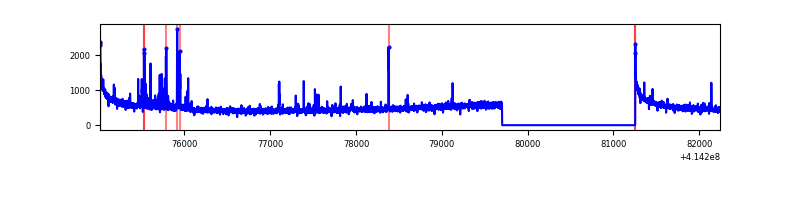 |
| B | 7227 | 5676 | 35 | 35 | 0.48% | 0.62% | 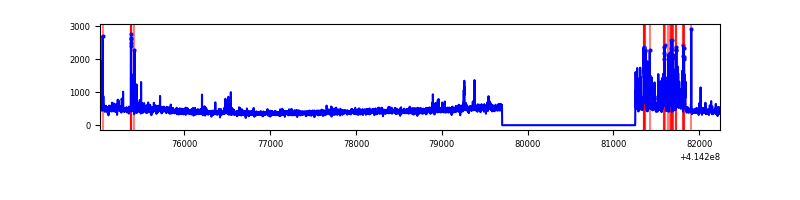 |
| C | 7227 | 5676 | 7 | 7 | 0.10% | 0.12% | 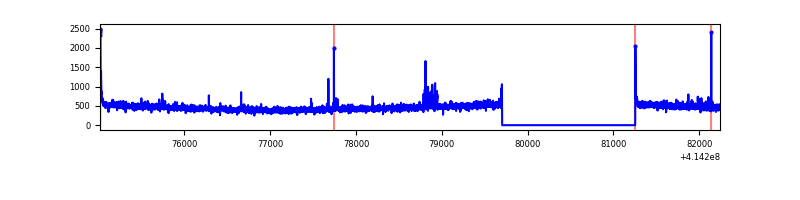 |
| D | 7227 | 5676 | 862 | 862 | 11.93% | 15.19% | 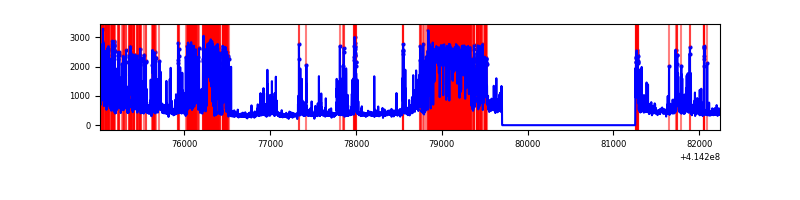 |
Top three noisy pixels from each quadrant. If the there are fewer than three noisy pixels in the level2.evt file, extra rows are filled as -1
| Pixel properties | Quadrant properties | ||||||
|---|---|---|---|---|---|---|---|
| Quadrant | DetID | PixID | Counts | Sigma | Mean | Median | Sigma |
| A | 10 | 83 | 471416 | 3849.11 | 602 | 590 | 122.3 |
| A | 13 | 248 | 45602 | 367.98 | 602 | 590 | 122.3 |
| A | 15 | 222 | 42516 | 342.75 | 602 | 590 | 122.3 |
| B | 5 | 255 | 283759 | 2452.58 | 597 | 578 | 115.5 |
| B | 4 | 171 | 57297 | 491.23 | 597 | 578 | 115.5 |
| B | 0 | 230 | 37490 | 319.69 | 597 | 578 | 115.5 |
| C | 15 | 214 | 237498 | 1721.63 | 589 | 592 | 137.6 |
| C | 9 | 54 | 40935 | 293.18 | 589 | 592 | 137.6 |
| C | 0 | 10 | 28990 | 206.37 | 589 | 592 | 137.6 |
| D | 2 | 249 | 2009495 | 14918.71 | 545 | 527 | 134.7 |
| D | 1 | 47 | 382680 | 2837.89 | 545 | 527 | 134.7 |
| D | 2 | 250 | 375223 | 2782.51 | 545 | 527 | 134.7 |
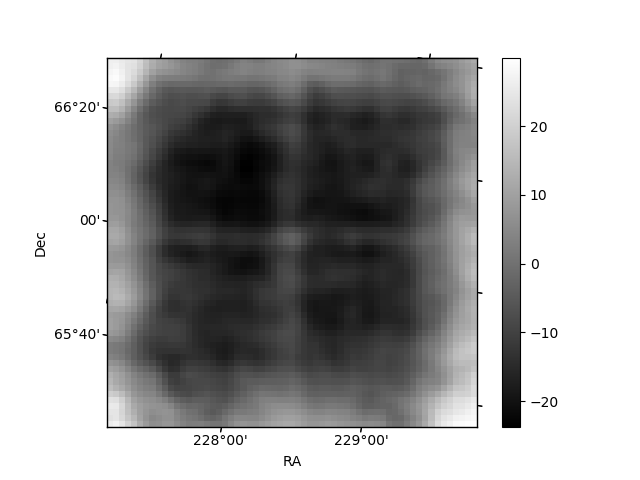
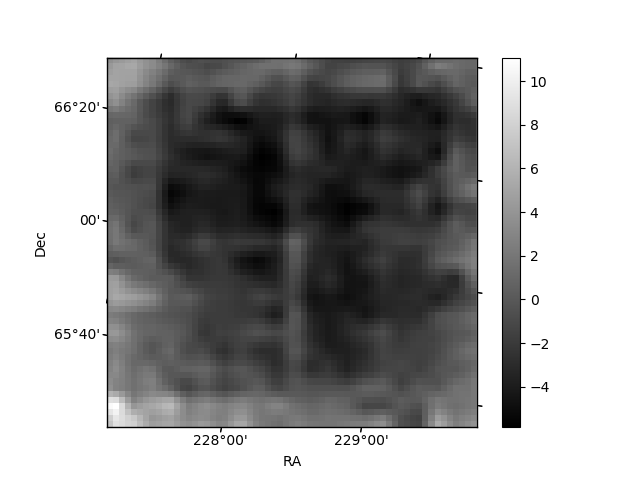
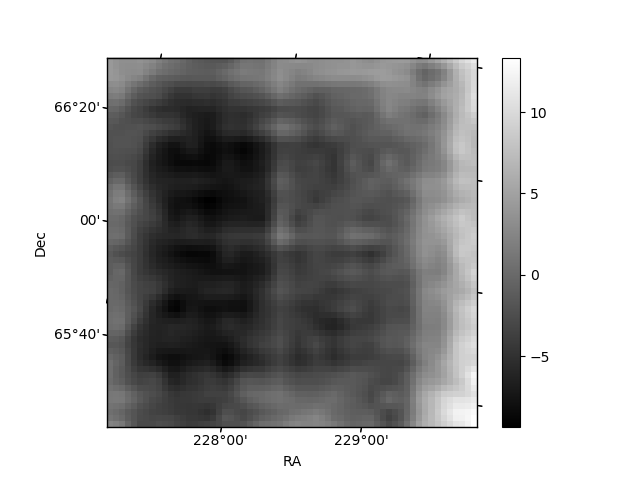
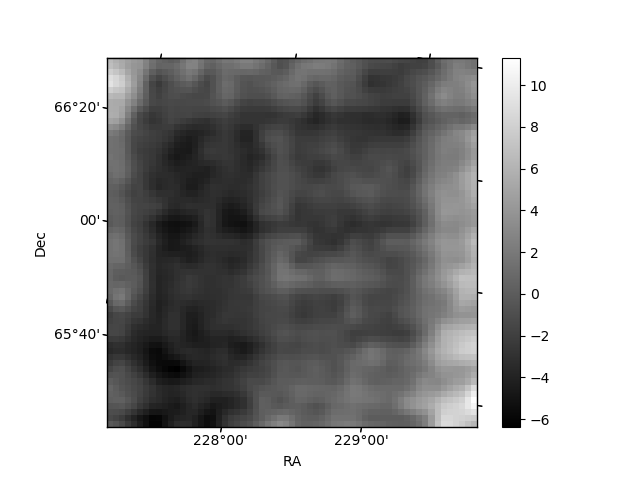
Histogram calculated using DETX and DETY for each event in the final _common_clean file
| Quadrant A | 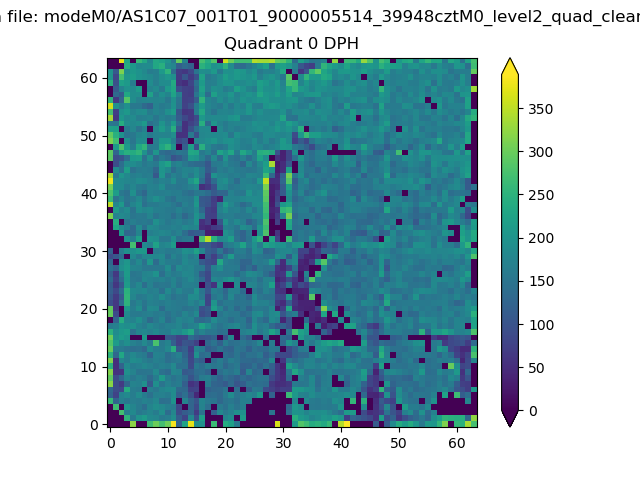 |
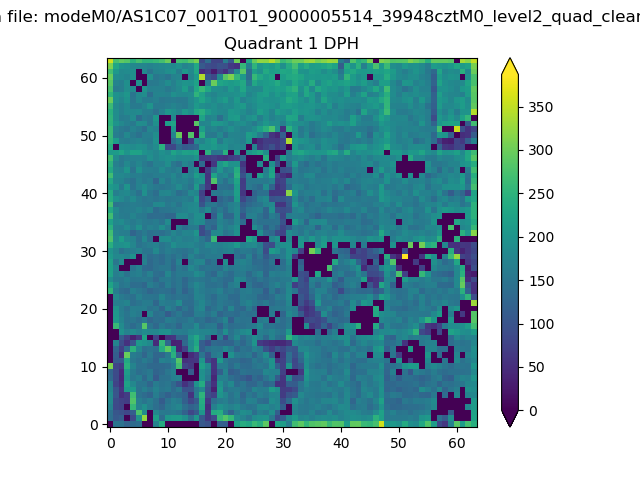 |
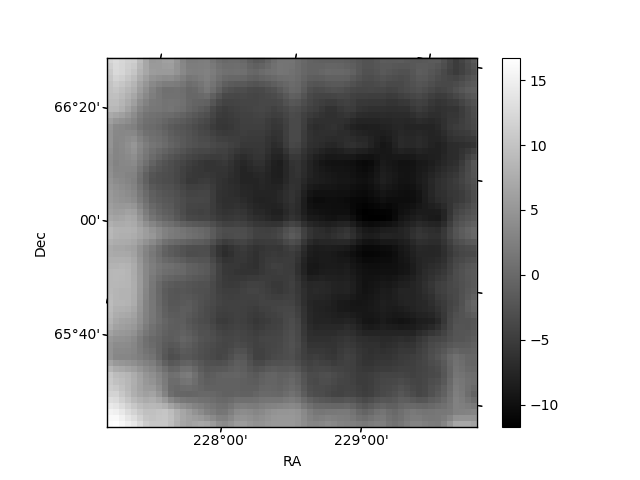
Quadrant B |
|---|---|---|---|
| Quadrant D | 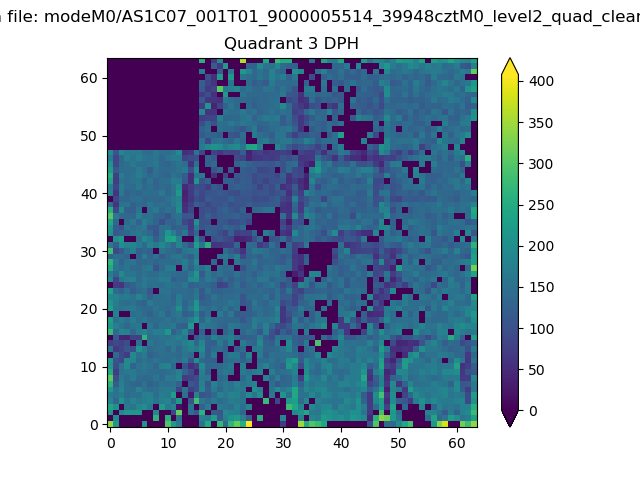 |
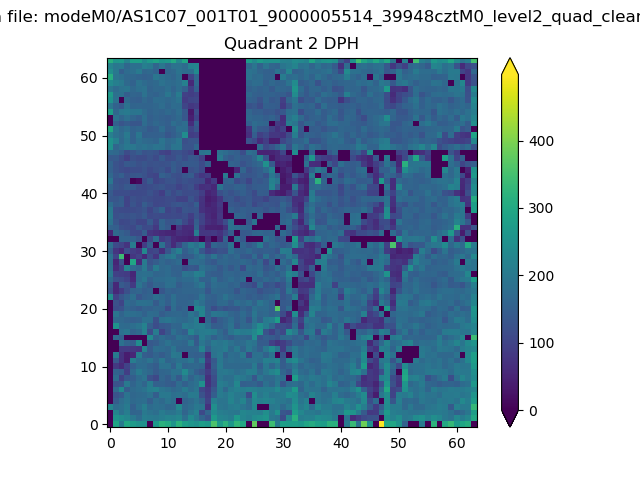 |
Quadrant C |
| Plot type | Count rate plots | Images |
|---|---|---|
| Comparison with Poisson distribution Blue bars denote a histogram of data divided into 1 sec bins. Red curve is a Poisson curve with rate = median count rate of data. |
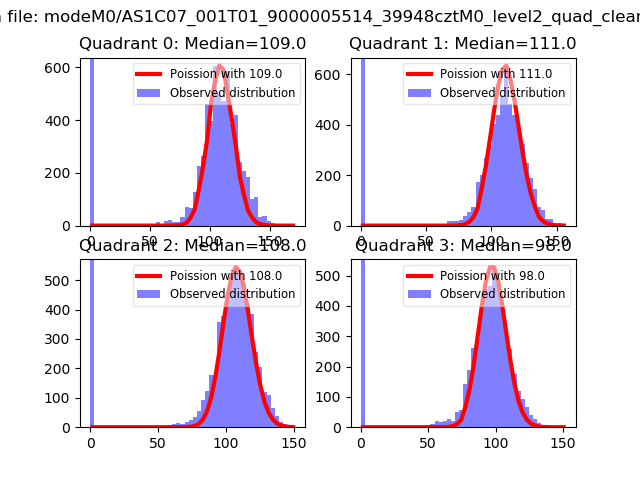 |
 |
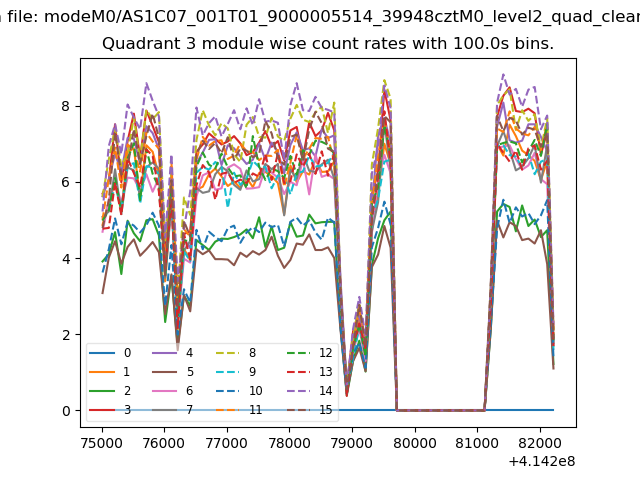
| Quadrant-wise count rates Data is divided into 100 sec bins |
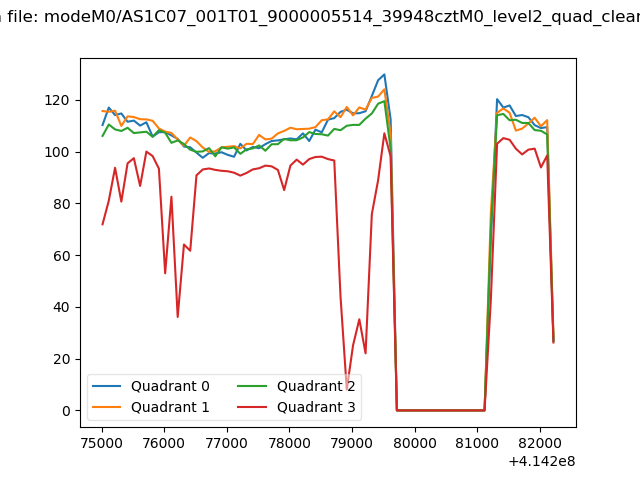 |
|
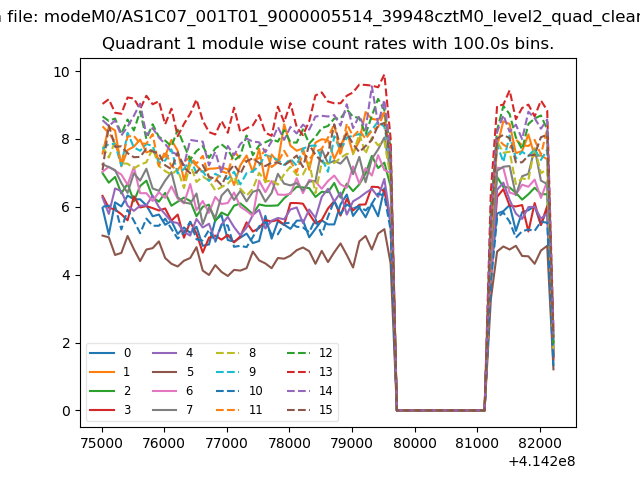
| Module-wise count rates for Quadrant A Data is divided into 100 sec bins |
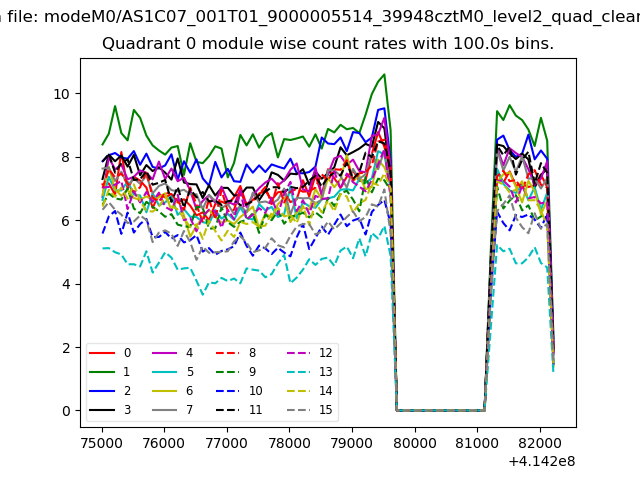 |
 |
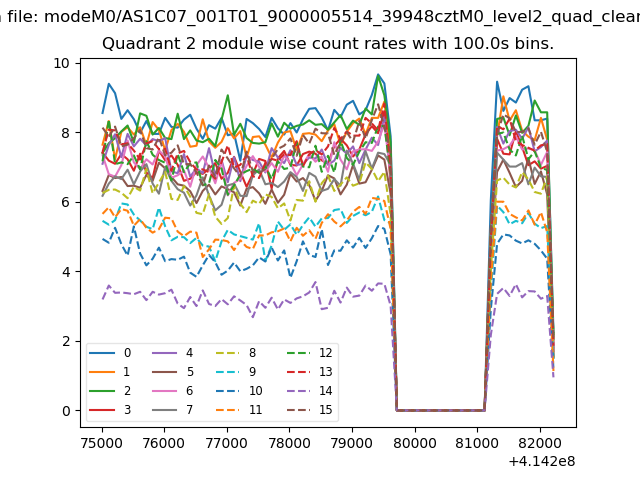
| Module-wise count rates for Quadrant B Data is divided into 100 sec bins |
 |
 |
| Module-wise count rates for Quadrant C Data is divided into 100 sec bins |
 |
 |
| Module-wise count rates for Quadrant D Data is divided into 100 sec bins |
 |
 |
| Parameter | Plot |
|---|---|
| CZT HV Monitor | 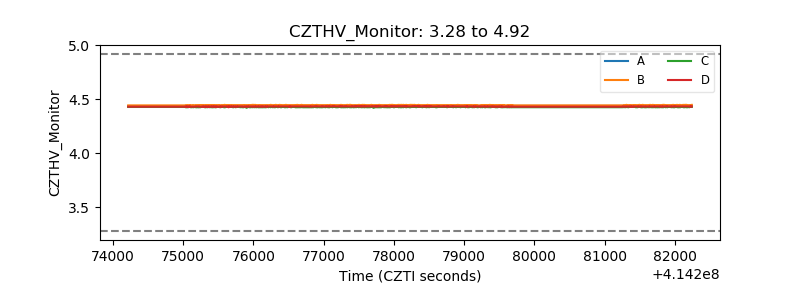 |
| D_VDD | 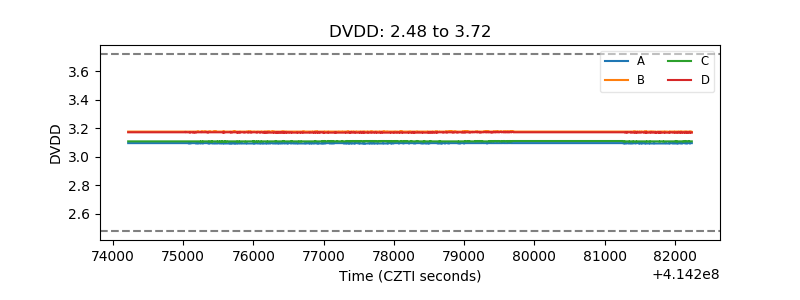 |
| Temperature 1 | 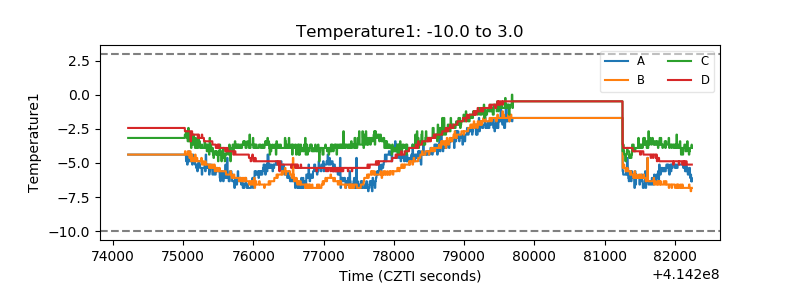 |
| Veto HV Monitor | 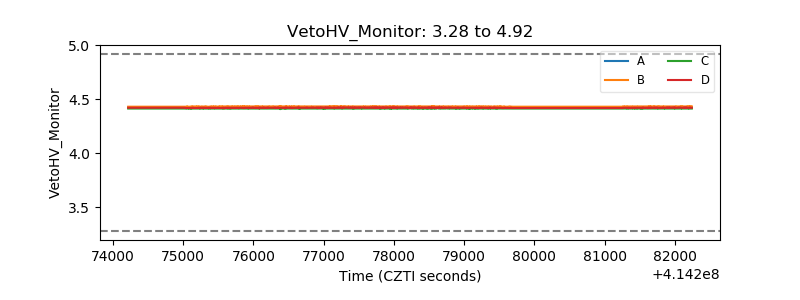 |
| Veto LLD |  |
| Alpha Counter | 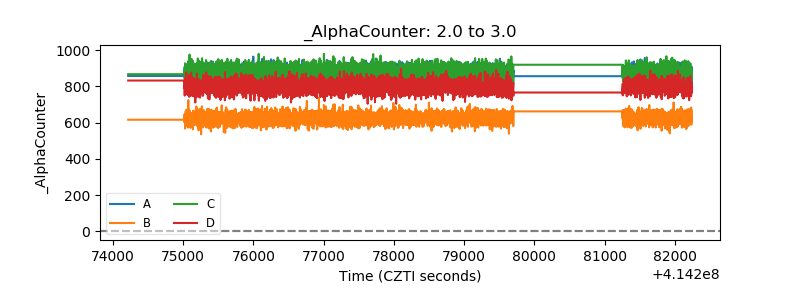 |
| _CPM_Rate |  |
| CZT Counter | 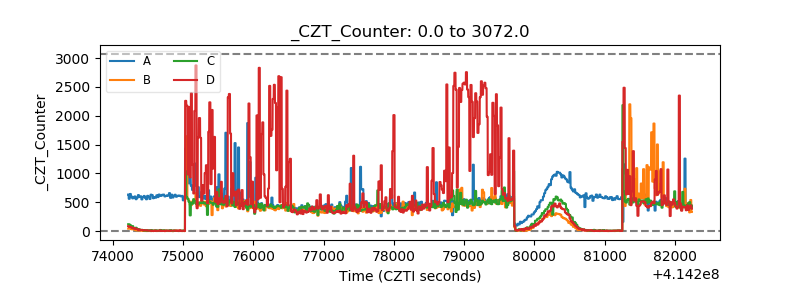 |
| +2.5 Volts monitor | 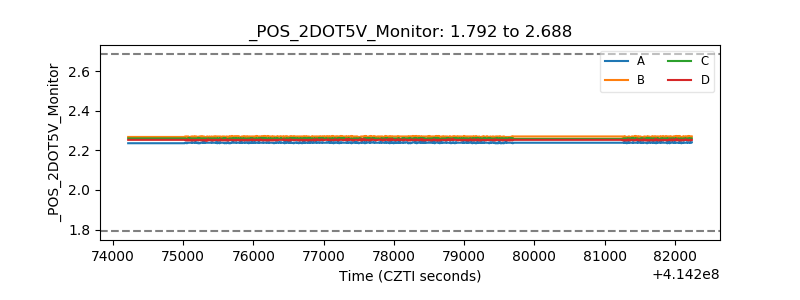 |
| +5 Volts monitor | 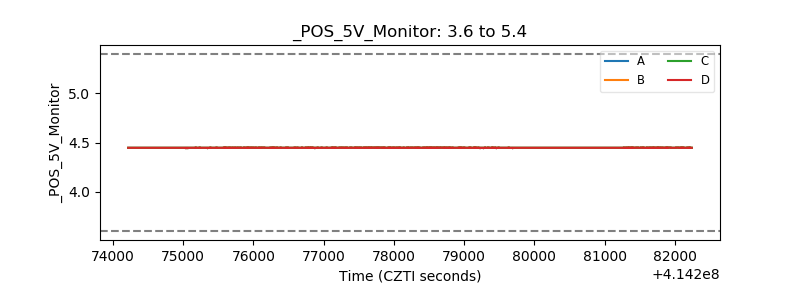 |
| _ROLL_ROT | 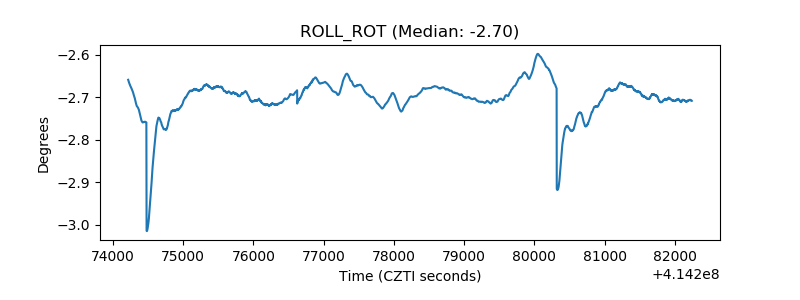 |
| _Roll_DEC | 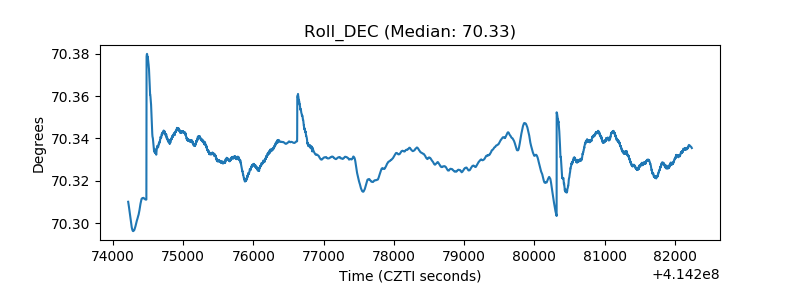 |
| _Roll_RA | 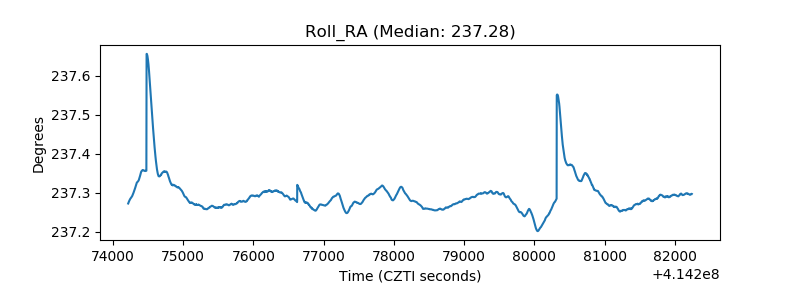 |
| Veto Counter | 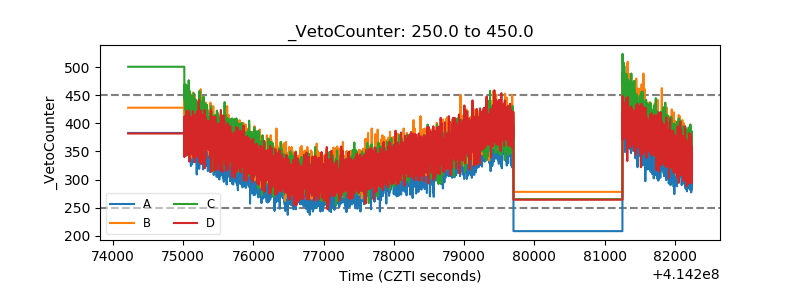 |