| Param | Original file | Final file |
|---|---|---|
| Filename | modeM0/AS1C07_001T01_9000005514_39949cztM0_level2.fits | modeM0/AS1C07_001T01_9000005514_39949cztM0_level2_quad_clean.evt |
| Size (bytes) | 354,326,400 | 91,350,720 |
| Size | 337.9 MB | 87.1 MB |
| Events in quadrant A | 2,795,351 | 617,937 |
| Events in quadrant B | 3,218,531 | 624,051 |
| Events in quadrant C | 2,599,107 | 611,698 |
| Events in quadrant D | 4,062,843 | 517,467 |
| Mode SS | |||
|---|---|---|---|
| Quadrant | BADHDUFLAG | Total packets | Discarded packets |
| A | 0 | 114 | 0 |
| B | 0 | 114 | 0 |
| C | 0 | 114 | 0 |
| D | 0 | 114 | 0 |
| Mode M9 | |||
|---|---|---|---|
| Quadrant | BADHDUFLAG | Total packets | Discarded packets |
| A | 0 | 27 | 0 |
| B | 0 | 27 | 0 |
| C | 0 | 27 | 0 |
| D | 0 | 28 | 0 |
| Mode M0 | |||
|---|---|---|---|
| Quadrant | BADHDUFLAG | Total packets | Discarded packets |
| A | 0 | 12082 | 3 |
| B | 0 | 13740 | 2 |
| C | 0 | 11511 | 2 |
| D | 0 | 16285 | 2 |
| Quadrant | Total seconds | Saturated seconds | Saturation percentage |
|---|---|---|---|
| A | 5648 | 11 | 0.194759% |
| B | 5648 | 133 | 2.354816% |
| C | 5648 | 6 | 0.106232% |
| D | 5648 | 520 | 9.206799% |
Noise dominated data is calculated using 1-second bins in cleaned event files. If a bin has >2000 counts, and if more than 50% of those come from <1% of pixels, then it is considered to be noise-dominated and hence unusable.
| Quadrant | # 1 sec bins | Bins with >0 counts | Bins with >2000 counts | High rate bins dominated by noise | Noise dominated (total time) | Noise dominated (detector-on time) | Marked lightcurve |
|---|---|---|---|---|---|---|---|
| A | 7351 | 5649 | 5 | 5 | 0.07% | 0.09% | 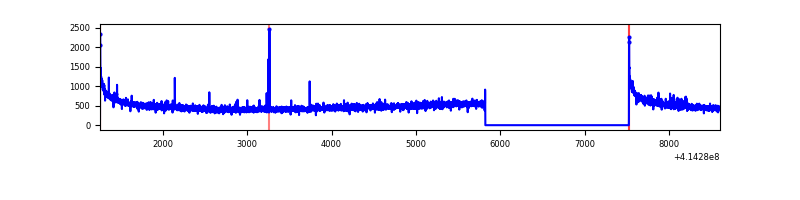 |
| B | 7351 | 5649 | 105 | 105 | 1.43% | 1.86% | 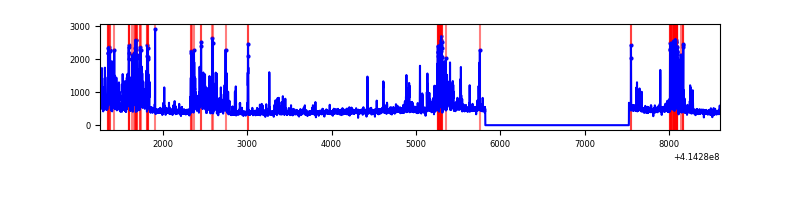 |
| C | 7351 | 5649 | 4 | 4 | 0.05% | 0.07% | 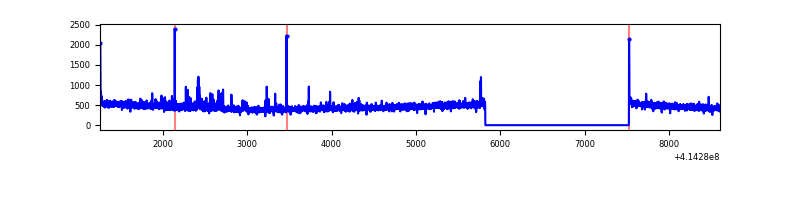 |
| D | 7351 | 5649 | 530 | 530 | 7.21% | 9.38% | 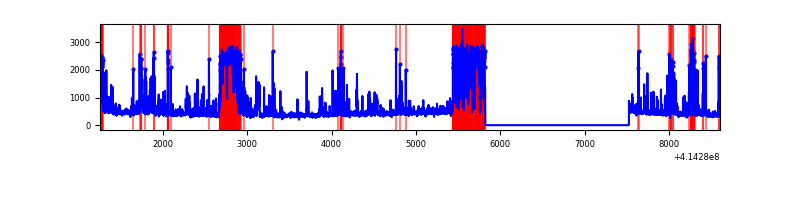 |
Top three noisy pixels from each quadrant. If the there are fewer than three noisy pixels in the level2.evt file, extra rows are filled as -1
| Pixel properties | Quadrant properties | ||||||
|---|---|---|---|---|---|---|---|
| Quadrant | DetID | PixID | Counts | Sigma | Mean | Median | Sigma |
| A | 10 | 83 | 459127 | 3779.74 | 592 | 581 | 121.3 |
| A | 7 | 3 | 9259 | 71.53 | 592 | 581 | 121.3 |
| A | 7 | 192 | 8013 | 61.26 | 592 | 581 | 121.3 |
| B | 5 | 255 | 735025 | 6408.41 | 589 | 574 | 114.6 |
| B | 4 | 171 | 113884 | 988.68 | 589 | 574 | 114.6 |
| B | 0 | 183 | 23131 | 196.82 | 589 | 574 | 114.6 |
| C | 15 | 214 | 235180 | 1739.54 | 581 | 582 | 134.9 |
| C | 9 | 54 | 58081 | 426.35 | 581 | 582 | 134.9 |
| C | 0 | 10 | 18080 | 129.75 | 581 | 582 | 134.9 |
| D | 12 | 227 | 774614 | 5746.24 | 554 | 538 | 134.7 |
| D | 13 | 171 | 595232 | 4414.63 | 554 | 538 | 134.7 |
| D | 1 | 47 | 218980 | 1621.57 | 554 | 538 | 134.7 |
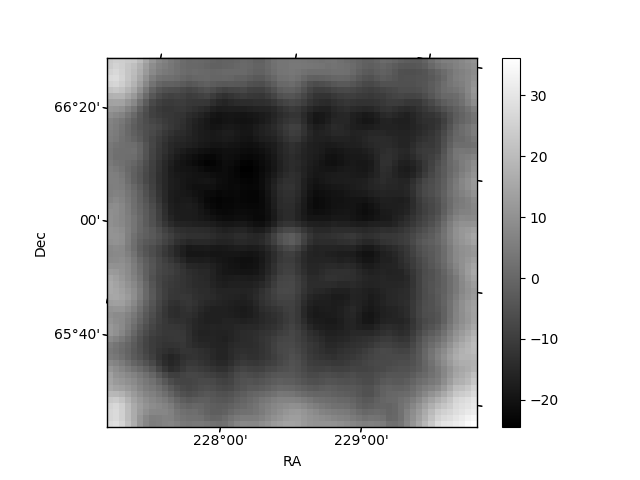
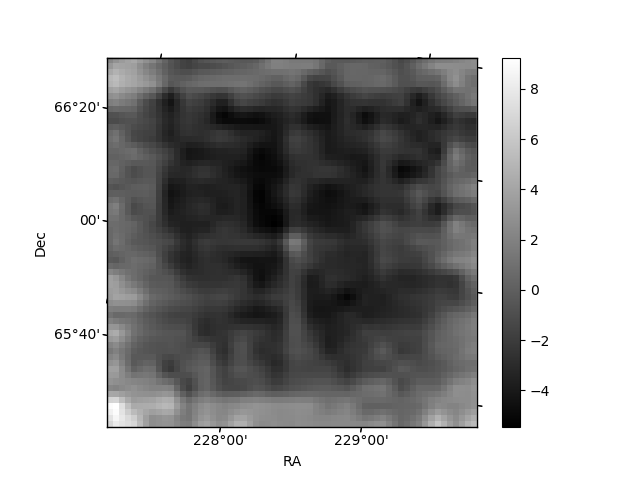
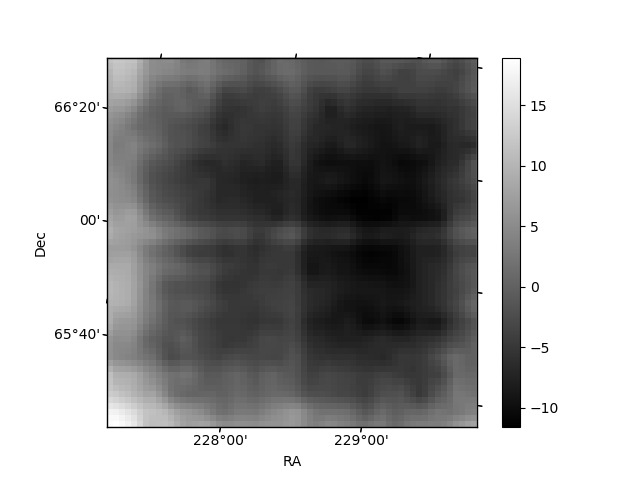
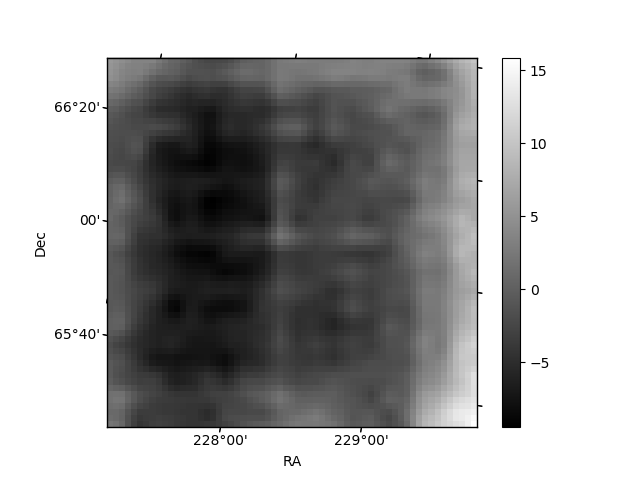
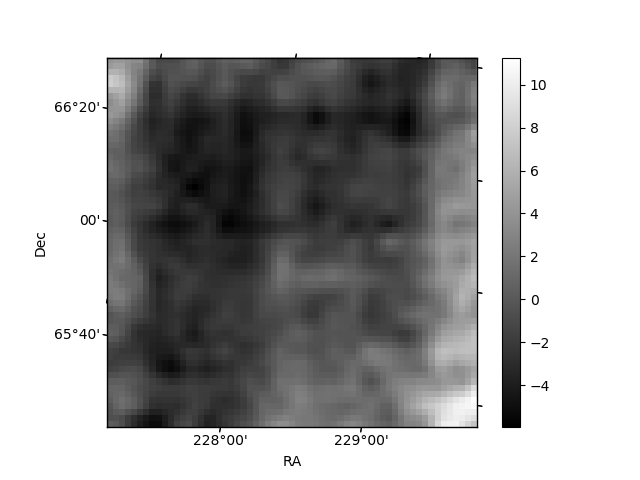
Histogram calculated using DETX and DETY for each event in the final _common_clean file
| Quadrant A | 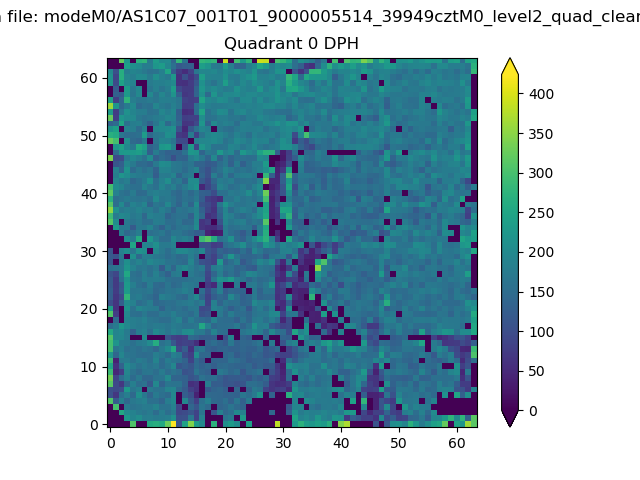 |
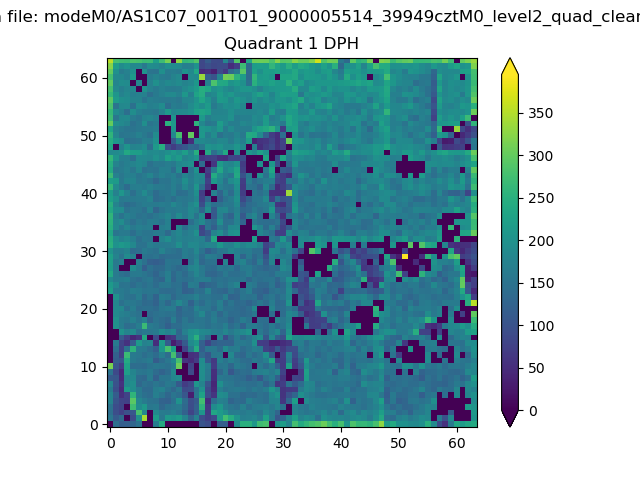 |
Quadrant B |
|---|---|---|---|
| Quadrant D | 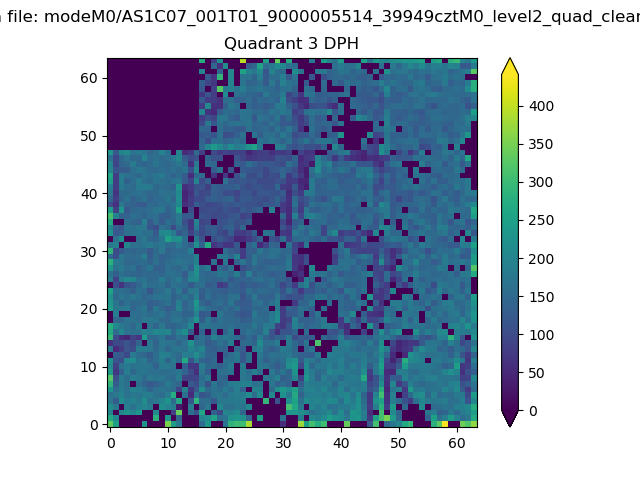 |
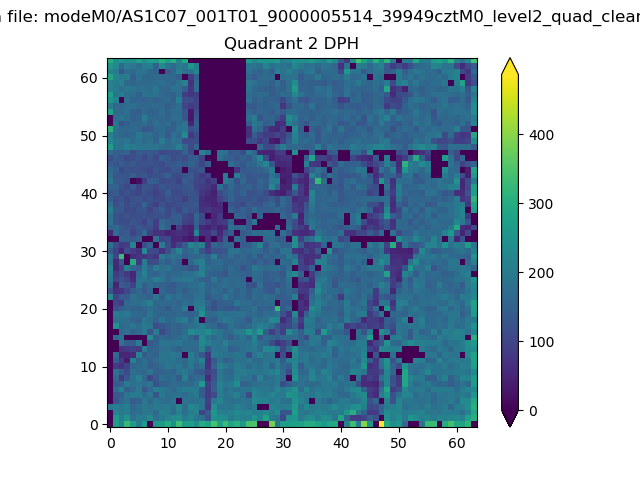 |
Quadrant C |
| Plot type | Count rate plots | Images |
|---|---|---|
| Comparison with Poisson distribution Blue bars denote a histogram of data divided into 1 sec bins. Red curve is a Poisson curve with rate = median count rate of data. |
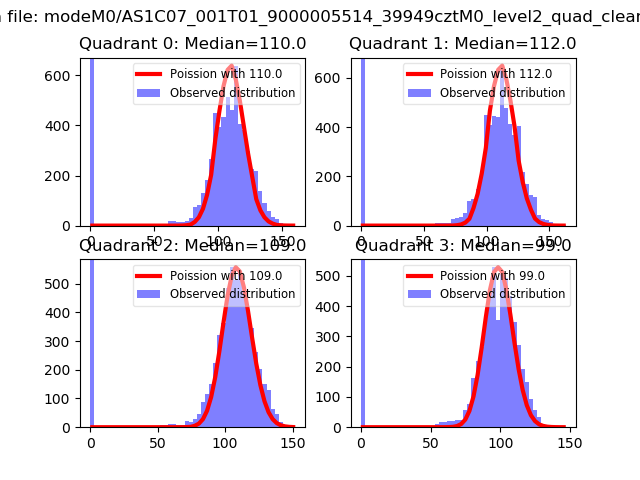 |
 |
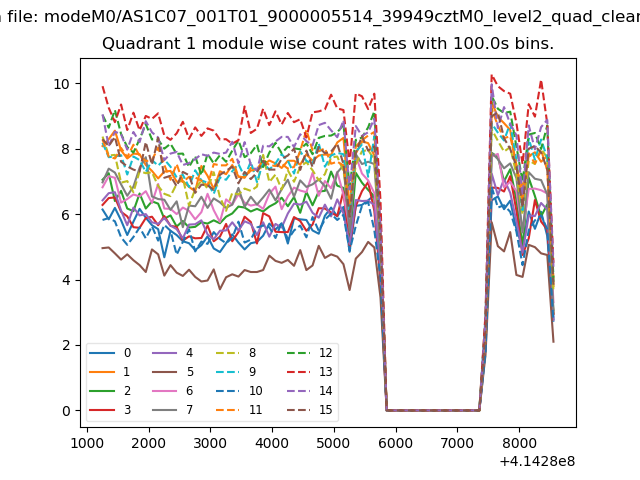
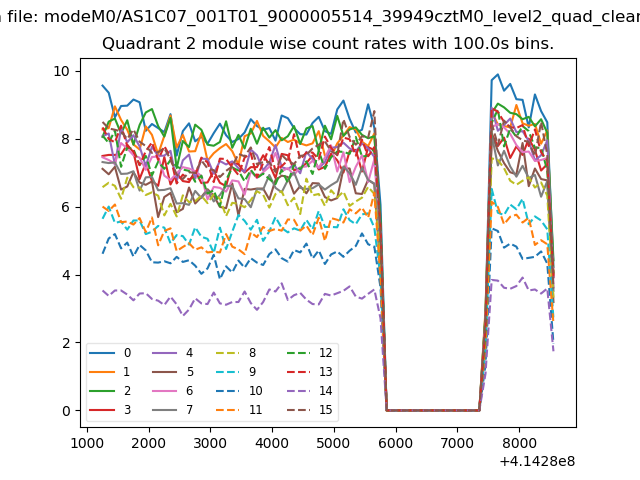
| Quadrant-wise count rates Data is divided into 100 sec bins |
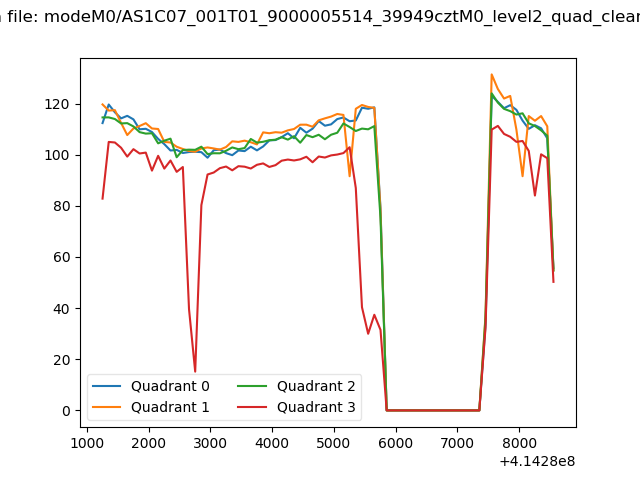 |
|
| Module-wise count rates for Quadrant A Data is divided into 100 sec bins |
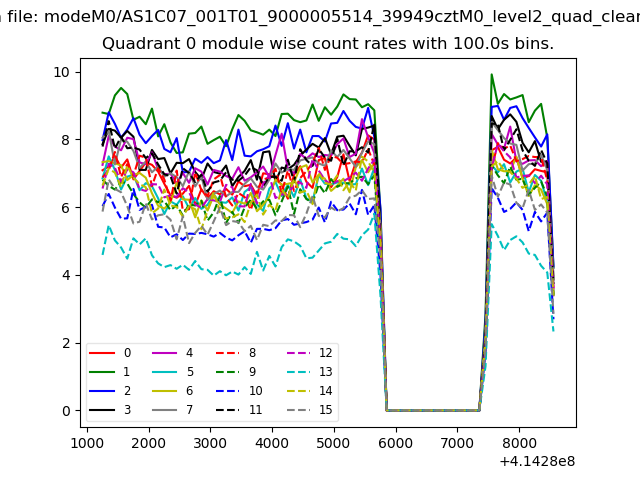 |
 |
| Module-wise count rates for Quadrant B Data is divided into 100 sec bins |
 |
 |
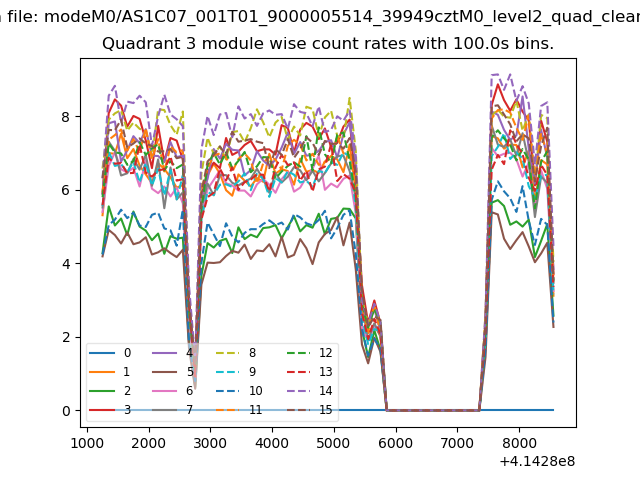
| Module-wise count rates for Quadrant C Data is divided into 100 sec bins |
 |
 |
| Module-wise count rates for Quadrant D Data is divided into 100 sec bins |
 |
 |
| Parameter | Plot |
|---|---|
| CZT HV Monitor | 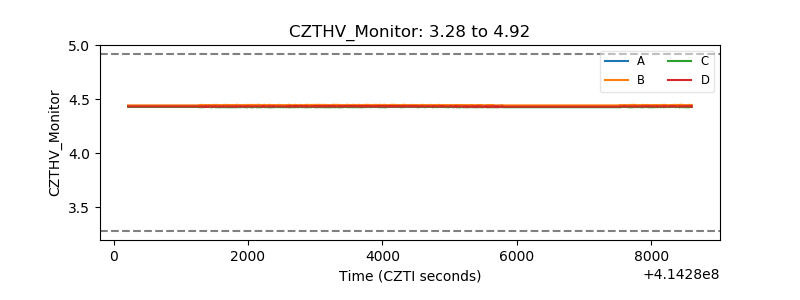 |
| D_VDD | 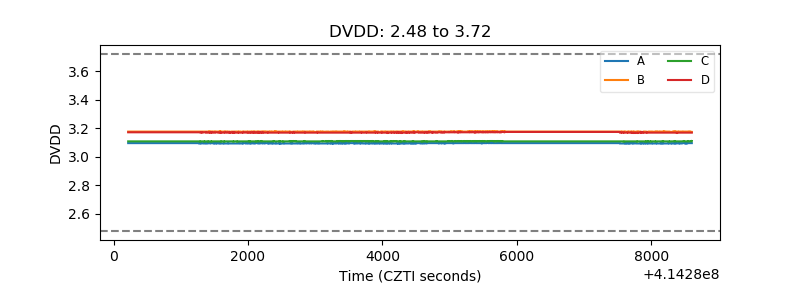 |
| Temperature 1 | 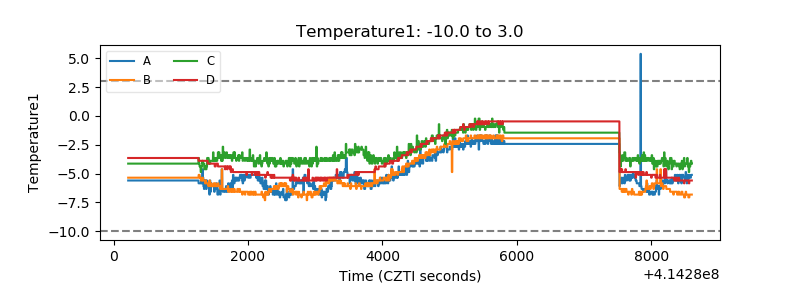 |
| Veto HV Monitor | 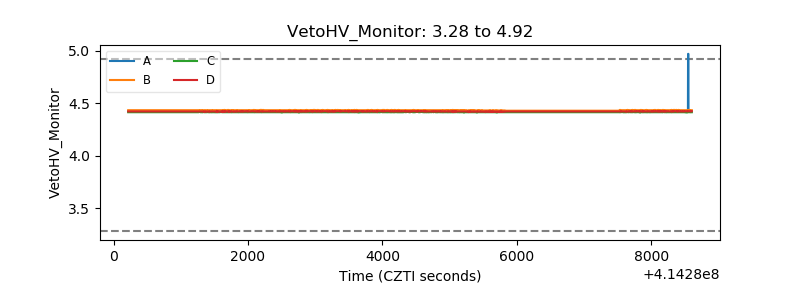 |
| Veto LLD |  |
| Alpha Counter | 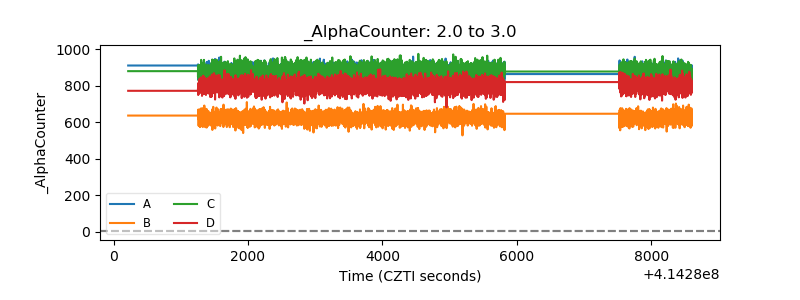 |
| _CPM_Rate | 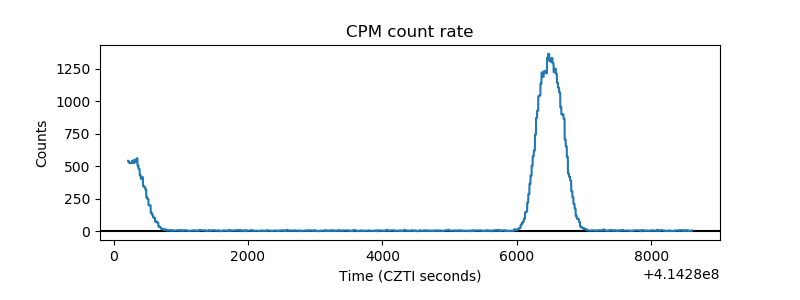 |
| CZT Counter | 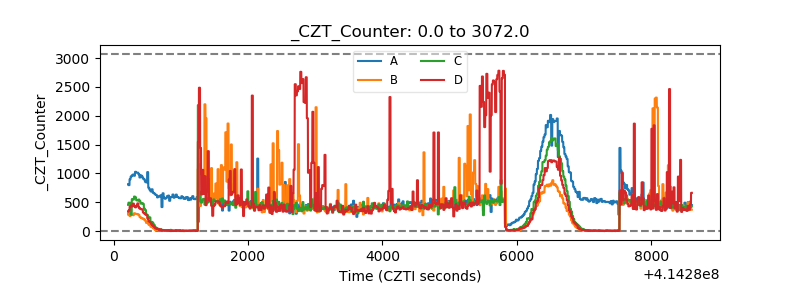 |
| +2.5 Volts monitor | 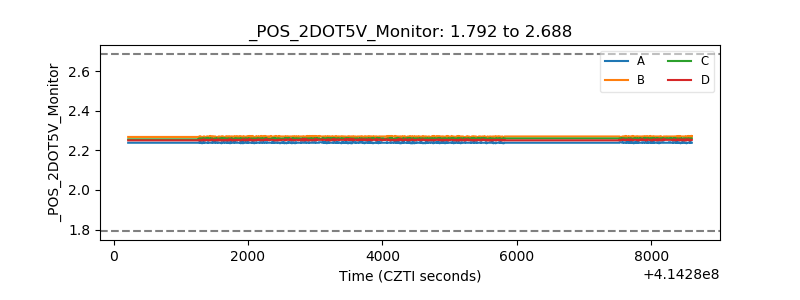 |
| +5 Volts monitor |  |
| _ROLL_ROT | 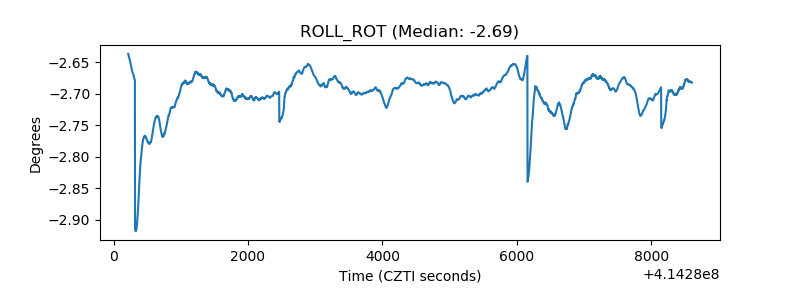 |
| _Roll_DEC | 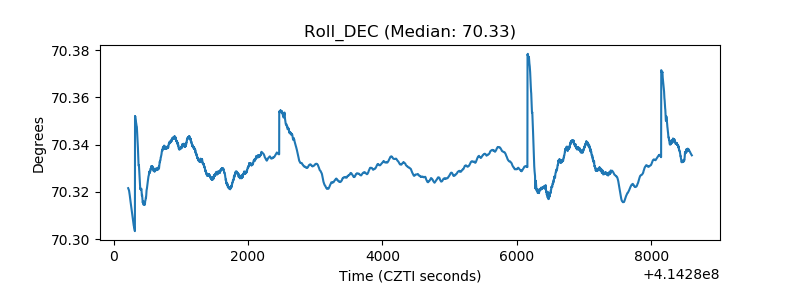 |
| _Roll_RA | 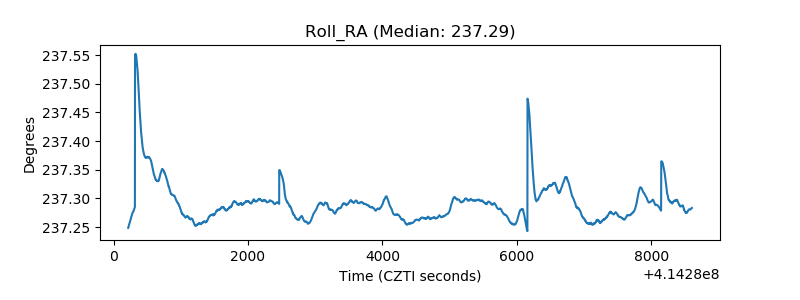 |
| Veto Counter | 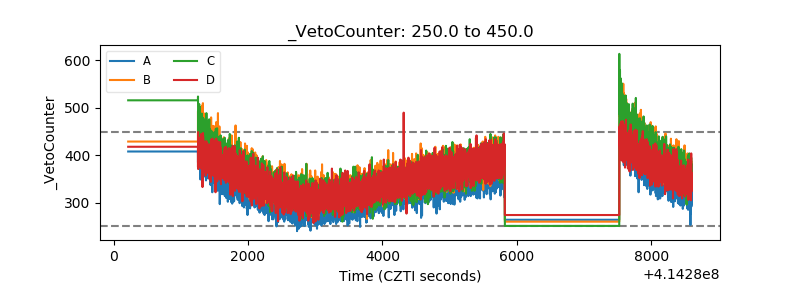 |