| Param | Original file | Final file |
|---|---|---|
| Filename | modeM0/AS1C07_001T01_9000005514_39951cztM0_level2.fits | modeM0/AS1C07_001T01_9000005514_39951cztM0_level2_quad_clean.evt |
| Size (bytes) | 339,065,280 | 91,693,440 |
| Size | 323.4 MB | 87.4 MB |
| Events in quadrant A | 2,804,812 | 624,476 |
| Events in quadrant B | 2,699,858 | 639,153 |
| Events in quadrant C | 2,598,361 | 613,837 |
| Events in quadrant D | 4,018,591 | 513,668 |
| Mode SS | |||
|---|---|---|---|
| Quadrant | BADHDUFLAG | Total packets | Discarded packets |
| A | 0 | 112 | 0 |
| B | 0 | 112 | 0 |
| C | 0 | 112 | 0 |
| D | 0 | 112 | 0 |
| Mode M9 | |||
|---|---|---|---|
| Quadrant | BADHDUFLAG | Total packets | Discarded packets |
| A | 0 | 30 | 0 |
| B | 0 | 30 | 0 |
| C | 0 | 30 | 0 |
| D | 0 | 31 | 0 |
| Mode M0 | |||
|---|---|---|---|
| Quadrant | BADHDUFLAG | Total packets | Discarded packets |
| A | 0 | 11930 | 3 |
| B | 0 | 11994 | 2 |
| C | 0 | 11390 | 2 |
| D | 0 | 16062 | 2 |
| Quadrant | Total seconds | Saturated seconds | Saturation percentage |
|---|---|---|---|
| A | 5508 | 12 | 0.217865% |
| B | 5508 | 68 | 1.234568% |
| C | 5508 | 14 | 0.254176% |
| D | 5508 | 510 | 9.259259% |
Noise dominated data is calculated using 1-second bins in cleaned event files. If a bin has >2000 counts, and if more than 50% of those come from <1% of pixels, then it is considered to be noise-dominated and hence unusable.
| Quadrant | # 1 sec bins | Bins with >0 counts | Bins with >2000 counts | High rate bins dominated by noise | Noise dominated (total time) | Noise dominated (detector-on time) | Marked lightcurve |
|---|---|---|---|---|---|---|---|
| A | 7332 | 5510 | 7 | 7 | 0.10% | 0.13% | 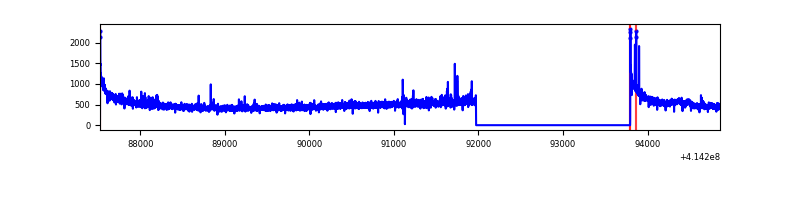 |
| B | 7332 | 5510 | 58 | 58 | 0.79% | 1.05% | 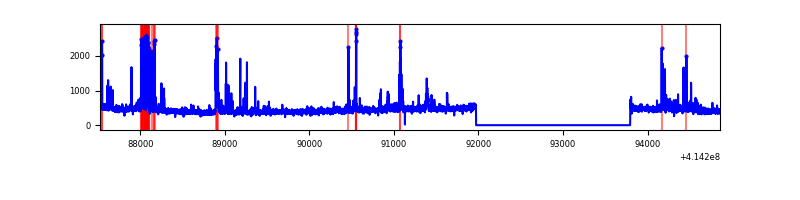 |
| C | 7332 | 5510 | 10 | 10 | 0.14% | 0.18% | 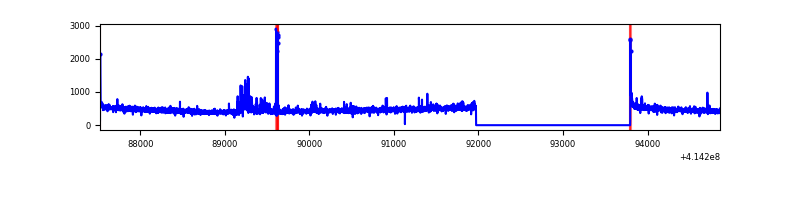 |
| D | 7332 | 5510 | 501 | 501 | 6.83% | 9.09% | 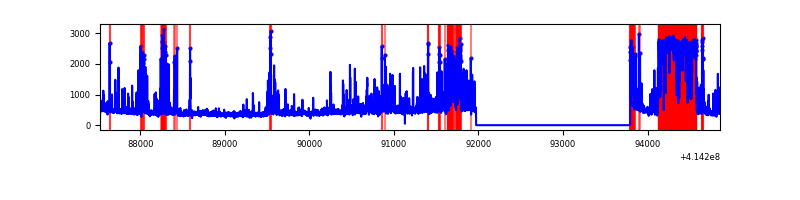 |
Top three noisy pixels from each quadrant. If the there are fewer than three noisy pixels in the level2.evt file, extra rows are filled as -1
| Pixel properties | Quadrant properties | ||||||
|---|---|---|---|---|---|---|---|
| Quadrant | DetID | PixID | Counts | Sigma | Mean | Median | Sigma |
| A | 10 | 83 | 465076 | 3905.24 | 585 | 573 | 118.9 |
| A | 7 | 192 | 26653 | 219.26 | 585 | 573 | 118.9 |
| A | 13 | 6 | 19824 | 161.85 | 585 | 573 | 118.9 |
| B | 5 | 255 | 271636 | 2409.1 | 584 | 569 | 112.5 |
| B | 4 | 171 | 92406 | 816.2 | 584 | 569 | 112.5 |
| B | 12 | 111 | 13960 | 119.01 | 584 | 569 | 112.5 |
| C | 15 | 214 | 232584 | 1756.82 | 572 | 575 | 132.1 |
| C | 9 | 54 | 58912 | 441.74 | 572 | 575 | 132.1 |
| C | 14 | 254 | 48352 | 361.78 | 572 | 575 | 132.1 |
| D | 1 | 47 | 964592 | 7321.78 | 541 | 526 | 131.7 |
| D | 2 | 250 | 265956 | 2015.86 | 541 | 526 | 131.7 |
| D | 2 | 249 | 218367 | 1654.43 | 541 | 526 | 131.7 |
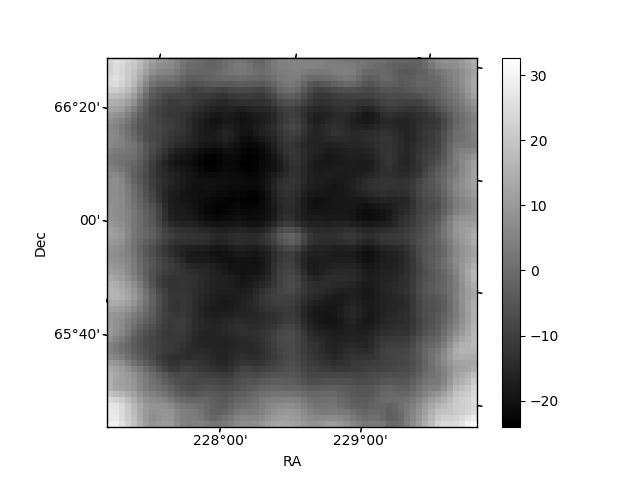
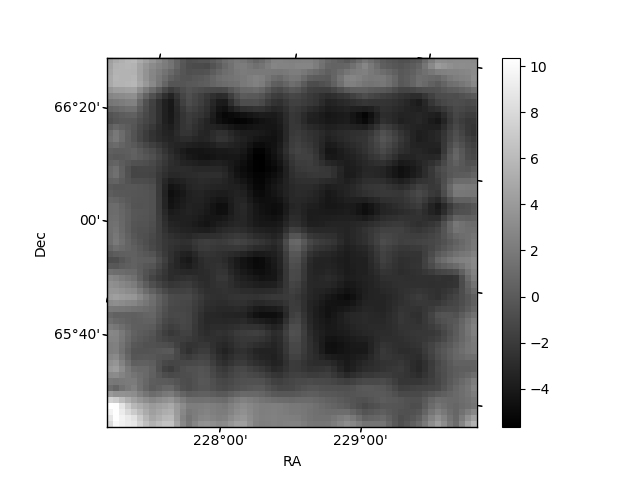
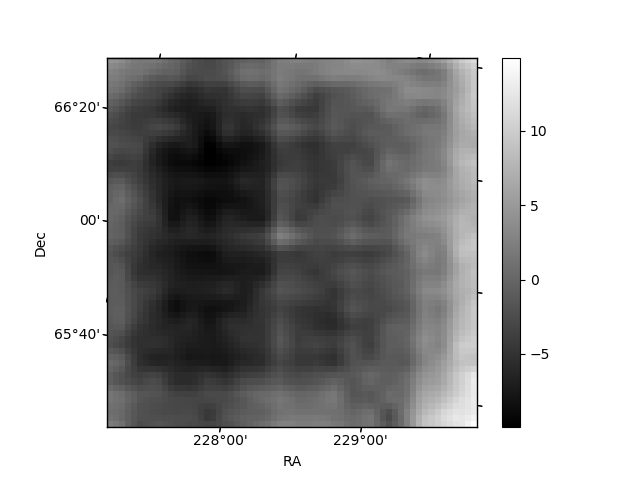
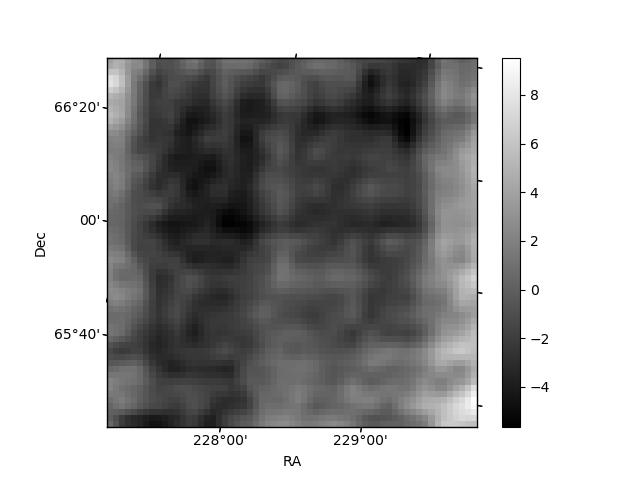
Histogram calculated using DETX and DETY for each event in the final _common_clean file
| Quadrant A | 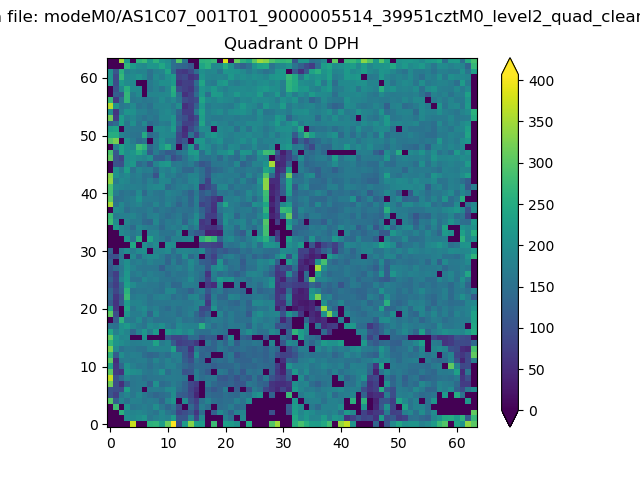 |
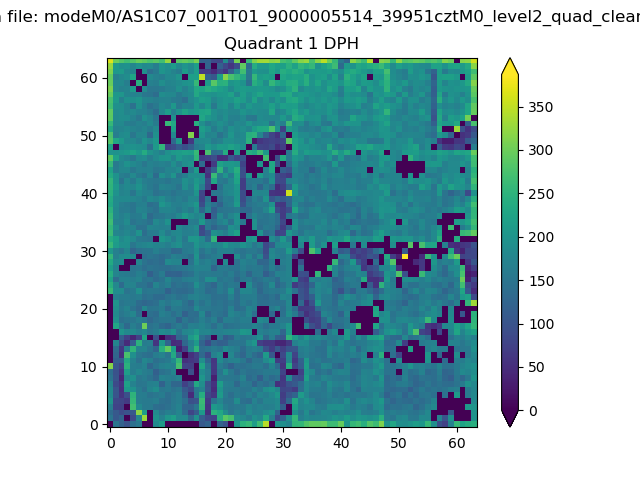 |
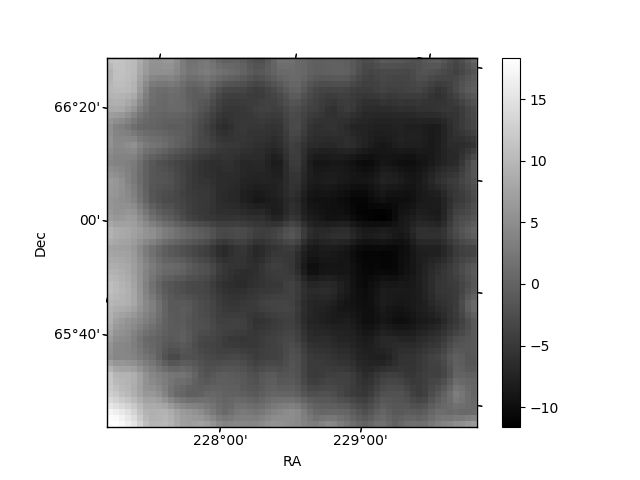
Quadrant B |
|---|---|---|---|
| Quadrant D | 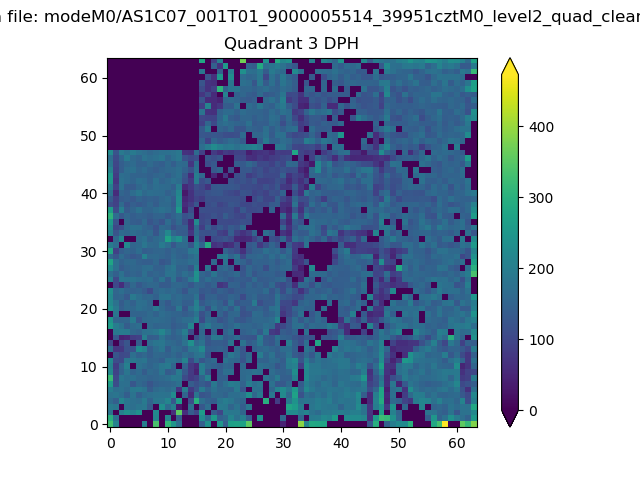 |
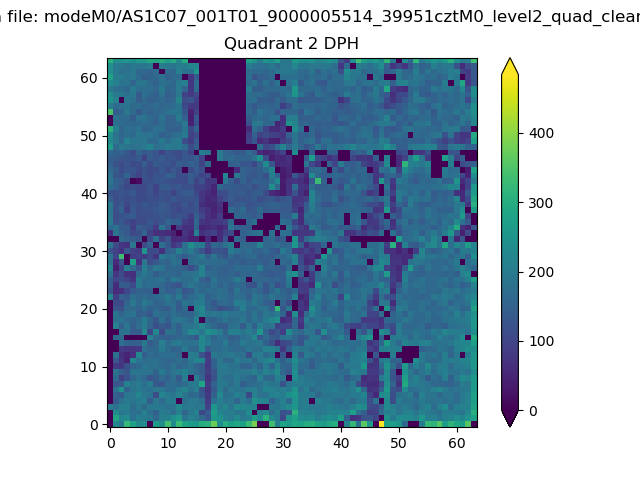 |
Quadrant C |
| Plot type | Count rate plots | Images |
|---|---|---|
| Comparison with Poisson distribution Blue bars denote a histogram of data divided into 1 sec bins. Red curve is a Poisson curve with rate = median count rate of data. |
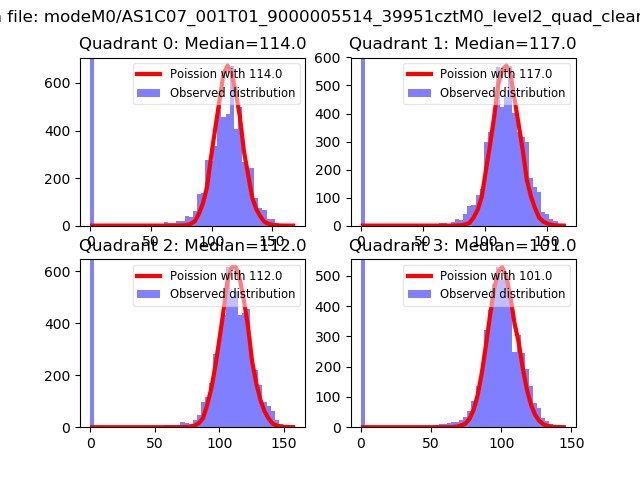 |
 |
| Quadrant-wise count rates Data is divided into 100 sec bins |
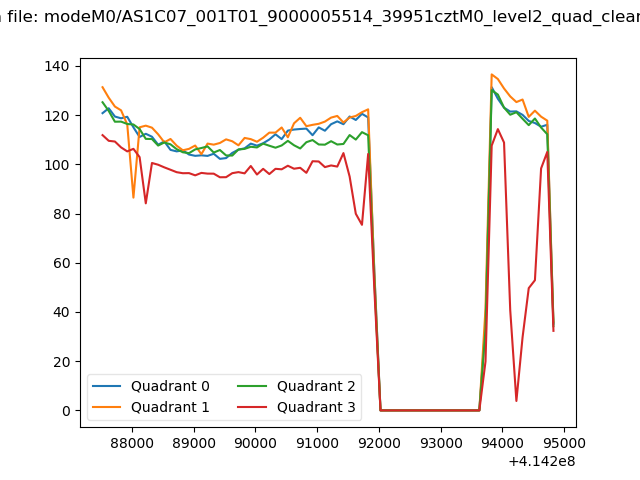 |
|
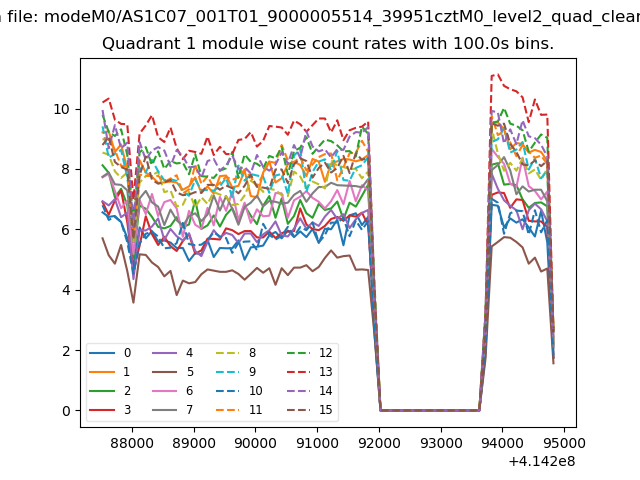
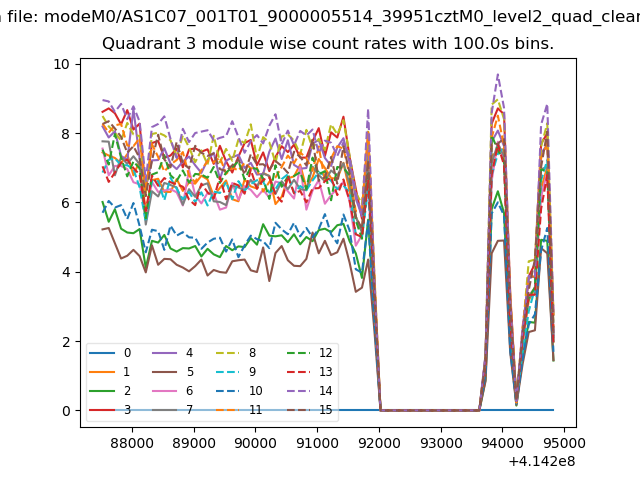
| Module-wise count rates for Quadrant A Data is divided into 100 sec bins |
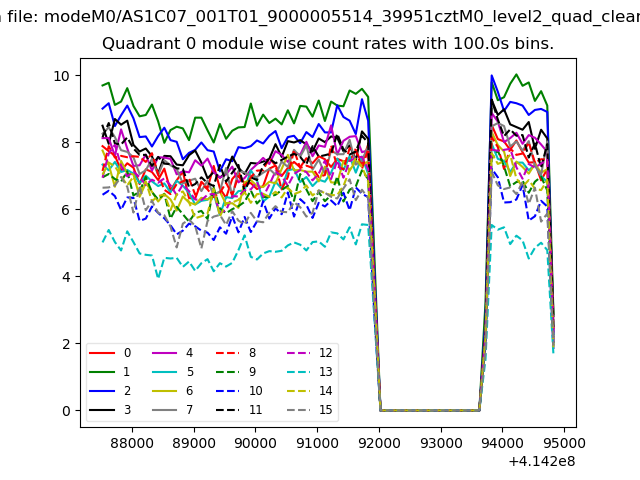 |
 |
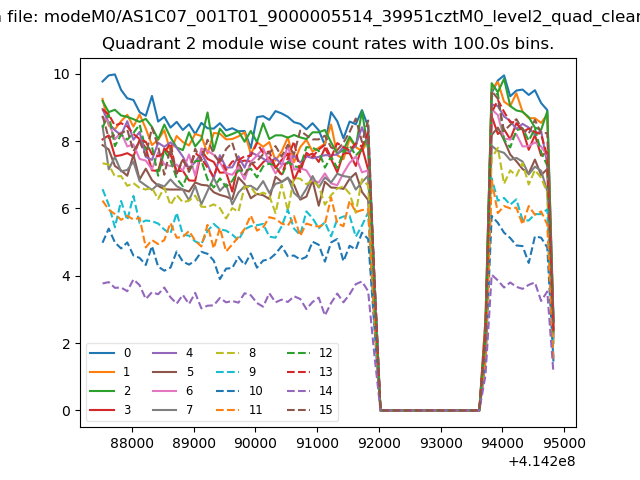
| Module-wise count rates for Quadrant B Data is divided into 100 sec bins |
 |
 |
| Module-wise count rates for Quadrant C Data is divided into 100 sec bins |
 |
 |
| Module-wise count rates for Quadrant D Data is divided into 100 sec bins |
 |
 |
| Parameter | Plot |
|---|---|
| CZT HV Monitor | 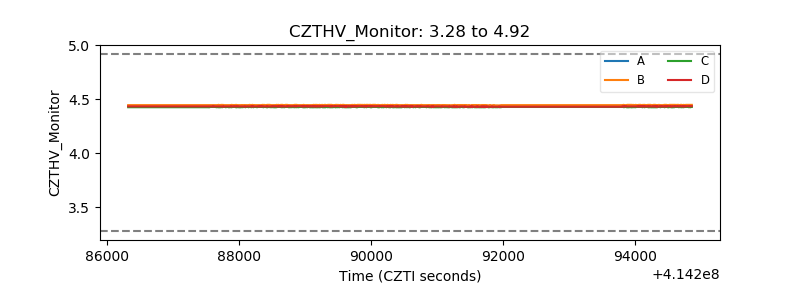 |
| D_VDD | 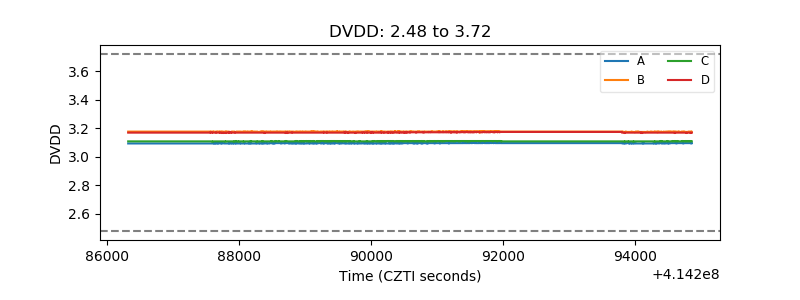 |
| Temperature 1 | 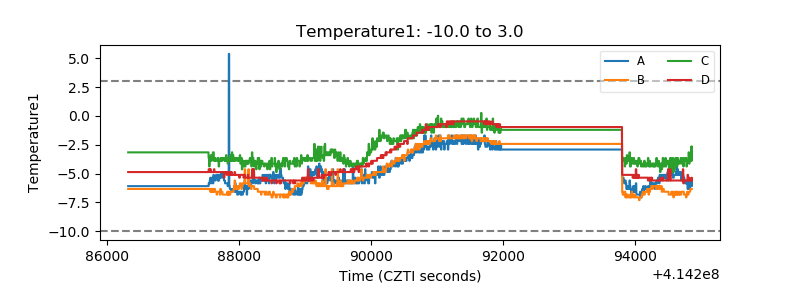 |
| Veto HV Monitor | 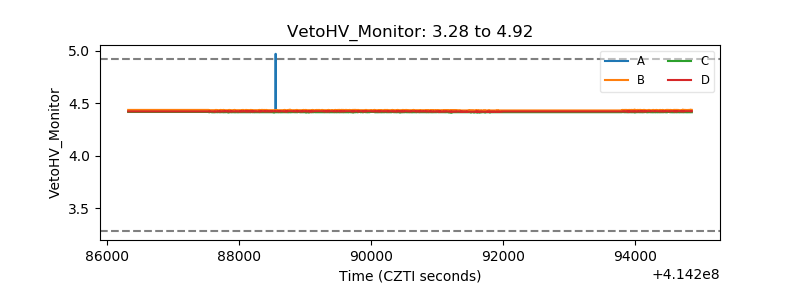 |
| Veto LLD | 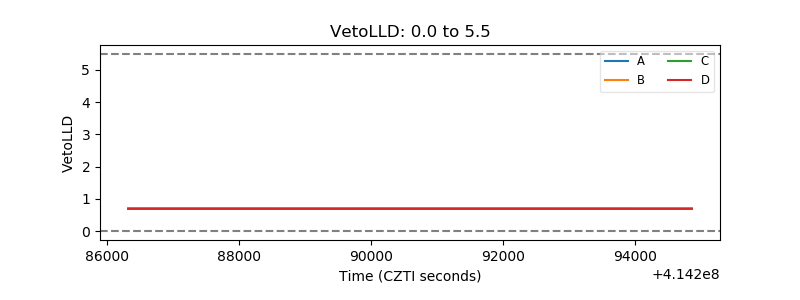 |
| Alpha Counter | 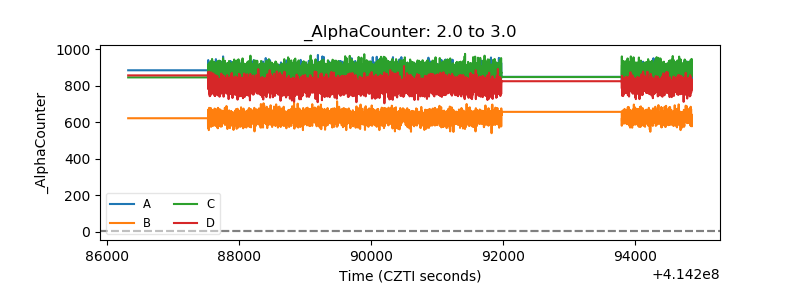 |
| _CPM_Rate | 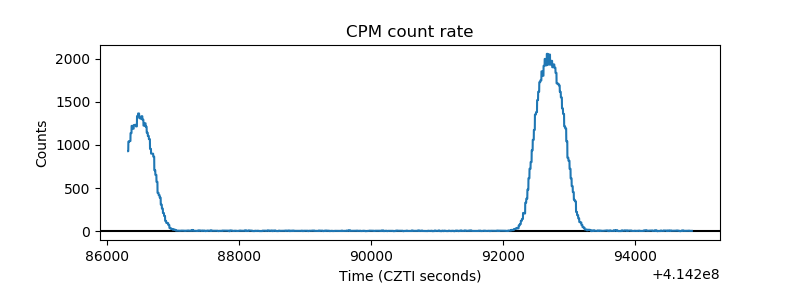 |
| CZT Counter | 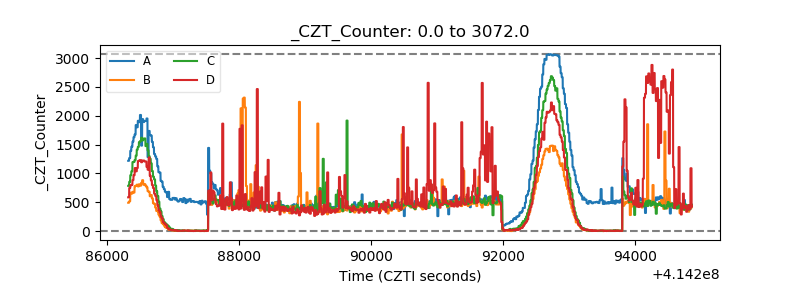 |
| +2.5 Volts monitor | 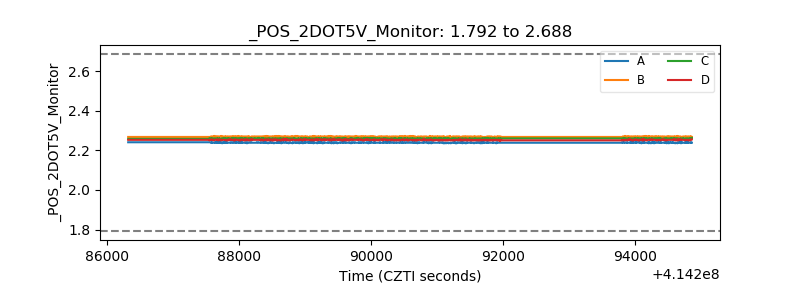 |
| +5 Volts monitor | 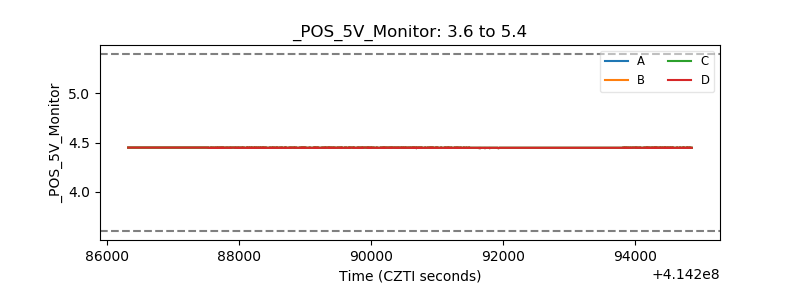 |
| _ROLL_ROT | 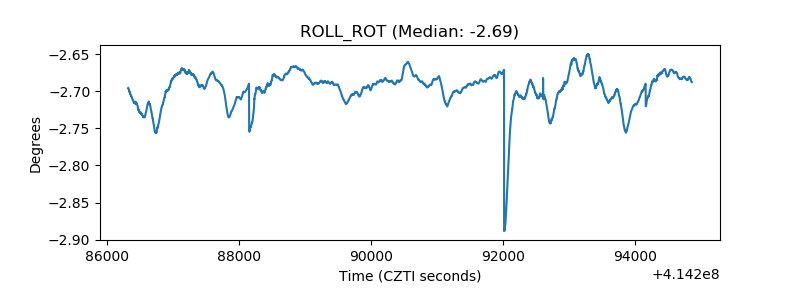 |
| _Roll_DEC | 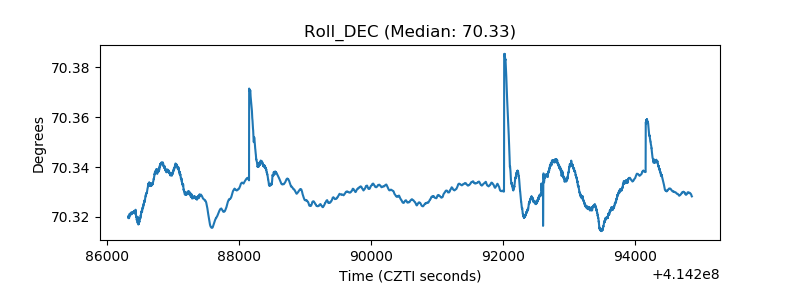 |
| _Roll_RA | 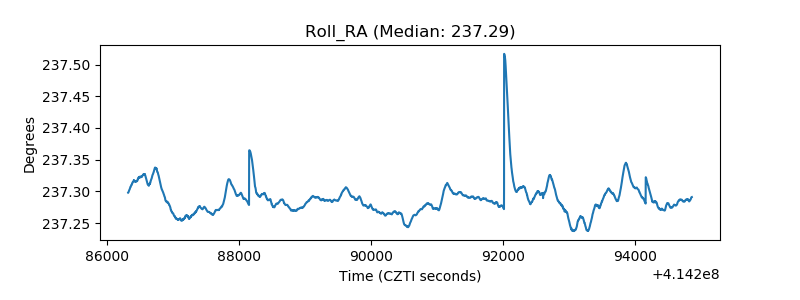 |
| Veto Counter | 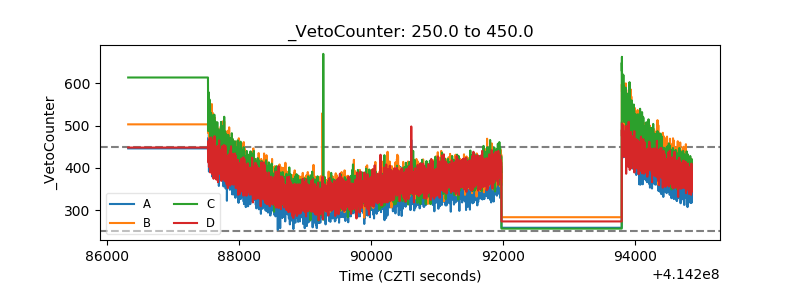 |