| Param | Original file | Final file |
|---|---|---|
| Filename | modeM0/AS1C07_001T01_9000005514_39952cztM0_level2.fits | modeM0/AS1C07_001T01_9000005514_39952cztM0_level2_quad_clean.evt |
| Size (bytes) | 363,908,160 | 89,038,080 |
| Size | 347.0 MB | 84.9 MB |
| Events in quadrant A | 3,002,288 | 607,681 |
| Events in quadrant B | 2,727,473 | 628,861 |
| Events in quadrant C | 2,428,318 | 601,897 |
| Events in quadrant D | 4,904,107 | 490,057 |
| Mode SS | |||
|---|---|---|---|
| Quadrant | BADHDUFLAG | Total packets | Discarded packets |
| A | 0 | 108 | 0 |
| B | 0 | 108 | 0 |
| C | 0 | 108 | 0 |
| D | 0 | 108 | 0 |
| Mode M9 | |||
|---|---|---|---|
| Quadrant | BADHDUFLAG | Total packets | Discarded packets |
| A | 0 | 19 | 0 |
| B | 0 | 19 | 0 |
| C | 0 | 19 | 0 |
| D | 0 | 19 | 0 |
| Mode M0 | |||
|---|---|---|---|
| Quadrant | BADHDUFLAG | Total packets | Discarded packets |
| A | 0 | 12117 | 2 |
| B | 0 | 11778 | 1 |
| C | 0 | 10657 | 1 |
| D | 0 | 18278 | 1 |
| Quadrant | Total seconds | Saturated seconds | Saturation percentage |
|---|---|---|---|
| A | 5245 | 108 | 2.059104% |
| B | 5245 | 100 | 1.906578% |
| C | 5245 | 4 | 0.076263% |
| D | 5245 | 657 | 12.526215% |
Noise dominated data is calculated using 1-second bins in cleaned event files. If a bin has >2000 counts, and if more than 50% of those come from <1% of pixels, then it is considered to be noise-dominated and hence unusable.
| Quadrant | # 1 sec bins | Bins with >0 counts | Bins with >2000 counts | High rate bins dominated by noise | Noise dominated (total time) | Noise dominated (detector-on time) | Marked lightcurve |
|---|---|---|---|---|---|---|---|
| A | 7189 | 5246 | 100 | 100 | 1.39% | 1.91% | 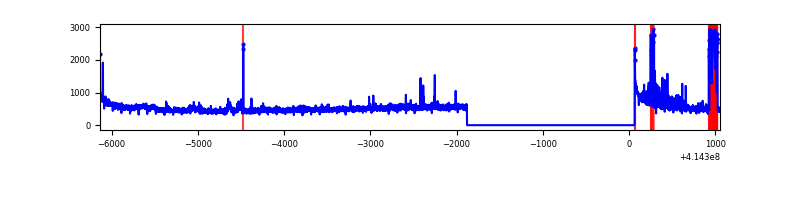 |
| B | 7189 | 5245 | 83 | 83 | 1.15% | 1.58% | 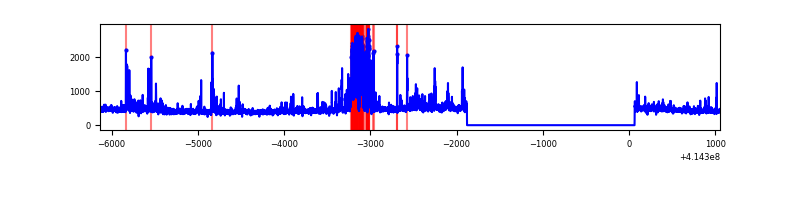 |
| C | 7189 | 5246 | 3 | 3 | 0.04% | 0.06% | 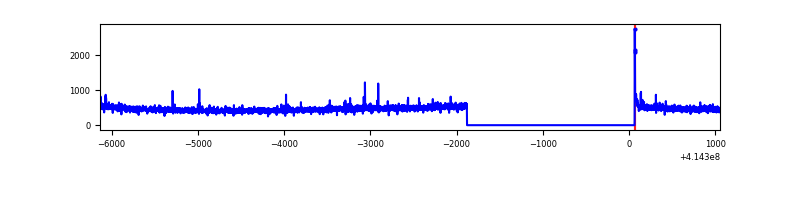 |
| D | 7189 | 5245 | 702 | 702 | 9.76% | 13.38% | 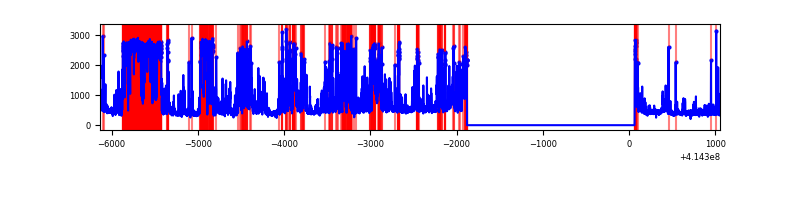 |
Top three noisy pixels from each quadrant. If the there are fewer than three noisy pixels in the level2.evt file, extra rows are filled as -1
| Pixel properties | Quadrant properties | ||||||
|---|---|---|---|---|---|---|---|
| Quadrant | DetID | PixID | Counts | Sigma | Mean | Median | Sigma |
| A | 10 | 83 | 426638 | 3694.04 | 566 | 555 | 115.3 |
| A | 6 | 10 | 300968 | 2604.51 | 566 | 555 | 115.3 |
| A | 7 | 192 | 35931 | 306.7 | 566 | 555 | 115.3 |
| B | 5 | 255 | 272118 | 2519.94 | 565 | 549 | 107.8 |
| B | 4 | 171 | 180015 | 1665.3 | 565 | 549 | 107.8 |
| B | 0 | 230 | 16135 | 144.63 | 565 | 549 | 107.8 |
| C | 15 | 214 | 222164 | 1749.36 | 550 | 554 | 126.7 |
| C | 9 | 54 | 20823 | 160.0 | 550 | 554 | 126.7 |
| C | 0 | 10 | 15296 | 116.37 | 550 | 554 | 126.7 |
| D | 1 | 47 | 2030473 | 16129.1 | 518 | 503 | 125.9 |
| D | 2 | 249 | 247979 | 1966.32 | 518 | 503 | 125.9 |
| D | 12 | 218 | 226055 | 1792.12 | 518 | 503 | 125.9 |
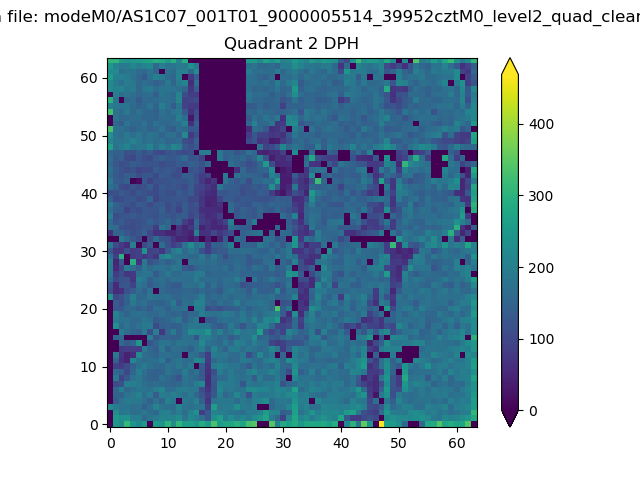
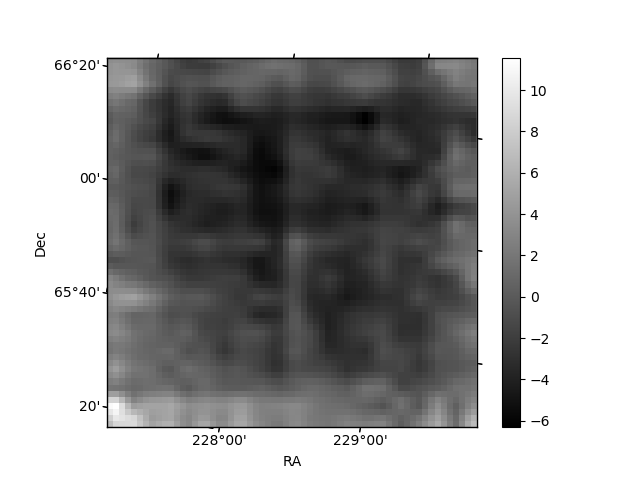
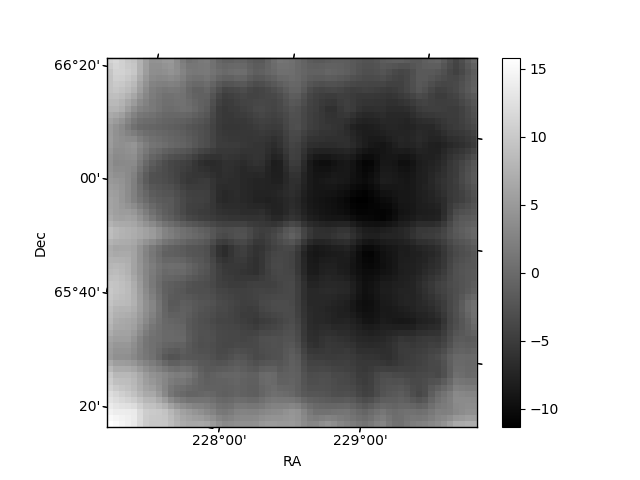
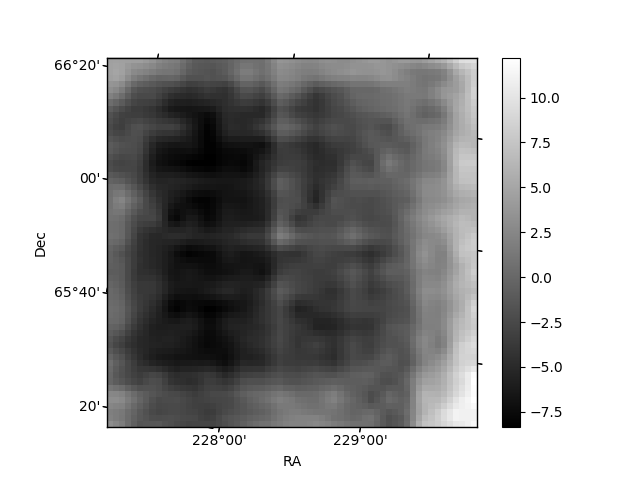
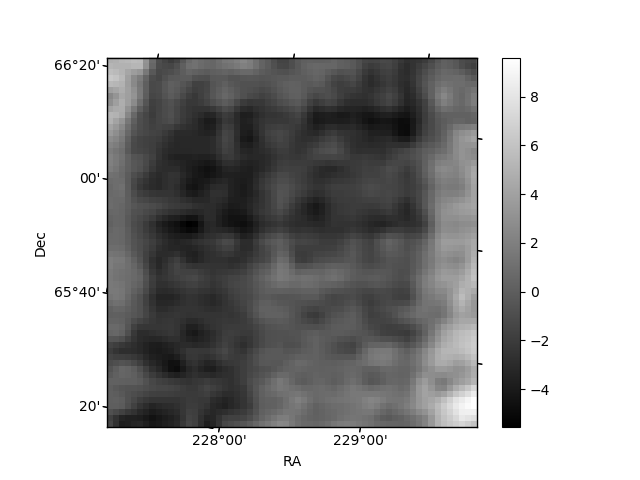
Histogram calculated using DETX and DETY for each event in the final _common_clean file
| Quadrant A | 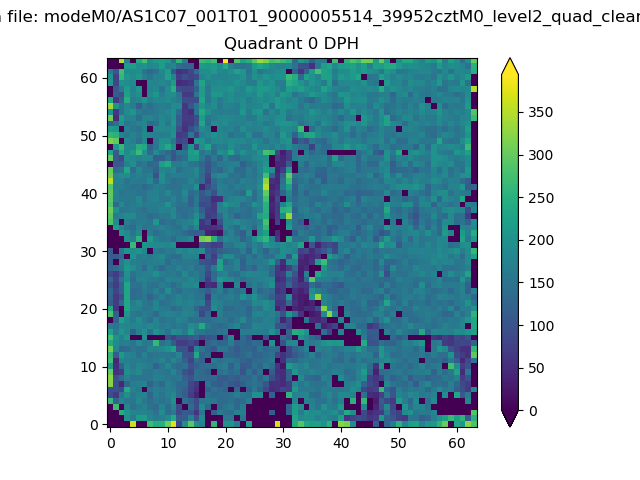 |
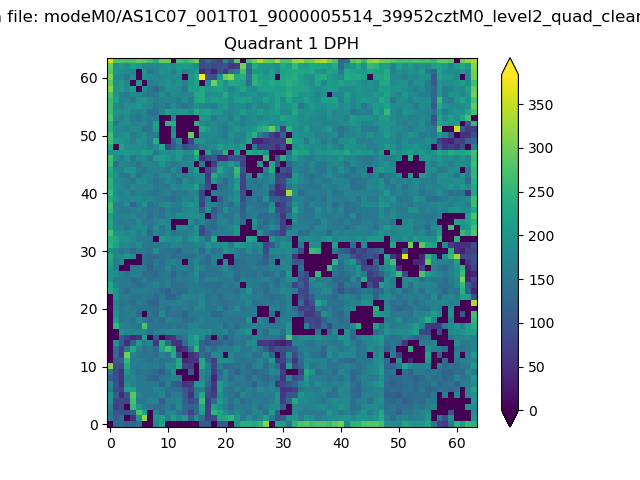 |
Quadrant B |
|---|---|---|---|
| Quadrant D | 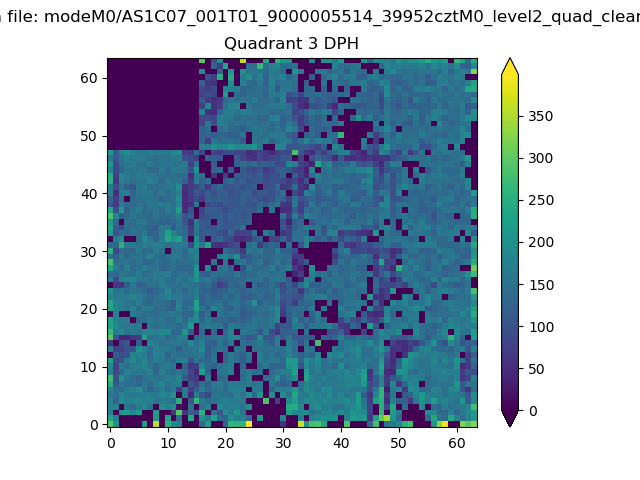 |
 |
Quadrant C |
| Plot type | Count rate plots | Images |
|---|---|---|
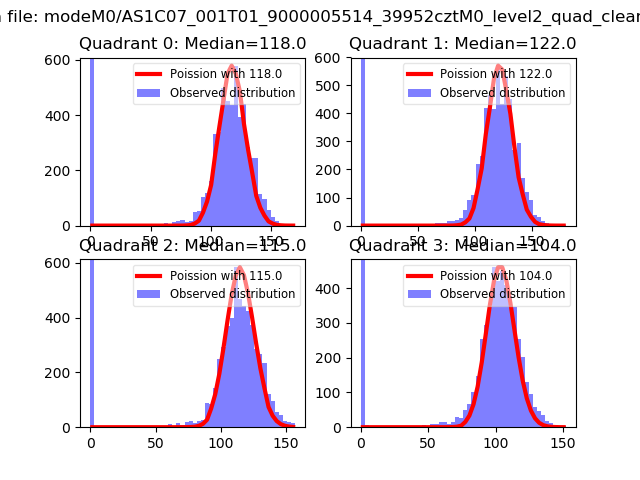
| Comparison with Poisson distribution Blue bars denote a histogram of data divided into 1 sec bins. Red curve is a Poisson curve with rate = median count rate of data. |
 |
 |
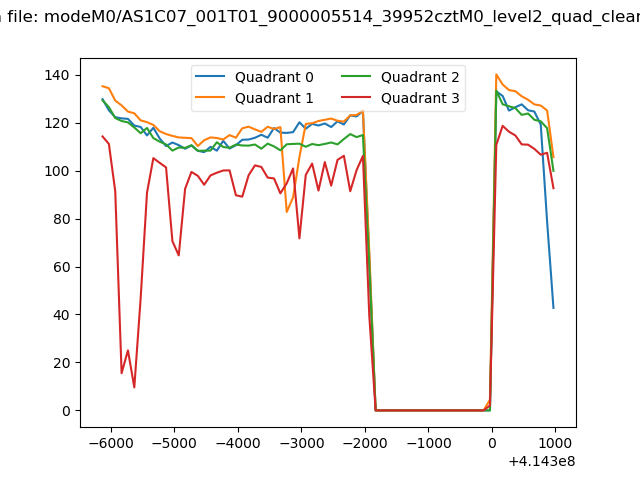
| Quadrant-wise count rates Data is divided into 100 sec bins |
 |
|
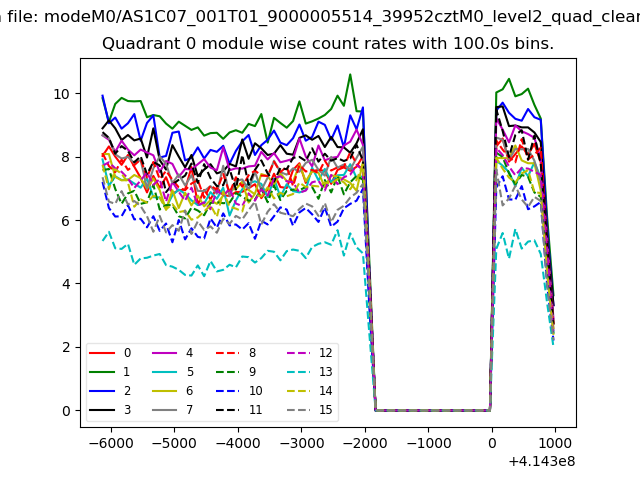
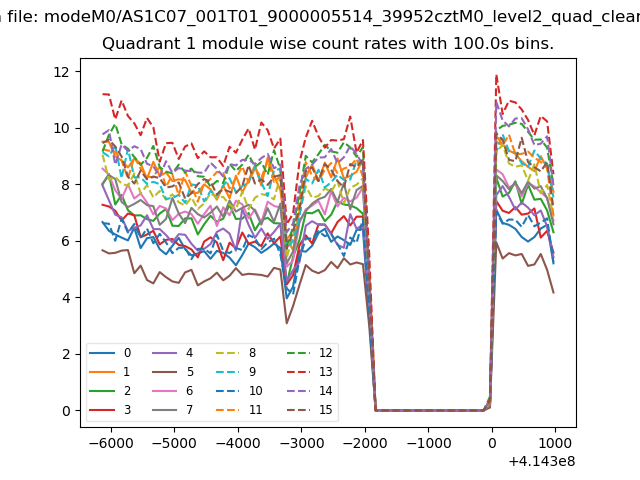
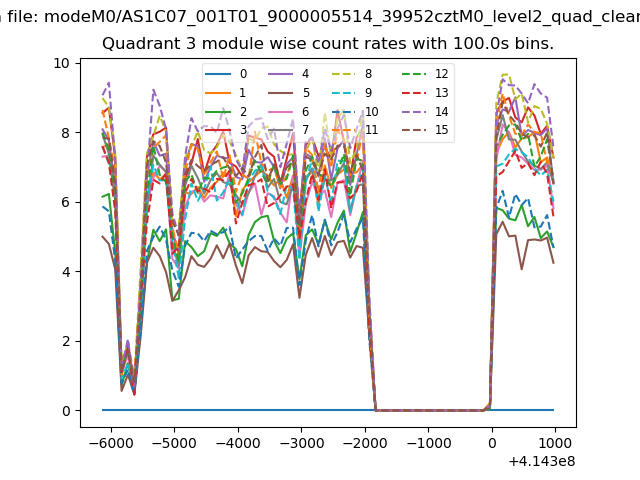
| Module-wise count rates for Quadrant A Data is divided into 100 sec bins |
 |
 |
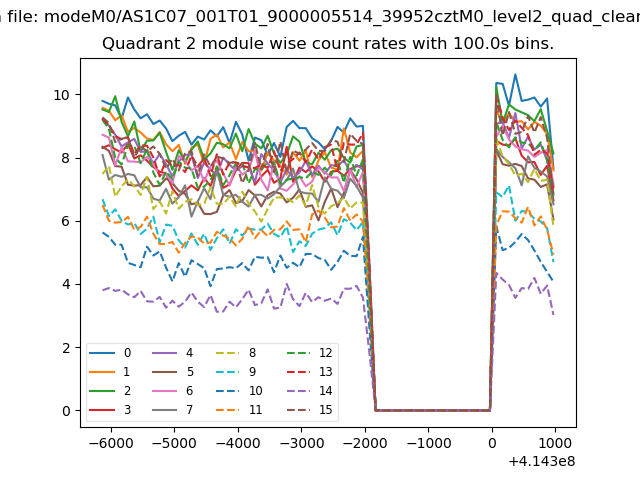
| Module-wise count rates for Quadrant B Data is divided into 100 sec bins |
 |
 |
| Module-wise count rates for Quadrant C Data is divided into 100 sec bins |
 |
 |
| Module-wise count rates for Quadrant D Data is divided into 100 sec bins |
 |
 |
| Parameter | Plot |
|---|---|
| CZT HV Monitor | 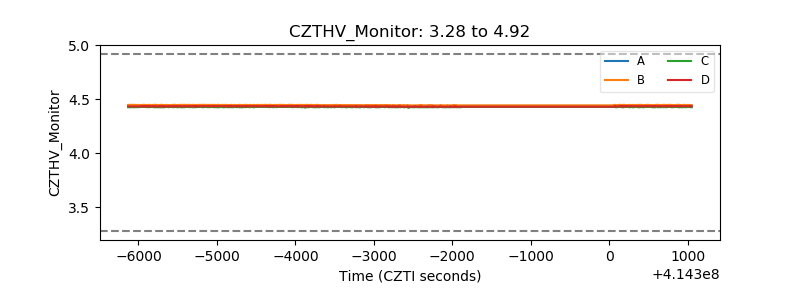 |
| D_VDD | 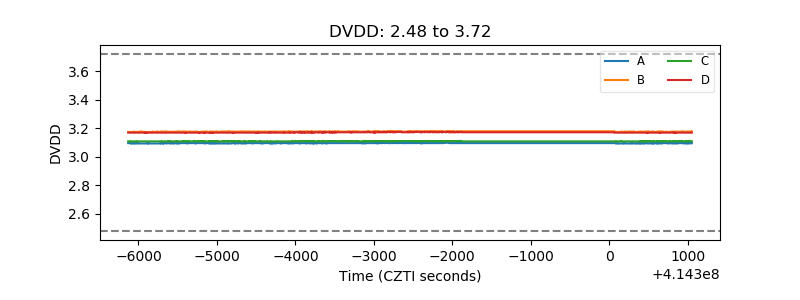 |
| Temperature 1 | 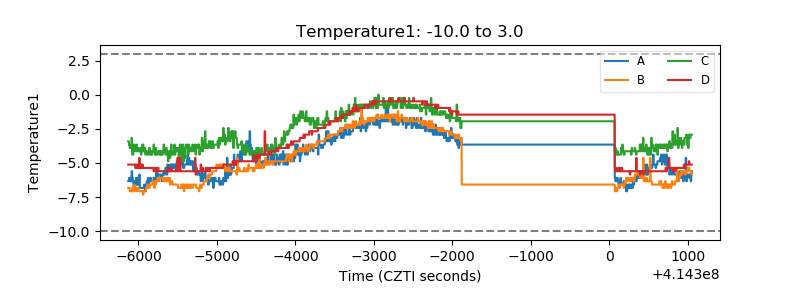 |
| Veto HV Monitor | 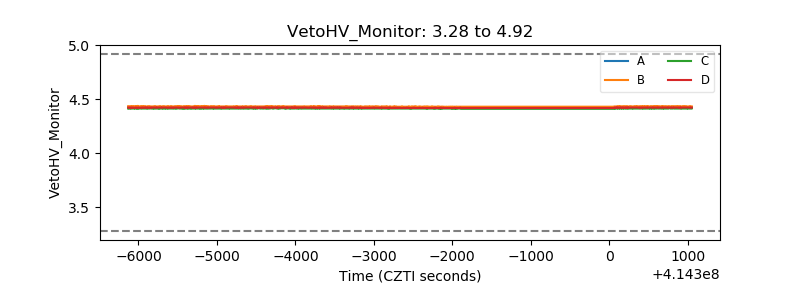 |
| Veto LLD | 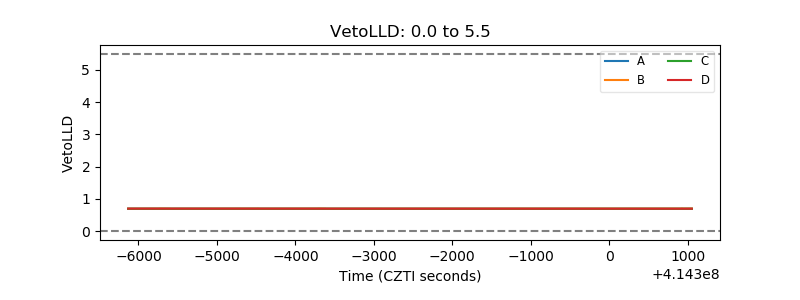 |
| Alpha Counter | 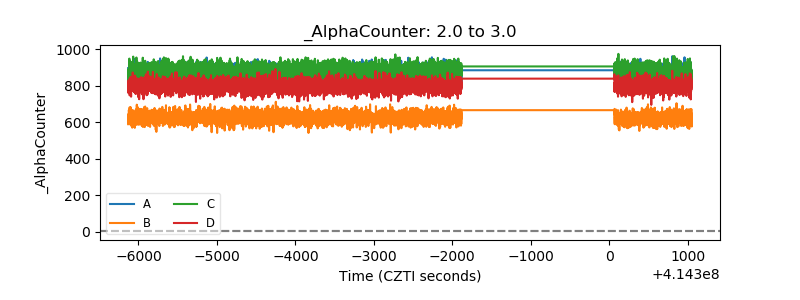 |
| _CPM_Rate | 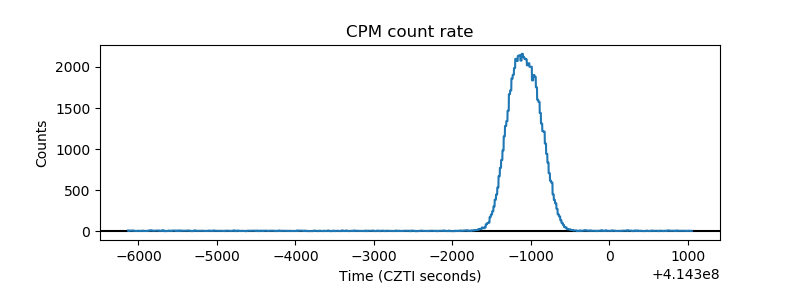 |
| CZT Counter |  |
| +2.5 Volts monitor |  |
| +5 Volts monitor | 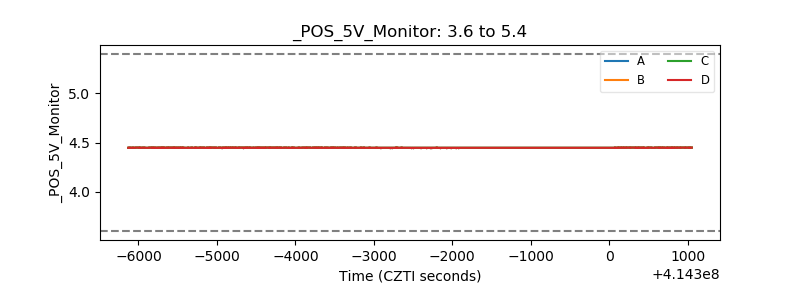 |
| _ROLL_ROT | 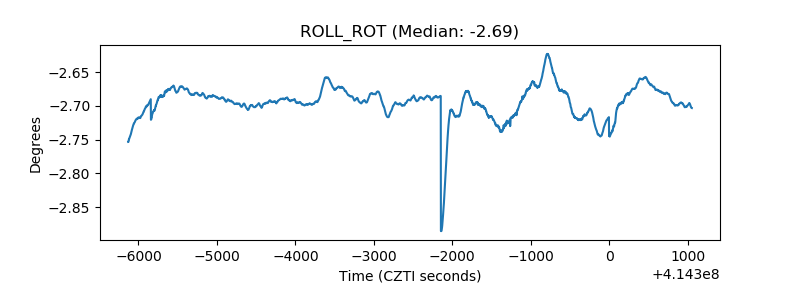 |
| _Roll_DEC | 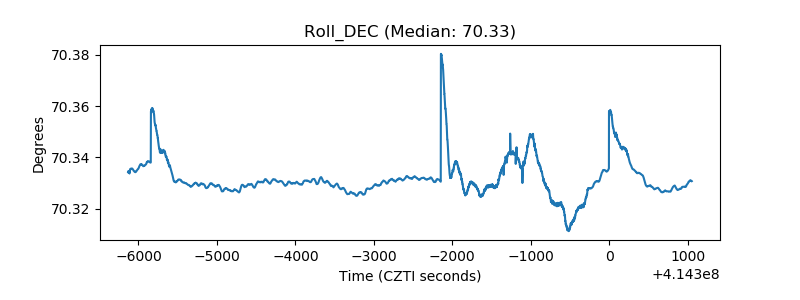 |
| _Roll_RA | 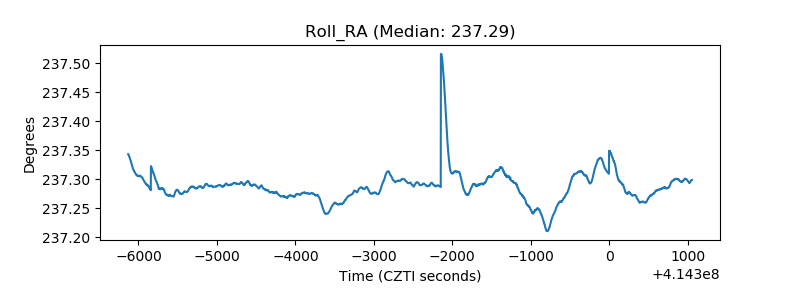 |
| Veto Counter | 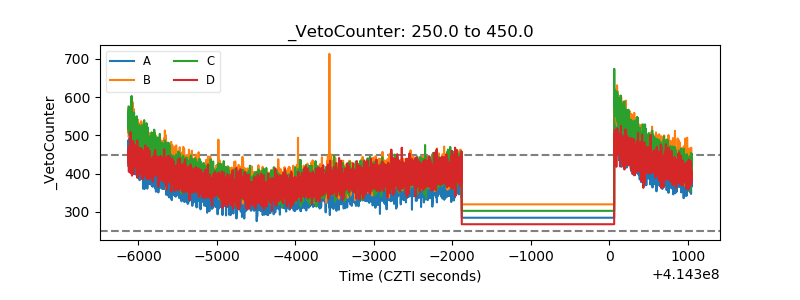 |