| Param | Original file | Final file |
|---|---|---|
| Filename | modeM0/AS1C07_001T01_9000005514_39955cztM0_level2.fits | modeM0/AS1C07_001T01_9000005514_39955cztM0_level2_quad_clean.evt |
| Size (bytes) | 798,482,880 | 217,848,960 |
| Size | 761.5 MB | 207.8 MB |
| Events in quadrant A | 7,525,358 | 1,494,292 |
| Events in quadrant B | 6,781,785 | 1,487,748 |
| Events in quadrant C | 6,063,916 | 1,439,350 |
| Events in quadrant D | 8,195,583 | 1,292,214 |
| Mode SS | |||
|---|---|---|---|
| Quadrant | BADHDUFLAG | Total packets | Discarded packets |
| A | 0 | 262 | 0 |
| B | 0 | 262 | 0 |
| C | 0 | 262 | 0 |
| D | 0 | 262 | 0 |
| Mode M9 | |||
|---|---|---|---|
| Quadrant | BADHDUFLAG | Total packets | Discarded packets |
| A | 0 | 63 | 0 |
| B | 0 | 63 | 0 |
| C | 0 | 63 | 0 |
| D | 0 | 63 | 0 |
| Mode M0 | |||
|---|---|---|---|
| Quadrant | BADHDUFLAG | Total packets | Discarded packets |
| A | 0 | 30017 | 4 |
| B | 0 | 29000 | 5 |
| C | 0 | 26287 | 3 |
| D | 0 | 33207 | 3 |
| Quadrant | Total seconds | Saturated seconds | Saturation percentage |
|---|---|---|---|
| A | 12775 | 248 | 1.941292% |
| B | 12774 | 445 | 3.483639% |
| C | 12775 | 30 | 0.234834% |
| D | 12775 | 474 | 3.710372% |
Noise dominated data is calculated using 1-second bins in cleaned event files. If a bin has >2000 counts, and if more than 50% of those come from <1% of pixels, then it is considered to be noise-dominated and hence unusable.
| Quadrant | # 1 sec bins | Bins with >0 counts | Bins with >2000 counts | High rate bins dominated by noise | Noise dominated (total time) | Noise dominated (detector-on time) | Marked lightcurve |
|---|---|---|---|---|---|---|---|
| A | 19084 | 12778 | 227 | 227 | 1.19% | 1.78% | 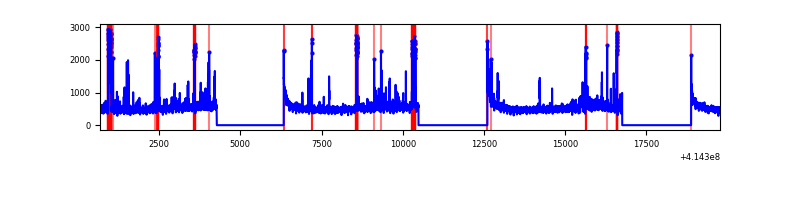 |
| B | 19083 | 12777 | 372 | 372 | 1.95% | 2.91% | 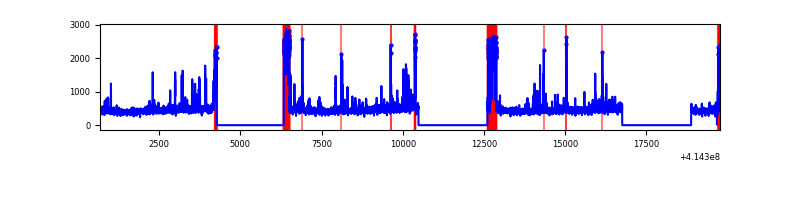 |
| C | 19084 | 12778 | 24 | 24 | 0.13% | 0.19% | 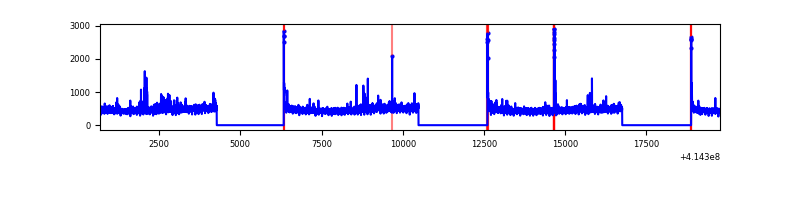 |
| D | 19084 | 12777 | 461 | 461 | 2.42% | 3.61% | 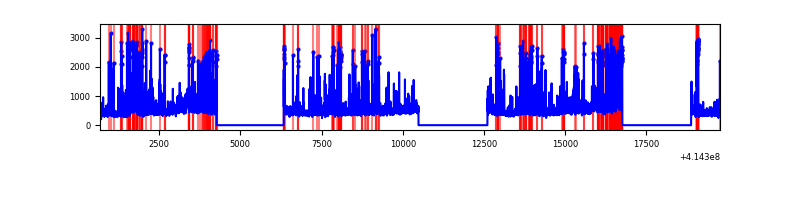 |
Top three noisy pixels from each quadrant. If the there are fewer than three noisy pixels in the level2.evt file, extra rows are filled as -1
| Pixel properties | Quadrant properties | ||||||
|---|---|---|---|---|---|---|---|
| Quadrant | DetID | PixID | Counts | Sigma | Mean | Median | Sigma |
| A | 10 | 83 | 967618 | 3443.03 | 1410 | 1385 | 280.6 |
| A | 6 | 10 | 512890 | 1822.67 | 1410 | 1385 | 280.6 |
| A | 13 | 248 | 254748 | 902.82 | 1410 | 1385 | 280.6 |
| B | 4 | 171 | 650162 | 2508.59 | 1375 | 1339 | 258.6 |
| B | 5 | 255 | 553910 | 2136.44 | 1375 | 1339 | 258.6 |
| B | 0 | 230 | 63605 | 240.74 | 1375 | 1339 | 258.6 |
| C | 15 | 214 | 525872 | 1704.71 | 1350 | 1356 | 307.7 |
| C | 0 | 10 | 84533 | 270.33 | 1350 | 1356 | 307.7 |
| C | 9 | 54 | 81844 | 261.59 | 1350 | 1356 | 307.7 |
| D | 2 | 249 | 993685 | 3040.95 | 1344 | 1302 | 326.3 |
| D | 12 | 227 | 704935 | 2156.14 | 1344 | 1302 | 326.3 |
| D | 12 | 233 | 298080 | 909.41 | 1344 | 1302 | 326.3 |
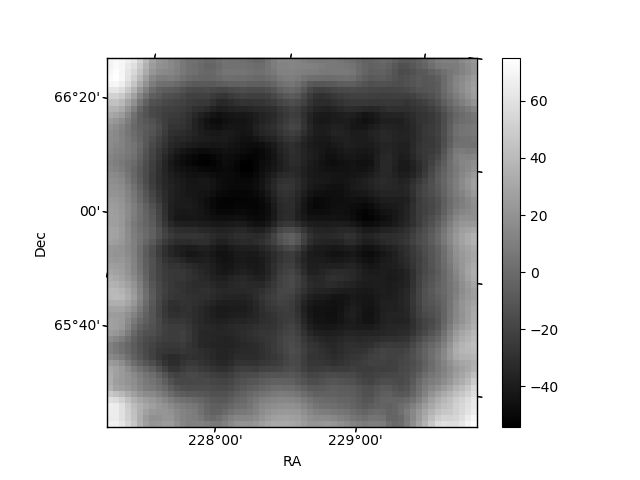
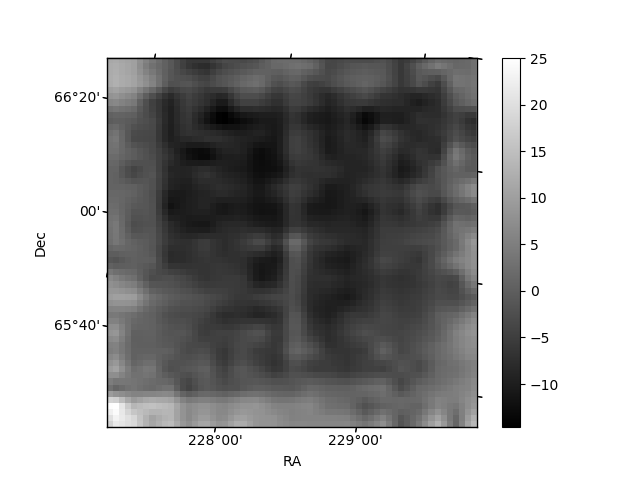
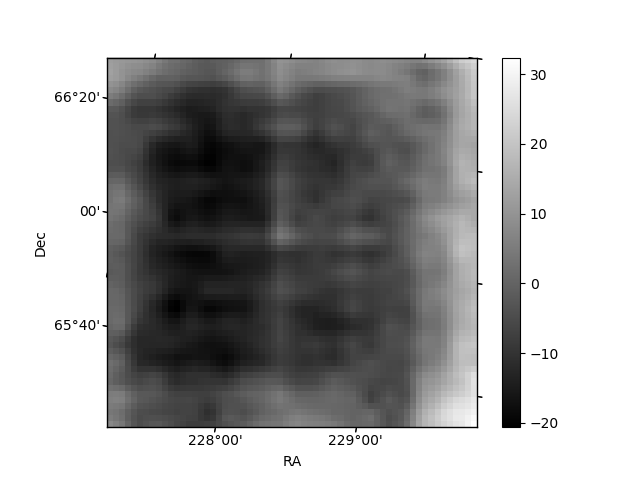
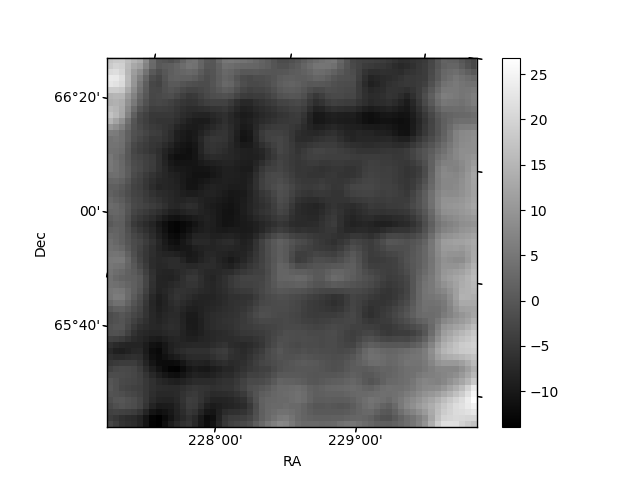
Histogram calculated using DETX and DETY for each event in the final _common_clean file
| Quadrant A | 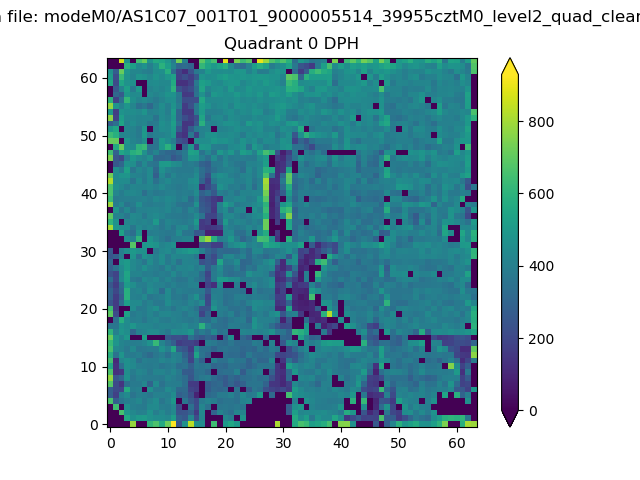 |
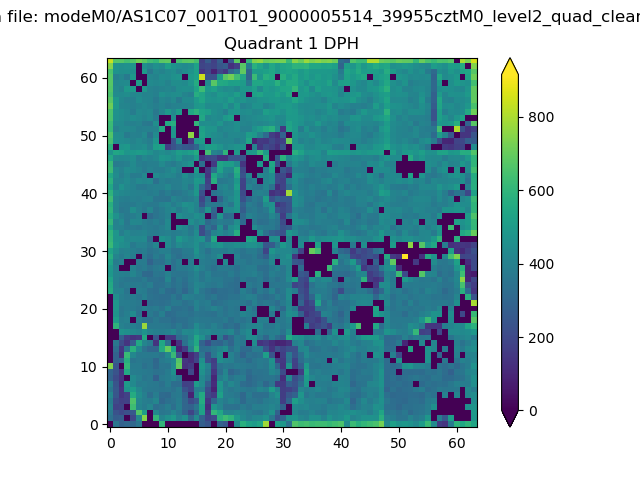 |
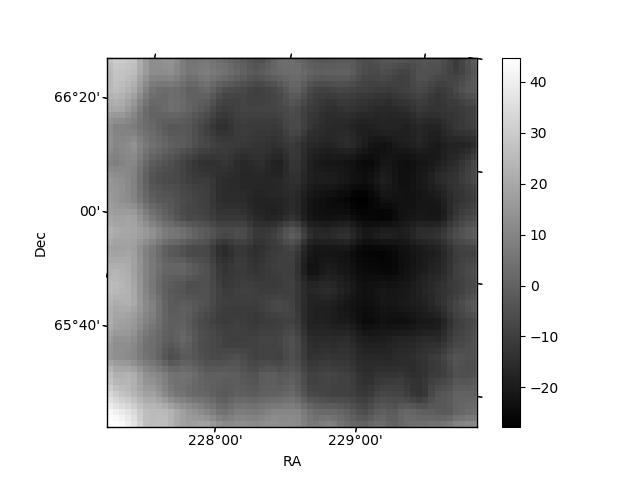
Quadrant B |
|---|---|---|---|
| Quadrant D | 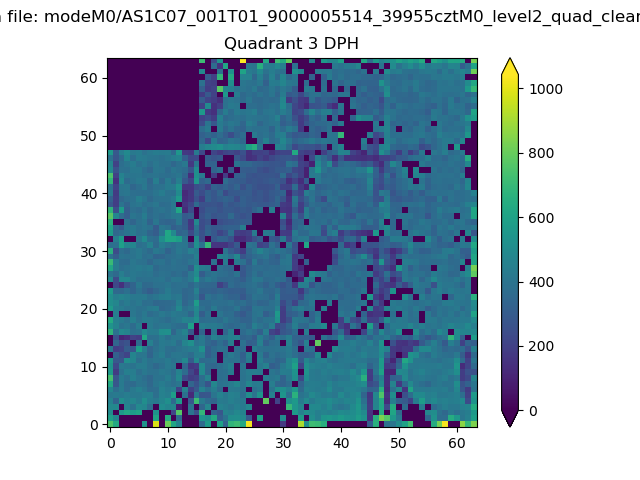 |
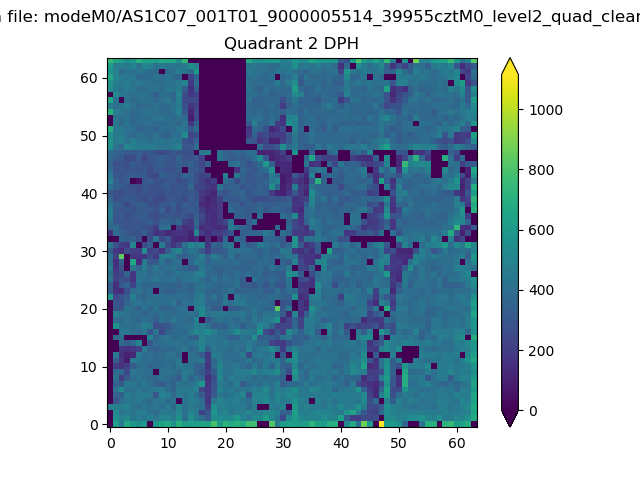 |
Quadrant C |
| Plot type | Count rate plots | Images |
|---|---|---|
| Comparison with Poisson distribution Blue bars denote a histogram of data divided into 1 sec bins. Red curve is a Poisson curve with rate = median count rate of data. |
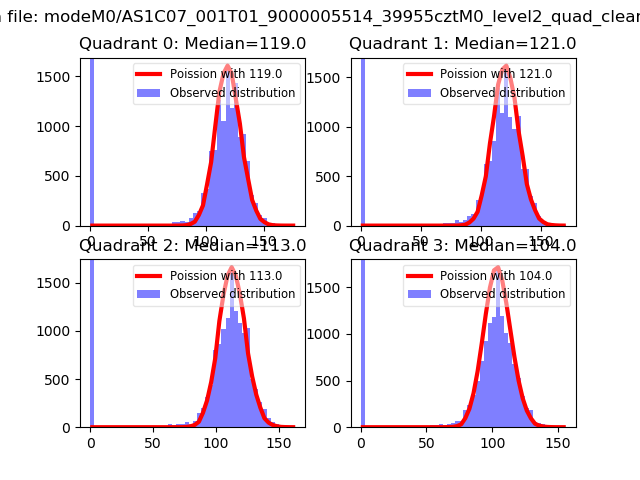 |
 |
| Quadrant-wise count rates Data is divided into 100 sec bins |
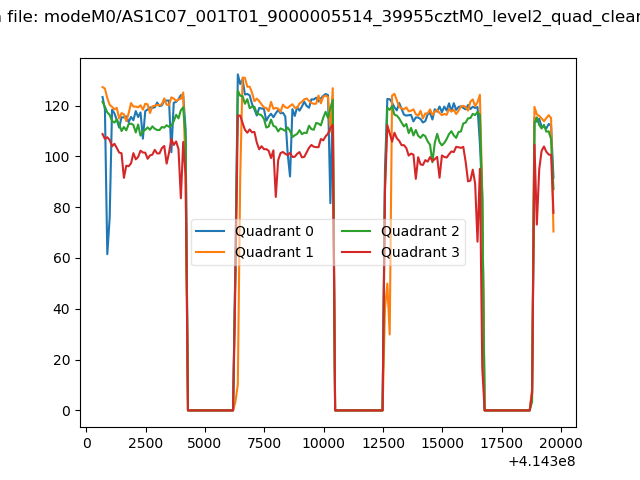 |
|
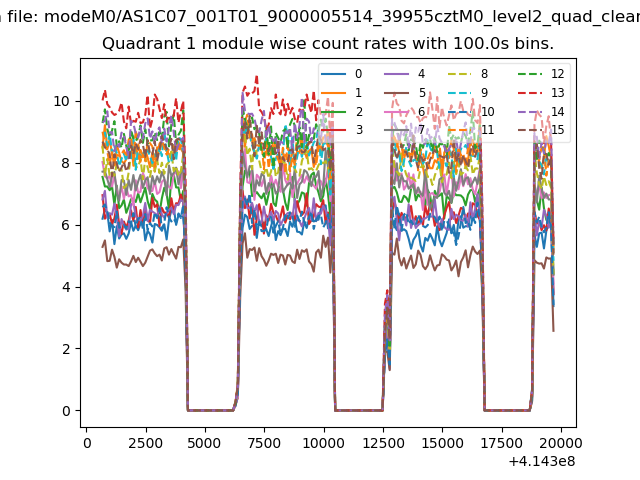
| Module-wise count rates for Quadrant A Data is divided into 100 sec bins |
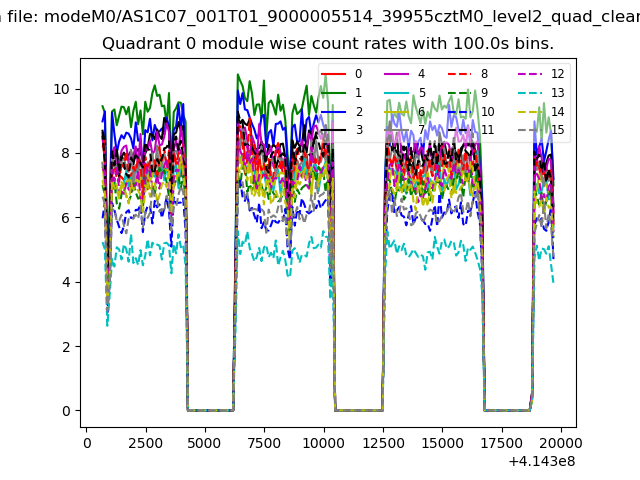 |
 |
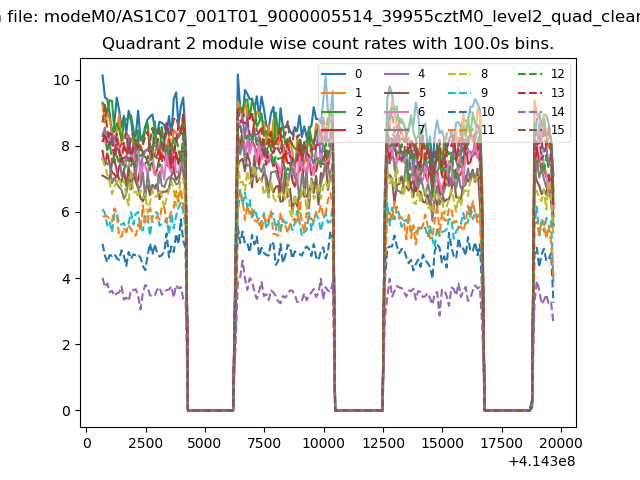
| Module-wise count rates for Quadrant B Data is divided into 100 sec bins |
 |
 |
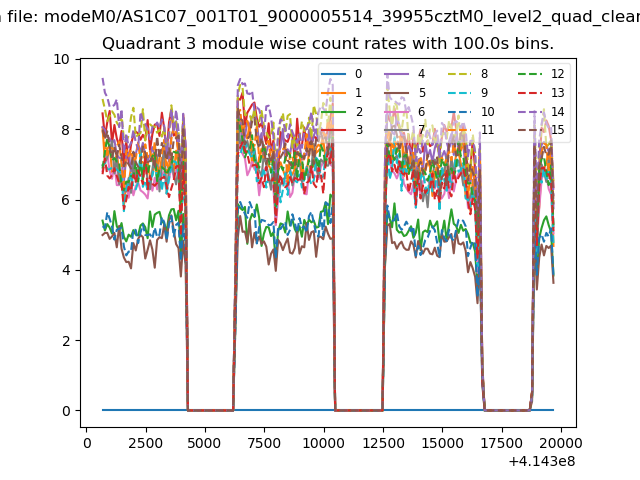
| Module-wise count rates for Quadrant C Data is divided into 100 sec bins |
 |
 |
| Module-wise count rates for Quadrant D Data is divided into 100 sec bins |
 |
 |
| Parameter | Plot |
|---|---|
| CZT HV Monitor | 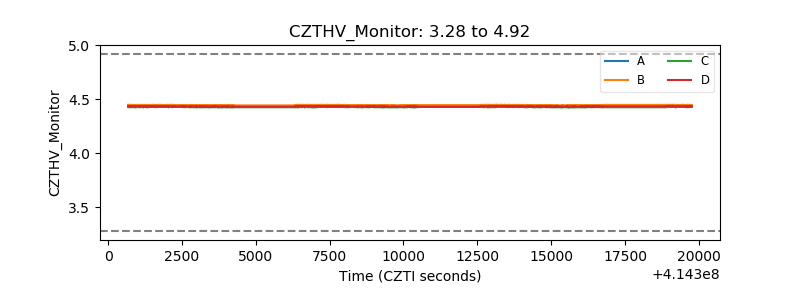 |
| D_VDD | 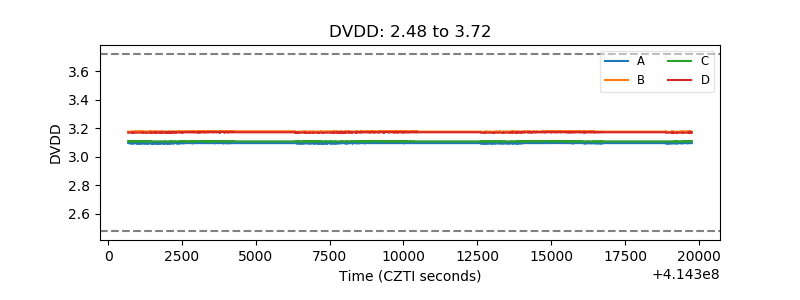 |
| Temperature 1 | 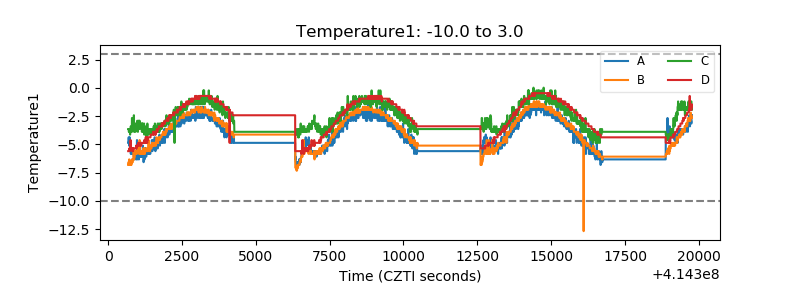 |
| Veto HV Monitor | 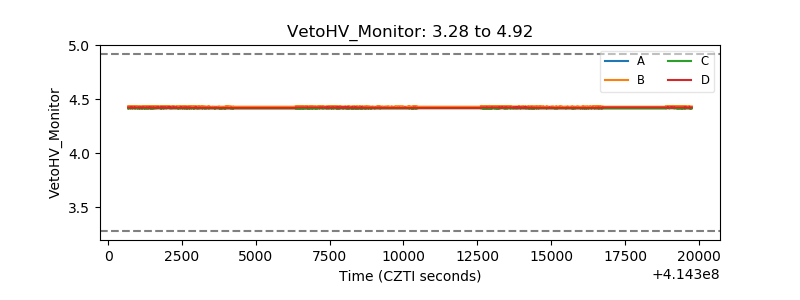 |
| Veto LLD | 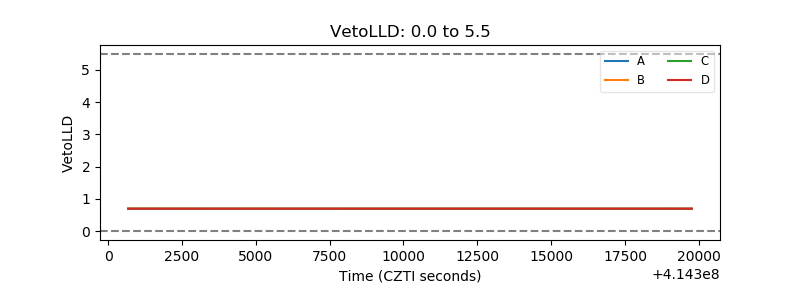 |
| Alpha Counter | 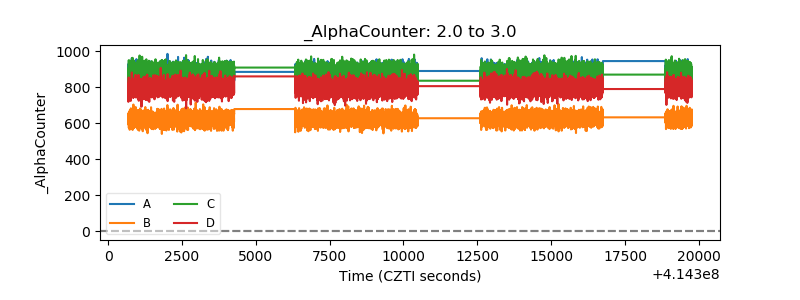 |
| _CPM_Rate | 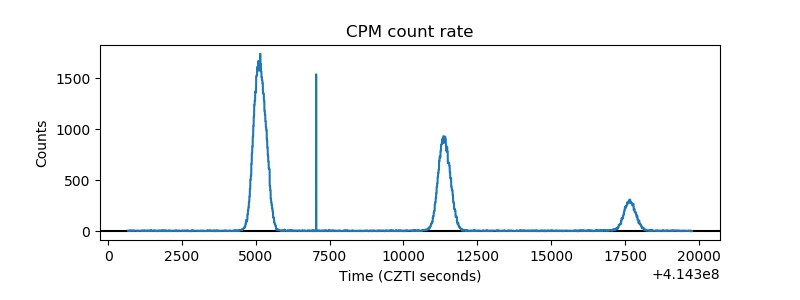 |
| CZT Counter | 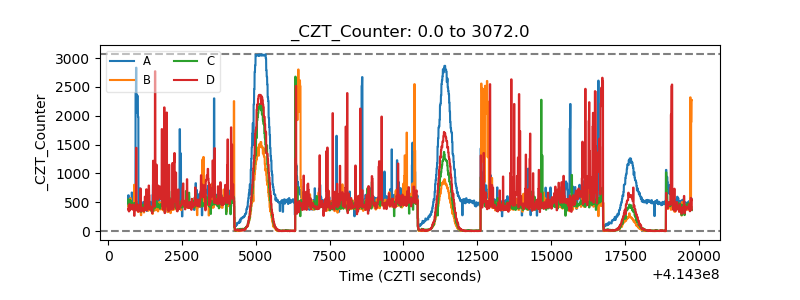 |
| +2.5 Volts monitor | 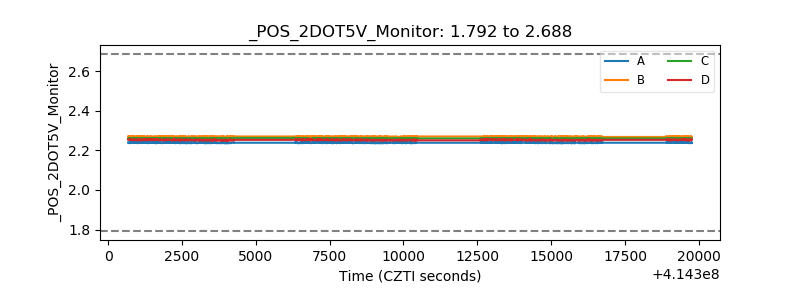 |
| +5 Volts monitor | 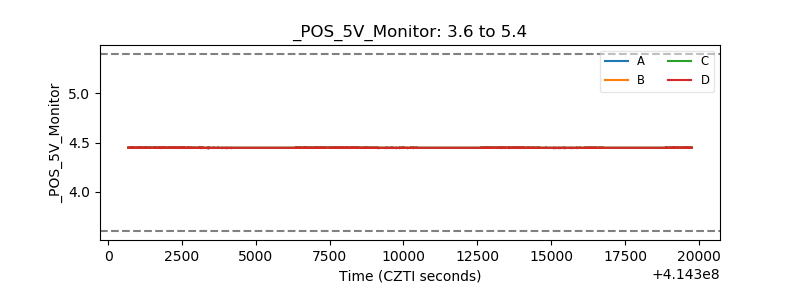 |
| _ROLL_ROT | 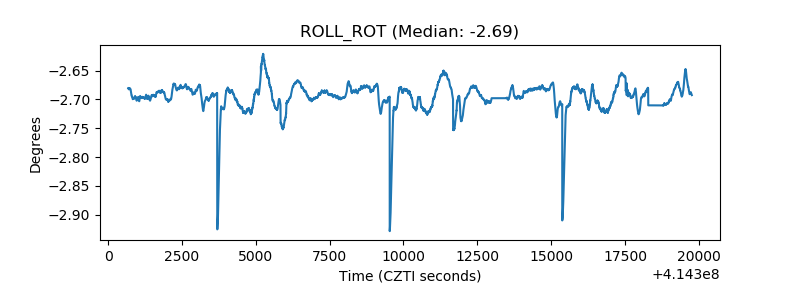 |
| _Roll_DEC | 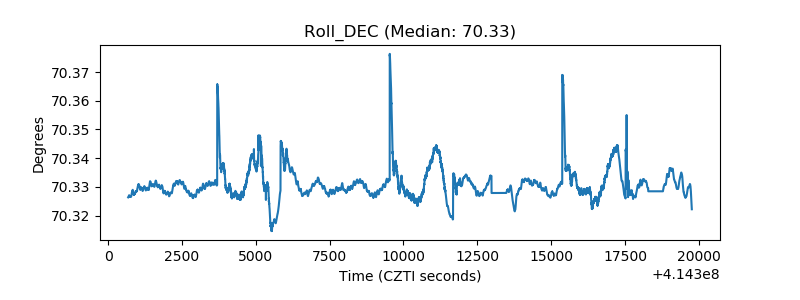 |
| _Roll_RA | 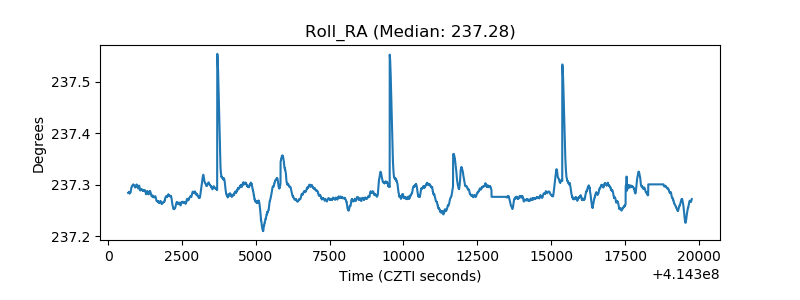 |
| Veto Counter | 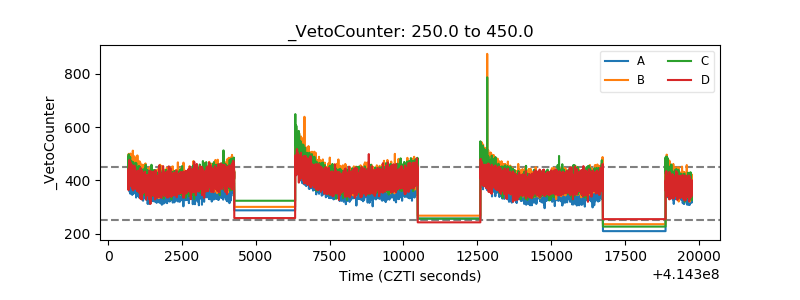 |