| Param | Original file | Final file |
|---|---|---|
| Filename | modeM0/AS1C07_001T01_9000005514_39956cztM0_level2.fits | modeM0/AS1C07_001T01_9000005514_39956cztM0_level2_quad_clean.evt |
| Size (bytes) | 317,736,000 | 84,600,000 |
| Size | 303.0 MB | 80.7 MB |
| Events in quadrant A | 2,723,341 | 579,238 |
| Events in quadrant B | 2,568,228 | 581,221 |
| Events in quadrant C | 2,398,935 | 547,825 |
| Events in quadrant D | 3,673,376 | 495,806 |
| Mode SS | |||
|---|---|---|---|
| Quadrant | BADHDUFLAG | Total packets | Discarded packets |
| A | 0 | 104 | 0 |
| B | 0 | 104 | 0 |
| C | 0 | 104 | 0 |
| D | 0 | 104 | 0 |
| Mode M9 | |||
|---|---|---|---|
| Quadrant | BADHDUFLAG | Total packets | Discarded packets |
| A | 0 | 20 | 0 |
| B | 0 | 20 | 0 |
| C | 0 | 20 | 0 |
| D | 0 | 21 | 0 |
| Mode M0 | |||
|---|---|---|---|
| Quadrant | BADHDUFLAG | Total packets | Discarded packets |
| A | 0 | 11145 | 2 |
| B | 0 | 11215 | 1 |
| C | 0 | 10485 | 1 |
| D | 0 | 14487 | 1 |
| Quadrant | Total seconds | Saturated seconds | Saturation percentage |
|---|---|---|---|
| A | 5102 | 15 | 0.294002% |
| B | 5102 | 67 | 1.313211% |
| C | 5102 | 12 | 0.235202% |
| D | 5102 | 207 | 4.057232% |
Noise dominated data is calculated using 1-second bins in cleaned event files. If a bin has >2000 counts, and if more than 50% of those come from <1% of pixels, then it is considered to be noise-dominated and hence unusable.
| Quadrant | # 1 sec bins | Bins with >0 counts | Bins with >2000 counts | High rate bins dominated by noise | Noise dominated (total time) | Noise dominated (detector-on time) | Marked lightcurve |
|---|---|---|---|---|---|---|---|
| A | 7075 | 5103 | 5 | 5 | 0.07% | 0.10% | 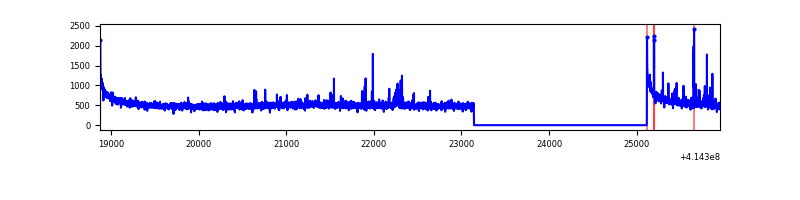 |
| B | 7075 | 5103 | 44 | 44 | 0.62% | 0.86% | 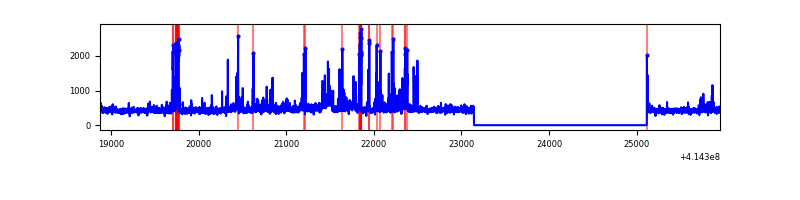 |
| C | 7075 | 5103 | 10 | 10 | 0.14% | 0.20% | 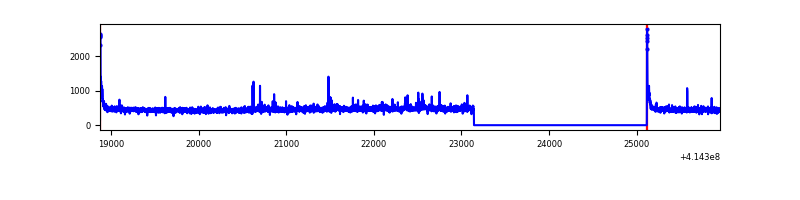 |
| D | 7075 | 5103 | 205 | 205 | 2.90% | 4.02% | 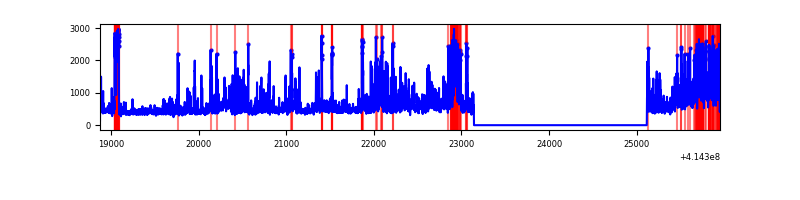 |
Top three noisy pixels from each quadrant. If the there are fewer than three noisy pixels in the level2.evt file, extra rows are filled as -1
| Pixel properties | Quadrant properties | ||||||
|---|---|---|---|---|---|---|---|
| Quadrant | DetID | PixID | Counts | Sigma | Mean | Median | Sigma |
| A | 10 | 83 | 474534 | 4224.54 | 552 | 541 | 112.2 |
| A | 6 | 10 | 66122 | 584.5 | 552 | 541 | 112.2 |
| A | 7 | 3 | 16887 | 145.69 | 552 | 541 | 112.2 |
| B | 4 | 171 | 152787 | 1473.54 | 541 | 525 | 103.3 |
| B | 5 | 32 | 100794 | 970.37 | 541 | 525 | 103.3 |
| B | 0 | 230 | 48262 | 461.98 | 541 | 525 | 103.3 |
| C | 15 | 214 | 217940 | 1777.17 | 530 | 533 | 122.3 |
| C | 0 | 10 | 60704 | 491.86 | 530 | 533 | 122.3 |
| C | 9 | 54 | 11683 | 91.14 | 530 | 533 | 122.3 |
| D | 2 | 249 | 620860 | 4776.97 | 526 | 509 | 129.9 |
| D | 12 | 227 | 456429 | 3510.78 | 526 | 509 | 129.9 |
| D | 12 | 218 | 154099 | 1182.71 | 526 | 509 | 129.9 |
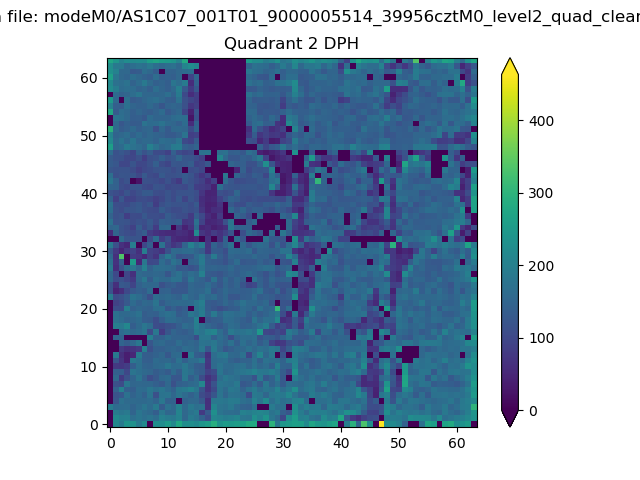
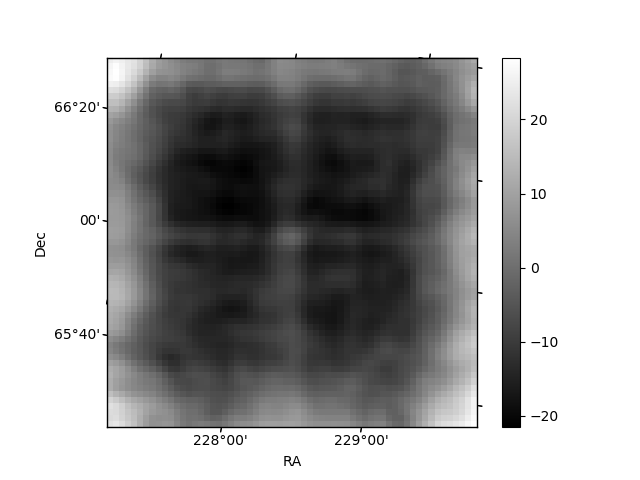
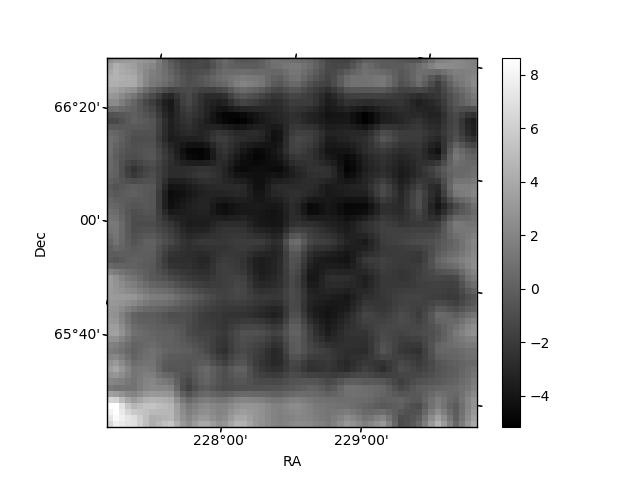
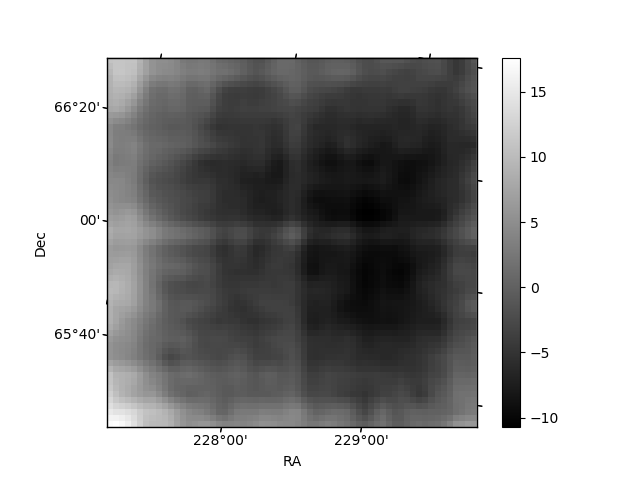
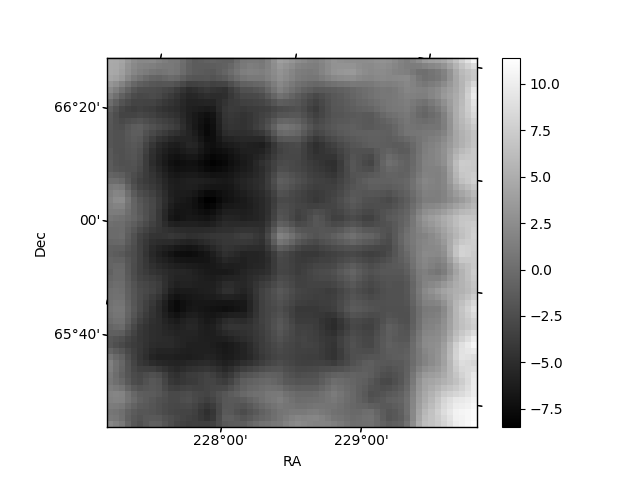
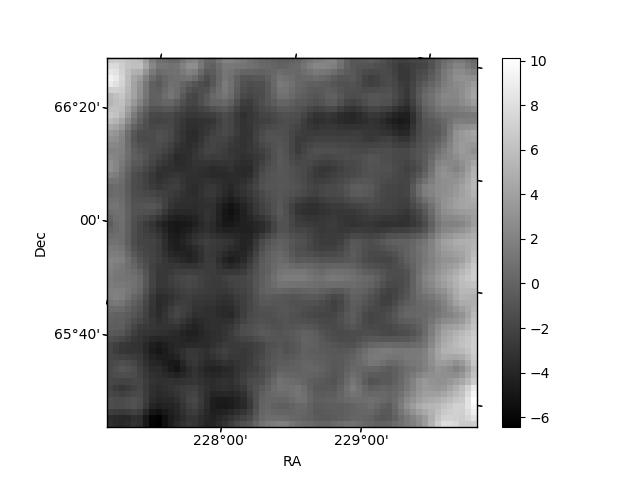
Histogram calculated using DETX and DETY for each event in the final _common_clean file
| Quadrant A | 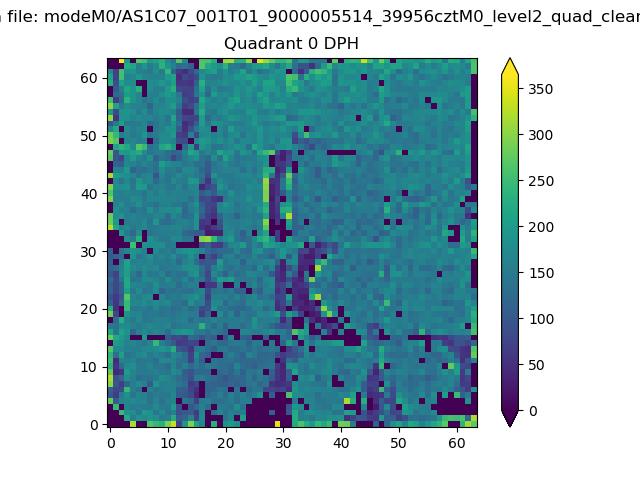 |
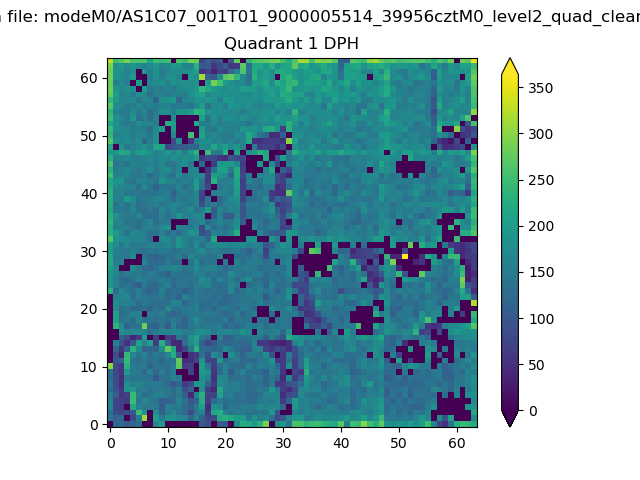 |
Quadrant B |
|---|---|---|---|
| Quadrant D | 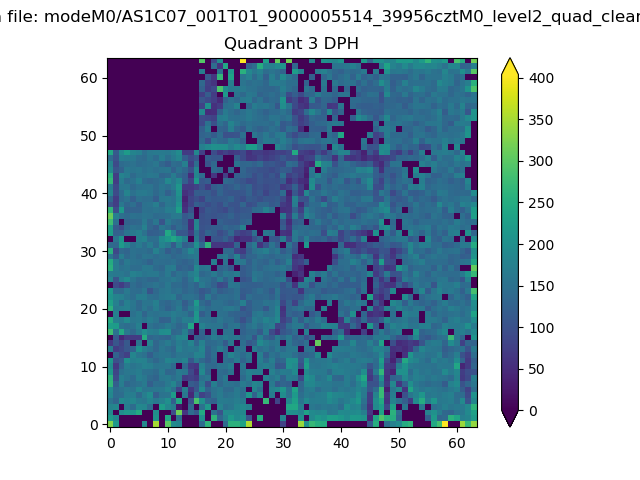 |
 |
Quadrant C |
| Plot type | Count rate plots | Images |
|---|---|---|
| Comparison with Poisson distribution Blue bars denote a histogram of data divided into 1 sec bins. Red curve is a Poisson curve with rate = median count rate of data. |
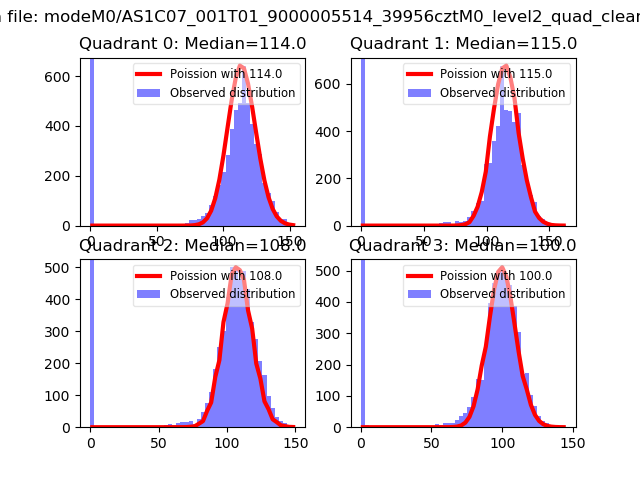 |
 |
| Quadrant-wise count rates Data is divided into 100 sec bins |
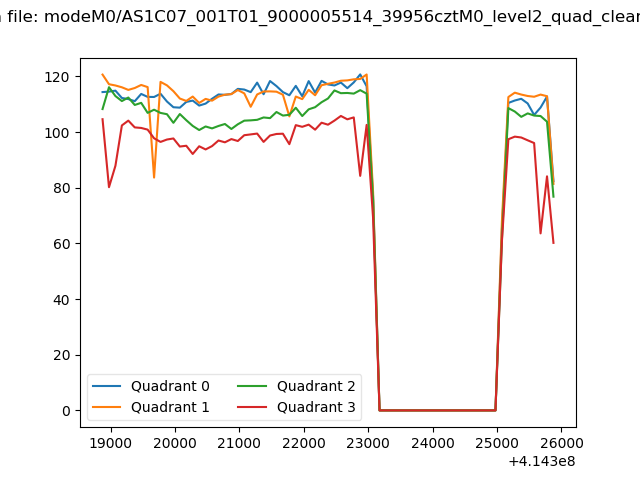 |
|
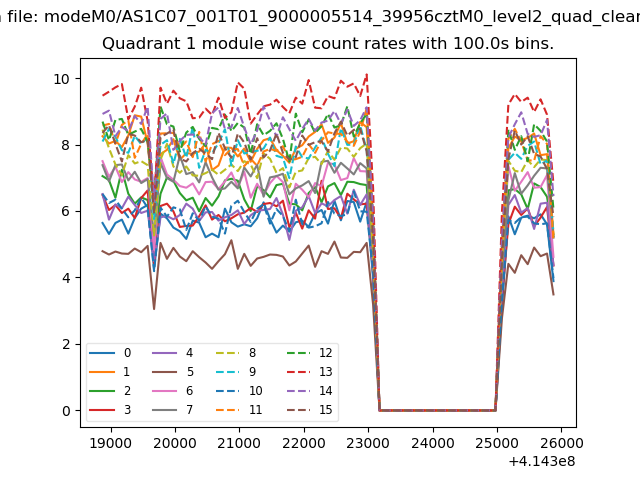
| Module-wise count rates for Quadrant A Data is divided into 100 sec bins |
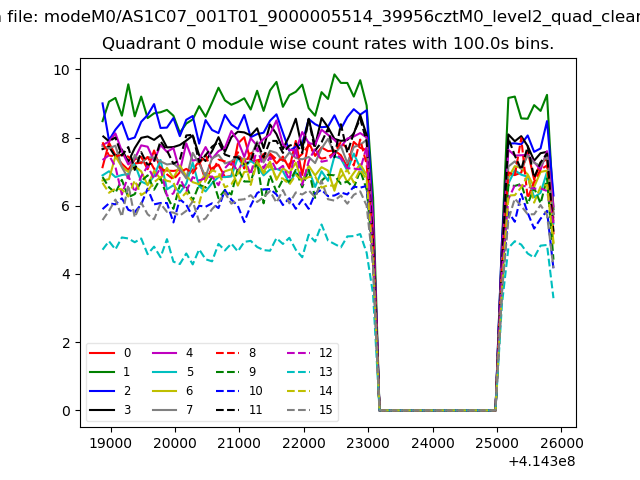 |
 |
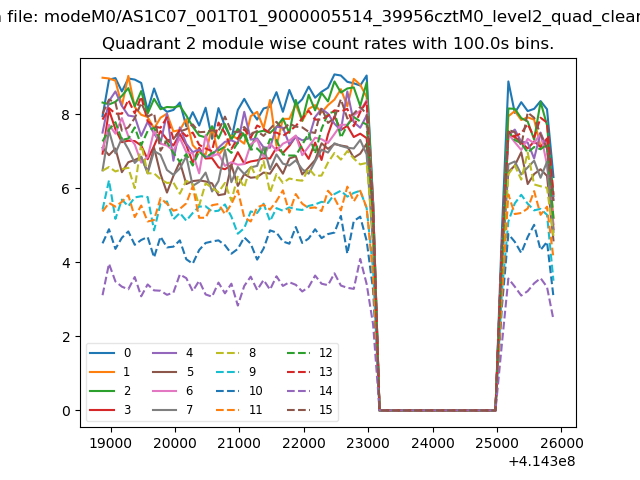
| Module-wise count rates for Quadrant B Data is divided into 100 sec bins |
 |
 |
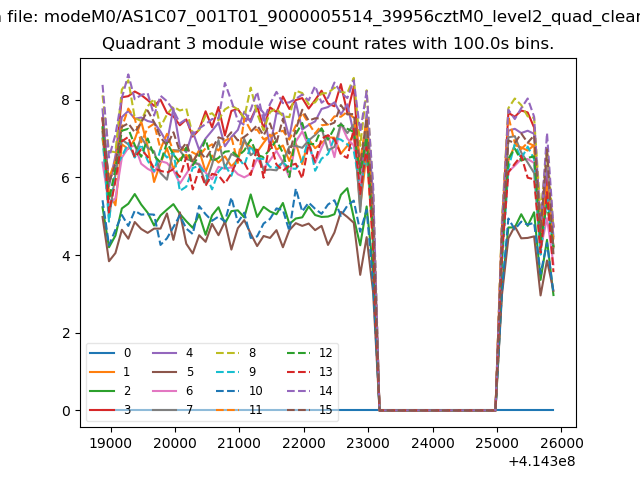
| Module-wise count rates for Quadrant C Data is divided into 100 sec bins |
 |
 |
| Module-wise count rates for Quadrant D Data is divided into 100 sec bins |
 |
 |
| Parameter | Plot |
|---|---|
| CZT HV Monitor | 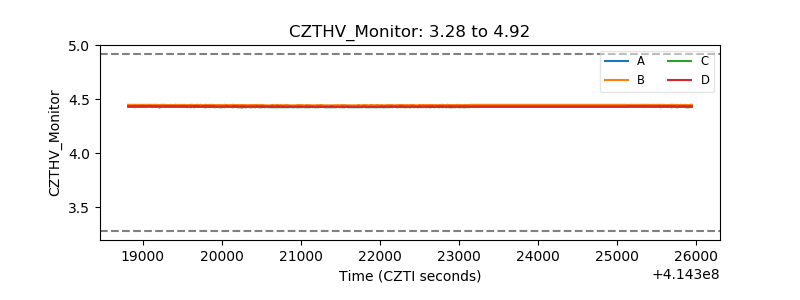 |
| D_VDD | 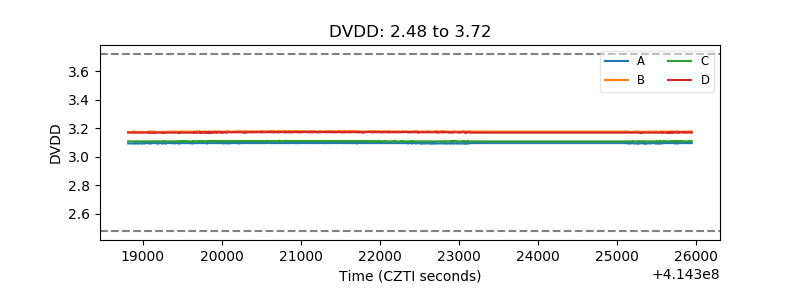 |
| Temperature 1 | 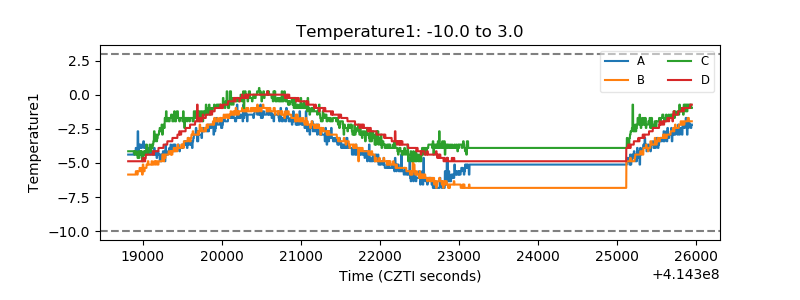 |
| Veto HV Monitor | 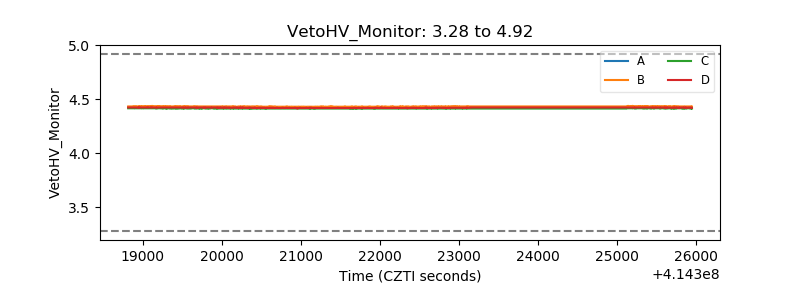 |
| Veto LLD | 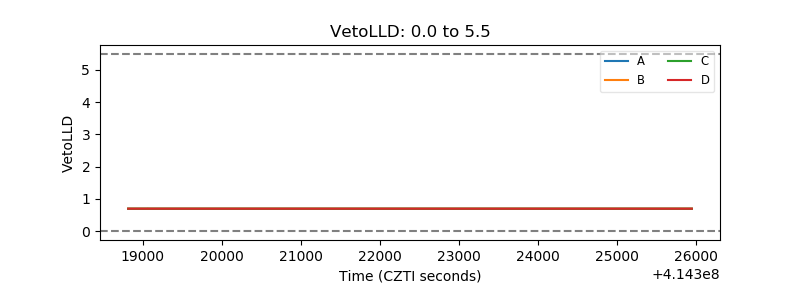 |
| Alpha Counter | 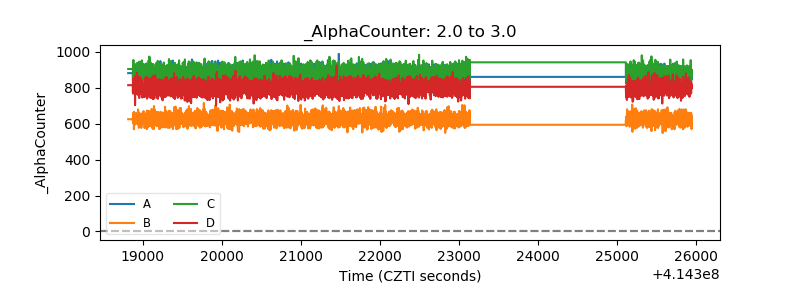 |
| _CPM_Rate | 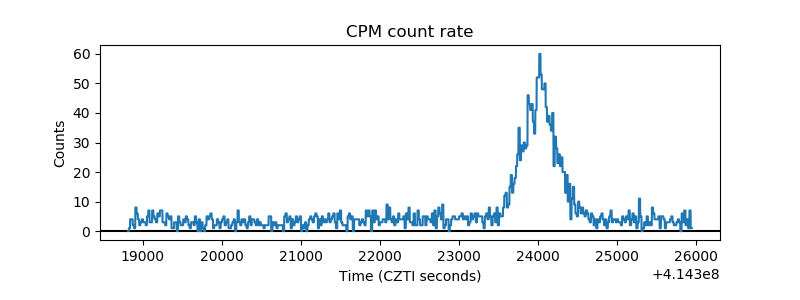 |
| CZT Counter | 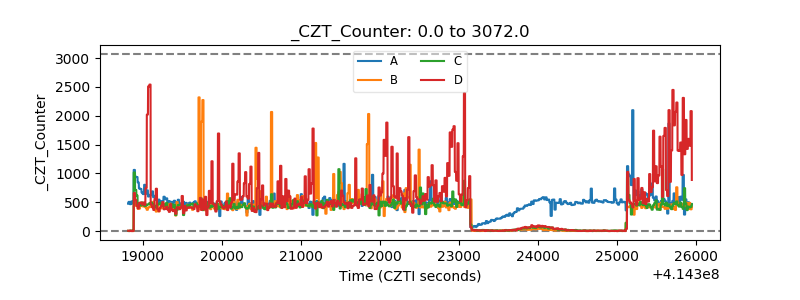 |
| +2.5 Volts monitor | 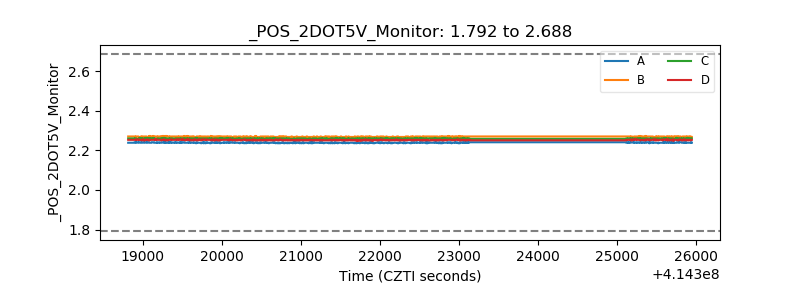 |
| +5 Volts monitor | 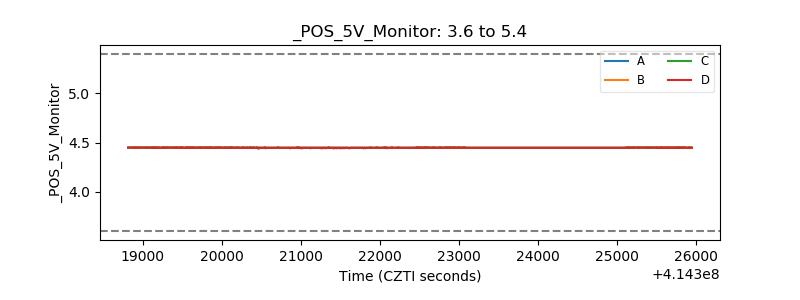 |
| _ROLL_ROT | 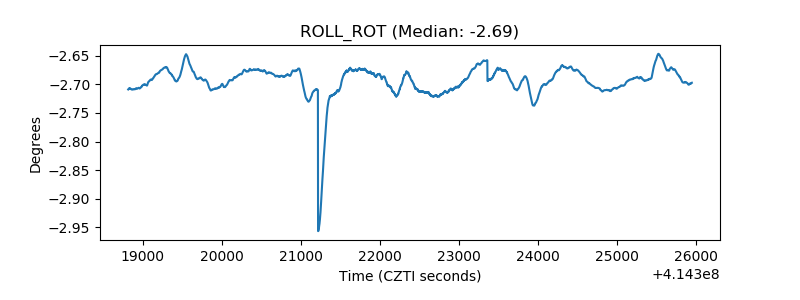 |
| _Roll_DEC | 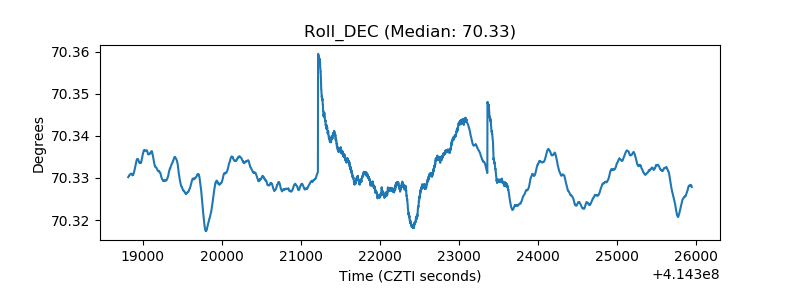 |
| _Roll_RA | 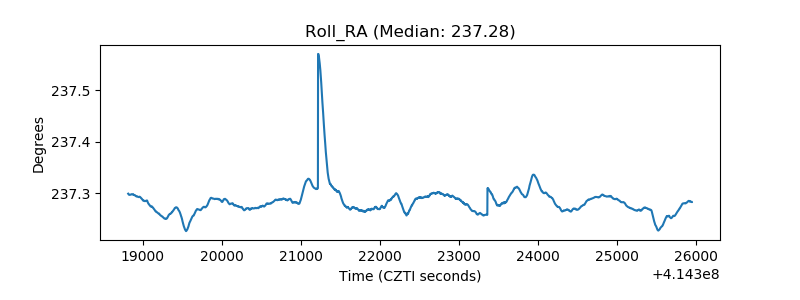 |
| Veto Counter | 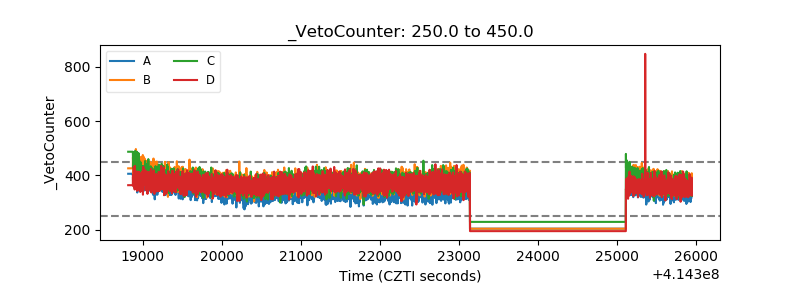 |