| Param | Original file | Final file |
|---|---|---|
| Filename | modeM0/AS1C07_001T01_9000005514_39957cztM0_level2.fits | modeM0/AS1C07_001T01_9000005514_39957cztM0_level2_quad_clean.evt |
| Size (bytes) | 381,015,360 | 87,707,520 |
| Size | 363.4 MB | 83.6 MB |
| Events in quadrant A | 3,093,780 | 602,192 |
| Events in quadrant B | 2,777,555 | 606,233 |
| Events in quadrant C | 2,583,240 | 574,102 |
| Events in quadrant D | 5,224,224 | 490,999 |
| Mode SS | |||
|---|---|---|---|
| Quadrant | BADHDUFLAG | Total packets | Discarded packets |
| A | 0 | 110 | 0 |
| B | 0 | 110 | 0 |
| C | 0 | 110 | 0 |
| D | 0 | 110 | 0 |
| Mode M9 | |||
|---|---|---|---|
| Quadrant | BADHDUFLAG | Total packets | Discarded packets |
| A | 0 | 17 | 0 |
| B | 0 | 17 | 0 |
| C | 0 | 17 | 0 |
| D | 0 | 17 | 0 |
| Mode M0 | |||
|---|---|---|---|
| Quadrant | BADHDUFLAG | Total packets | Discarded packets |
| A | 0 | 12591 | 2 |
| B | 0 | 12137 | 1 |
| C | 0 | 11220 | 1 |
| D | 0 | 19295 | 1 |
| Quadrant | Total seconds | Saturated seconds | Saturation percentage |
|---|---|---|---|
| A | 5462 | 50 | 0.915416% |
| B | 5462 | 91 | 1.666056% |
| C | 5462 | 12 | 0.219700% |
| D | 5462 | 562 | 10.289271% |
Noise dominated data is calculated using 1-second bins in cleaned event files. If a bin has >2000 counts, and if more than 50% of those come from <1% of pixels, then it is considered to be noise-dominated and hence unusable.
| Quadrant | # 1 sec bins | Bins with >0 counts | Bins with >2000 counts | High rate bins dominated by noise | Noise dominated (total time) | Noise dominated (detector-on time) | Marked lightcurve |
|---|---|---|---|---|---|---|---|
| A | 7136 | 5463 | 39 | 39 | 0.55% | 0.71% | 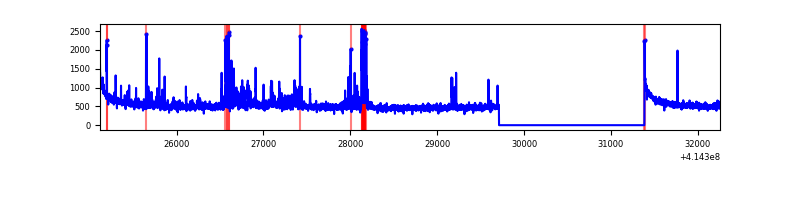 |
| B | 7136 | 5463 | 71 | 71 | 0.99% | 1.30% | 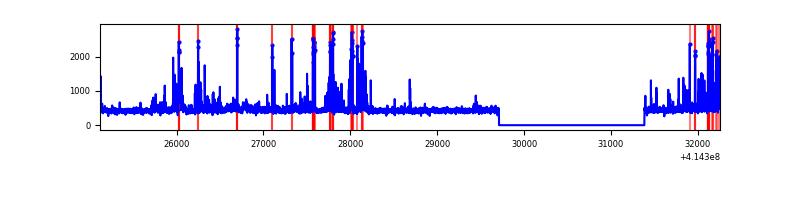 |
| C | 7136 | 5463 | 11 | 11 | 0.15% | 0.20% | 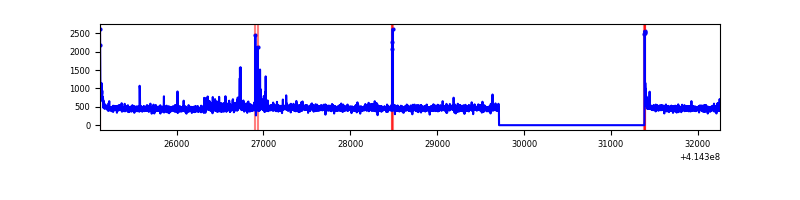 |
| D | 7136 | 5463 | 595 | 595 | 8.34% | 10.89% | 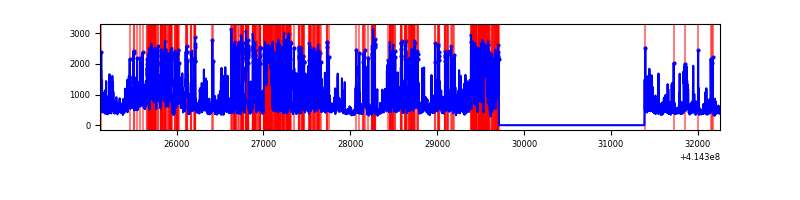 |
Top three noisy pixels from each quadrant. If the there are fewer than three noisy pixels in the level2.evt file, extra rows are filled as -1
| Pixel properties | Quadrant properties | ||||||
|---|---|---|---|---|---|---|---|
| Quadrant | DetID | PixID | Counts | Sigma | Mean | Median | Sigma |
| A | 10 | 83 | 483934 | 4093.18 | 582 | 570 | 118.1 |
| A | 6 | 10 | 169774 | 1432.84 | 582 | 570 | 118.1 |
| A | 13 | 248 | 152518 | 1286.71 | 582 | 570 | 118.1 |
| B | 5 | 255 | 199618 | 1795.78 | 577 | 561 | 110.8 |
| B | 4 | 170 | 156380 | 1405.71 | 577 | 561 | 110.8 |
| B | 4 | 171 | 52850 | 471.72 | 577 | 561 | 110.8 |
| C | 15 | 214 | 229427 | 1737.0 | 565 | 567 | 131.8 |
| C | 0 | 10 | 43243 | 323.9 | 565 | 567 | 131.8 |
| C | 9 | 54 | 34362 | 256.5 | 565 | 567 | 131.8 |
| D | 2 | 249 | 1120217 | 8283.25 | 546 | 528 | 135.2 |
| D | 2 | 250 | 738810 | 5461.67 | 546 | 528 | 135.2 |
| D | 12 | 227 | 483632 | 3573.91 | 546 | 528 | 135.2 |
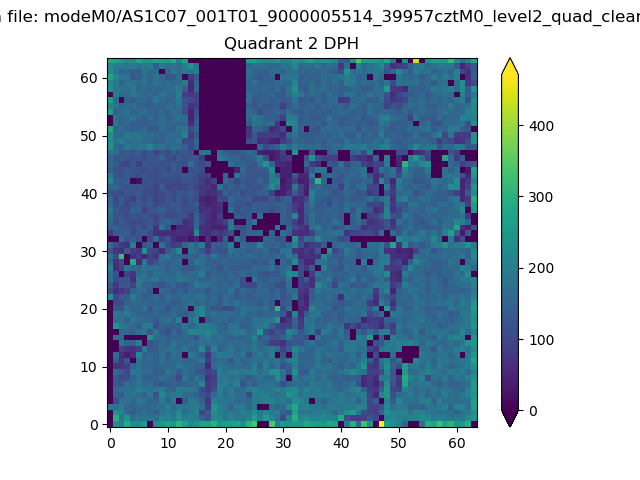
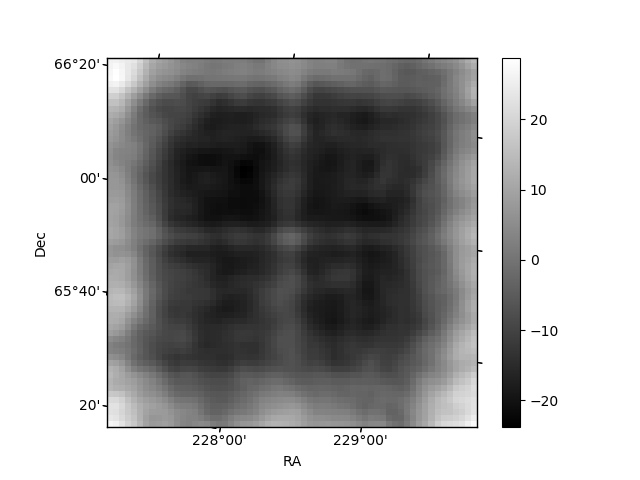
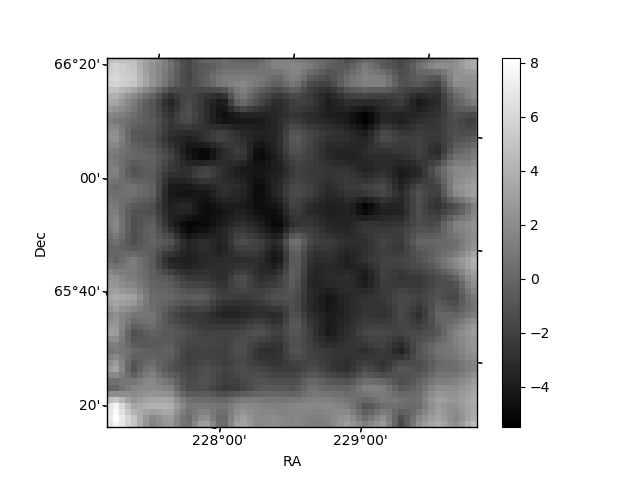
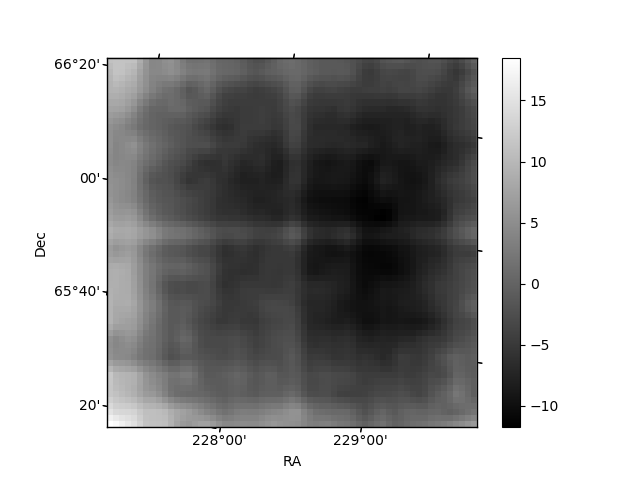
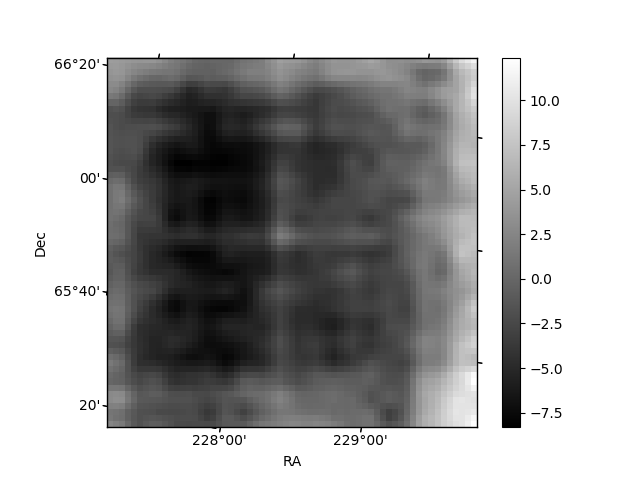
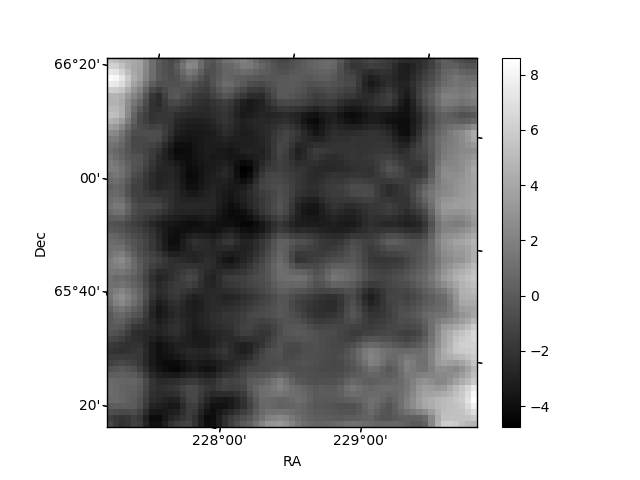
Histogram calculated using DETX and DETY for each event in the final _common_clean file
| Quadrant A | 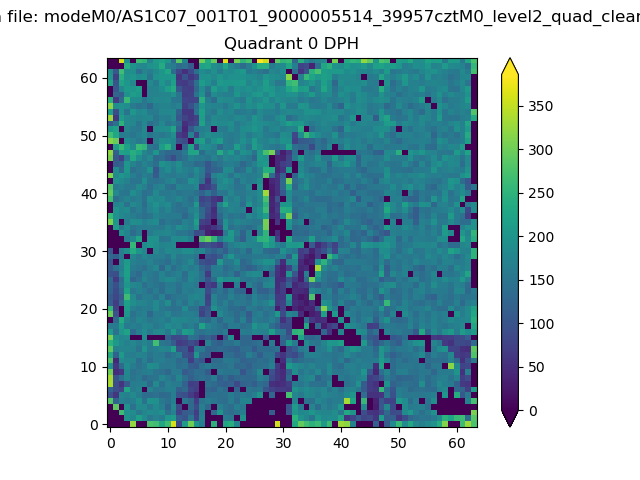 |
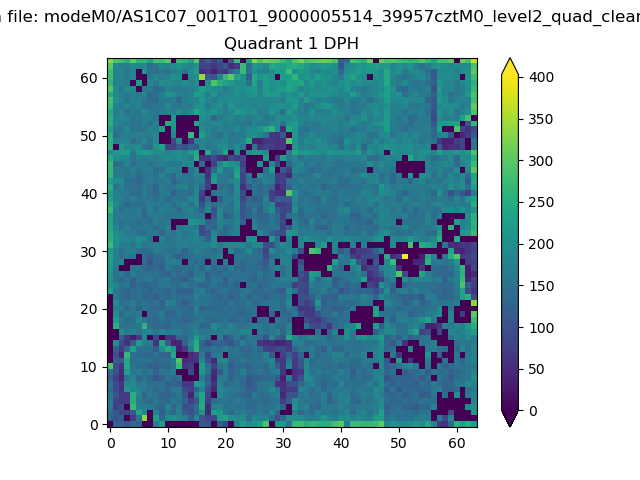 |
Quadrant B |
|---|---|---|---|
| Quadrant D | 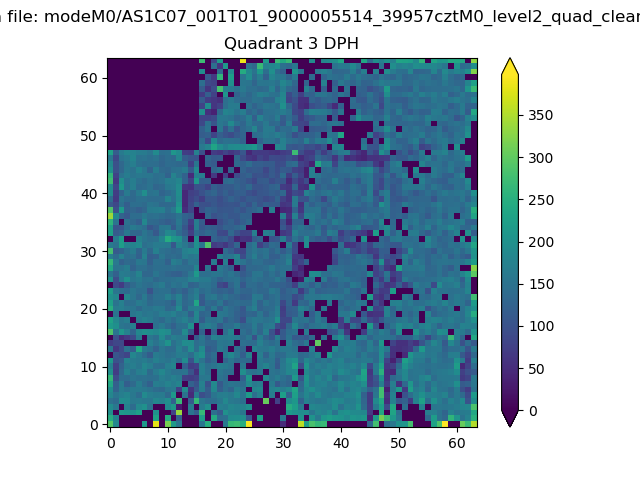 |
 |
Quadrant C |
| Plot type | Count rate plots | Images |
|---|---|---|
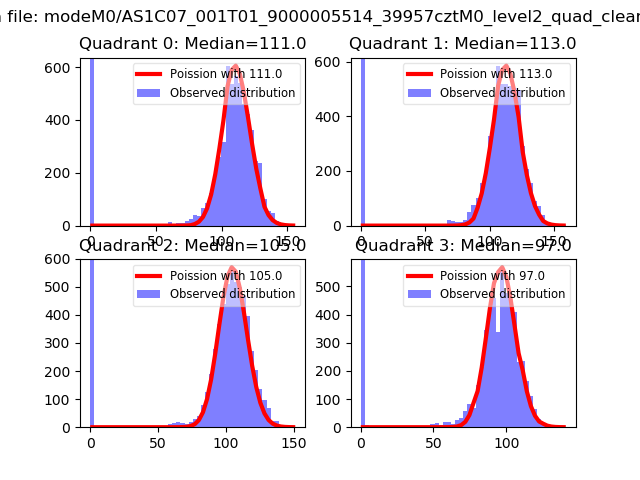
| Comparison with Poisson distribution Blue bars denote a histogram of data divided into 1 sec bins. Red curve is a Poisson curve with rate = median count rate of data. |
 |
 |
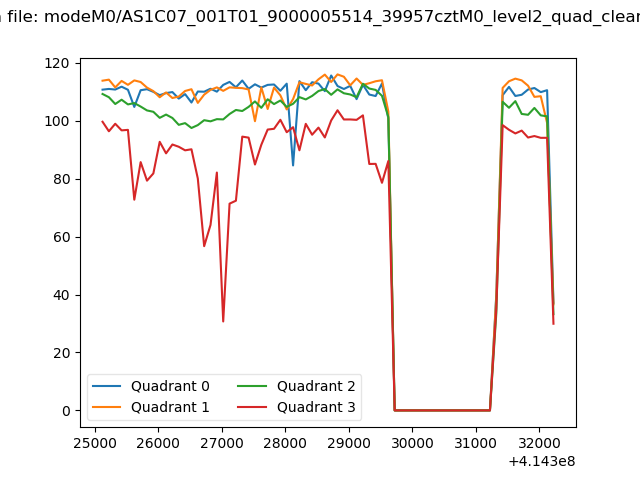
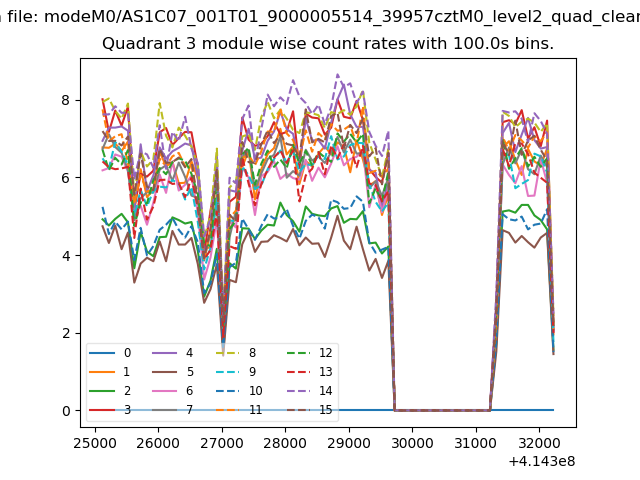
| Quadrant-wise count rates Data is divided into 100 sec bins |
 |
|
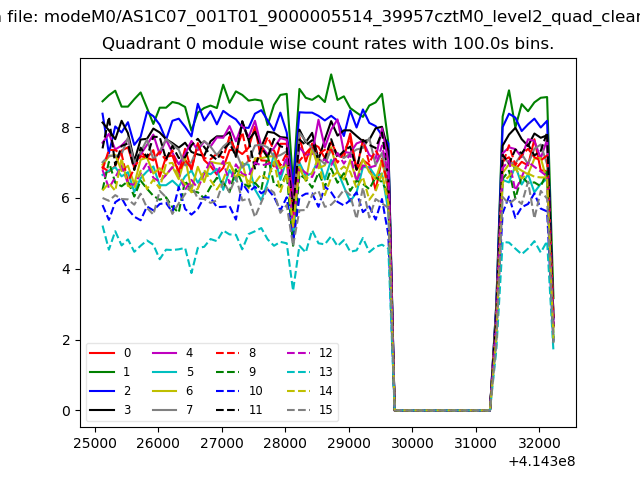
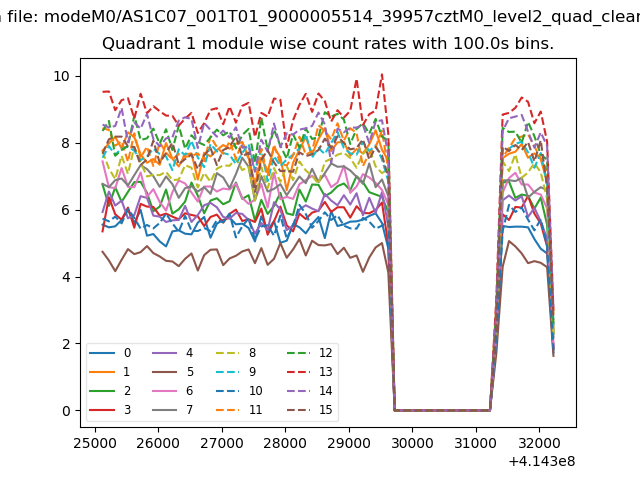
| Module-wise count rates for Quadrant A Data is divided into 100 sec bins |
 |
 |
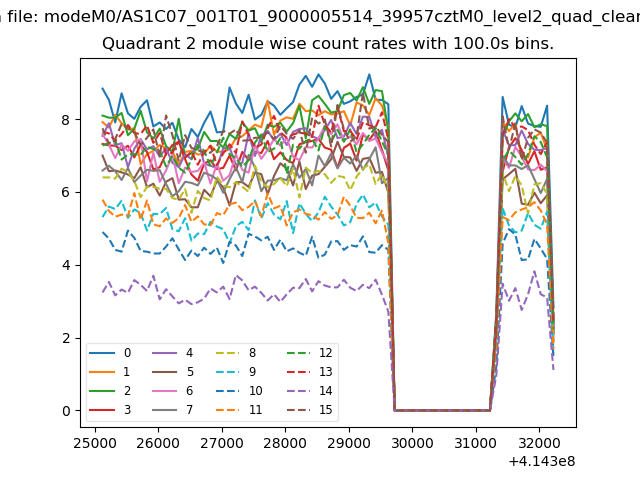
| Module-wise count rates for Quadrant B Data is divided into 100 sec bins |
 |
 |
| Module-wise count rates for Quadrant C Data is divided into 100 sec bins |
 |
 |
| Module-wise count rates for Quadrant D Data is divided into 100 sec bins |
 |
 |
| Parameter | Plot |
|---|---|
| CZT HV Monitor |  |
| D_VDD | 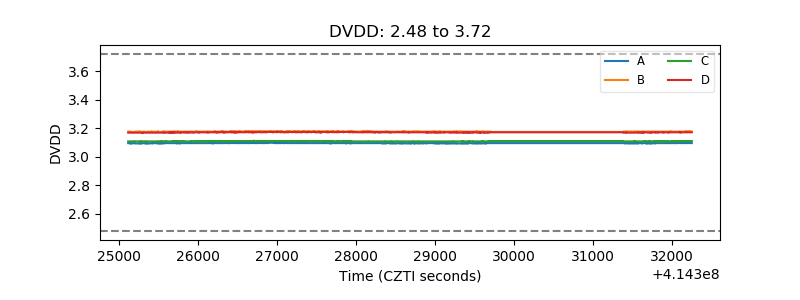 |
| Temperature 1 |  |
| Veto HV Monitor | 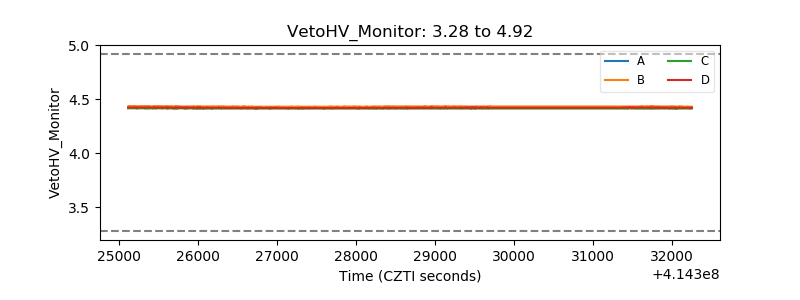 |
| Veto LLD | 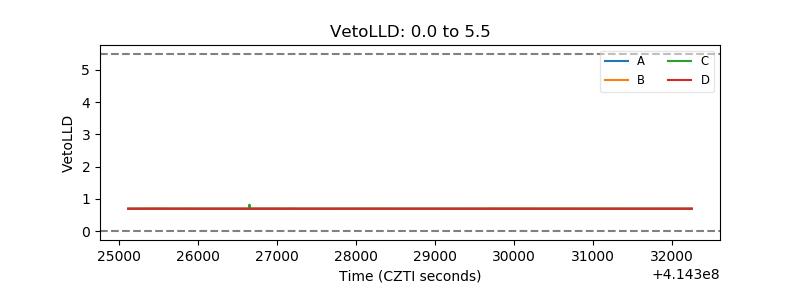 |
| Alpha Counter | 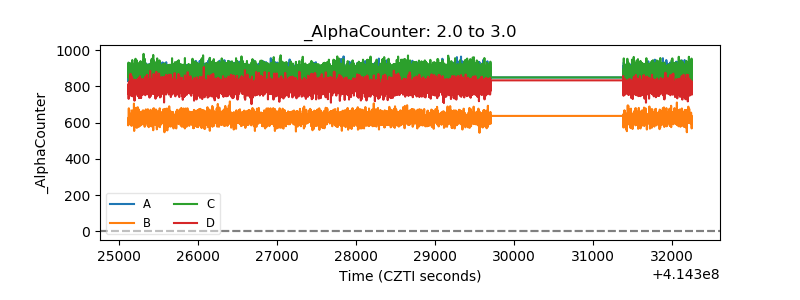 |
| _CPM_Rate | 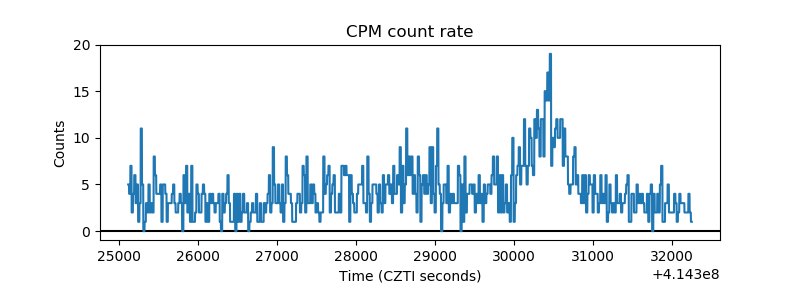 |
| CZT Counter | 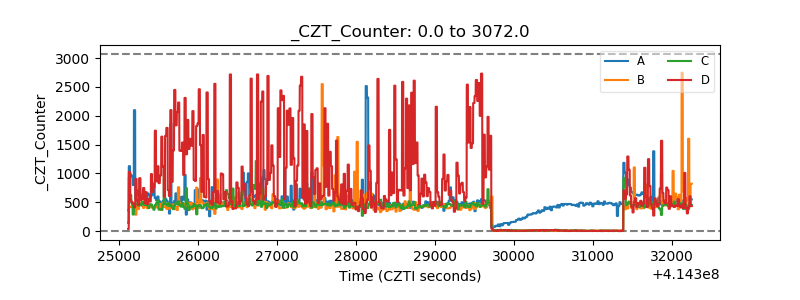 |
| +2.5 Volts monitor | 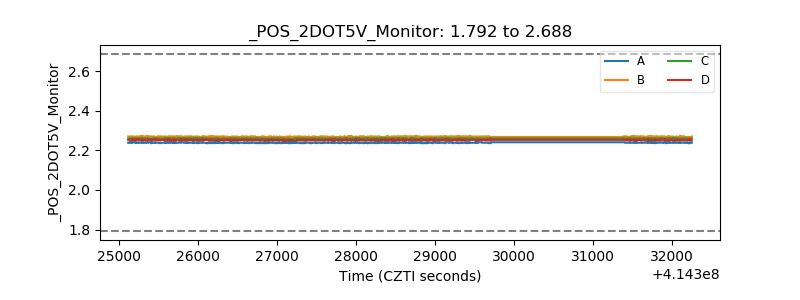 |
| +5 Volts monitor | 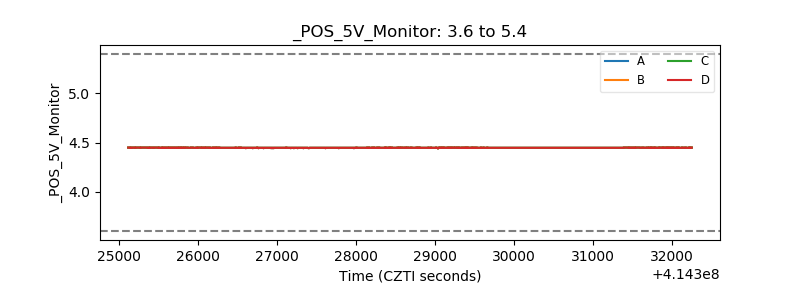 |
| _ROLL_ROT | 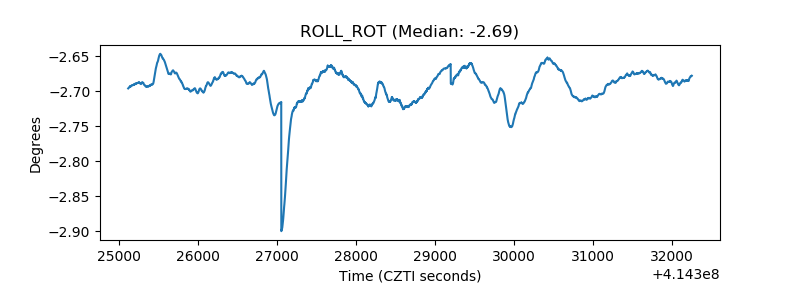 |
| _Roll_DEC | 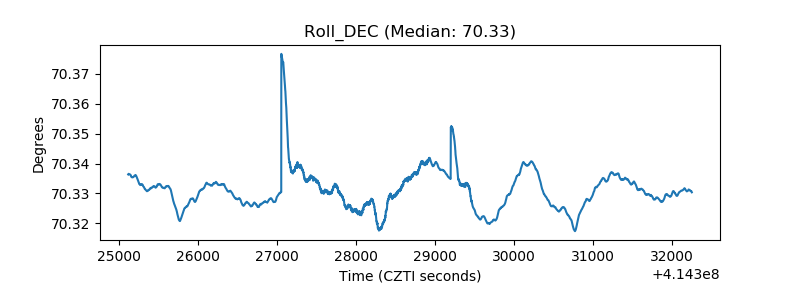 |
| _Roll_RA | 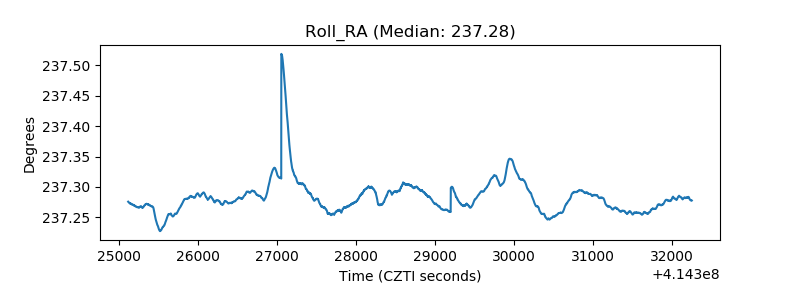 |
| Veto Counter | 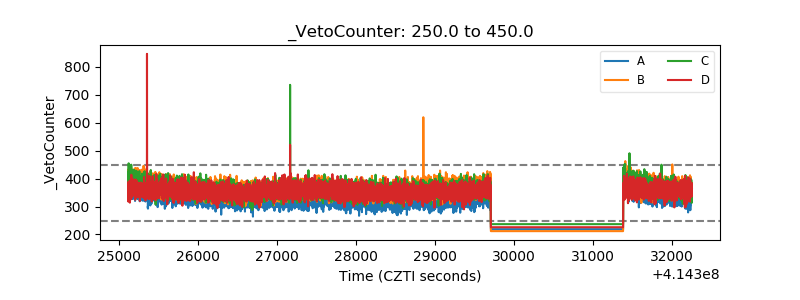 |