| Param | Original file | Final file |
|---|---|---|
| Filename | modeM0/AS1C07_001T01_9000005514_39958cztM0_level2.fits | modeM0/AS1C07_001T01_9000005514_39958cztM0_level2_quad_clean.evt |
| Size (bytes) | 416,888,640 | 94,752,000 |
| Size | 397.6 MB | 90.4 MB |
| Events in quadrant A | 3,473,657 | 650,426 |
| Events in quadrant B | 3,336,408 | 645,224 |
| Events in quadrant C | 2,884,102 | 616,254 |
| Events in quadrant D | 5,273,793 | 539,886 |
| Mode SS | |||
|---|---|---|---|
| Quadrant | BADHDUFLAG | Total packets | Discarded packets |
| A | 0 | 122 | 0 |
| B | 0 | 122 | 0 |
| C | 0 | 122 | 0 |
| D | 0 | 122 | 0 |
| Mode M9 | |||
|---|---|---|---|
| Quadrant | BADHDUFLAG | Total packets | Discarded packets |
| A | 0 | 15 | 0 |
| B | 0 | 15 | 0 |
| C | 0 | 15 | 0 |
| D | 0 | 16 | 0 |
| Mode M0 | |||
|---|---|---|---|
| Quadrant | BADHDUFLAG | Total packets | Discarded packets |
| A | 0 | 14063 | 3 |
| B | 0 | 14163 | 2 |
| C | 0 | 12408 | 2 |
| D | 0 | 19805 | 2 |
| Quadrant | Total seconds | Saturated seconds | Saturation percentage |
|---|---|---|---|
| A | 5966 | 94 | 1.575595% |
| B | 5966 | 177 | 2.966812% |
| C | 5966 | 23 | 0.385518% |
| D | 5966 | 509 | 8.531680% |
Noise dominated data is calculated using 1-second bins in cleaned event files. If a bin has >2000 counts, and if more than 50% of those come from <1% of pixels, then it is considered to be noise-dominated and hence unusable.
| Quadrant | # 1 sec bins | Bins with >0 counts | Bins with >2000 counts | High rate bins dominated by noise | Noise dominated (total time) | Noise dominated (detector-on time) | Marked lightcurve |
|---|---|---|---|---|---|---|---|
| A | 7338 | 5966 | 77 | 77 | 1.05% | 1.29% | 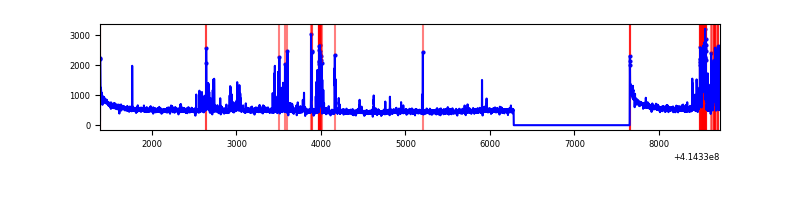 |
| B | 7338 | 5966 | 157 | 157 | 2.14% | 2.63% | 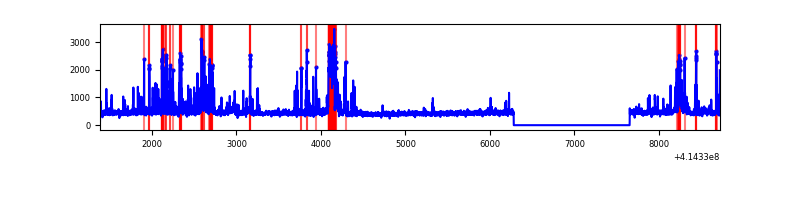 |
| C | 7339 | 5967 | 19 | 19 | 0.26% | 0.32% | 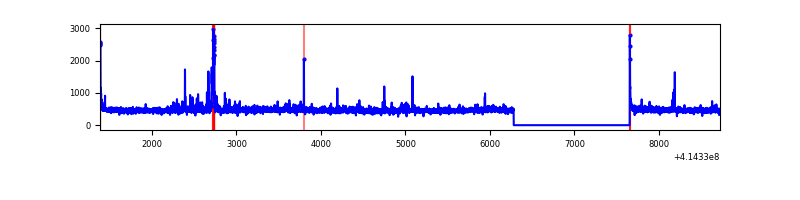 |
| D | 7339 | 5967 | 542 | 542 | 7.39% | 9.08% | 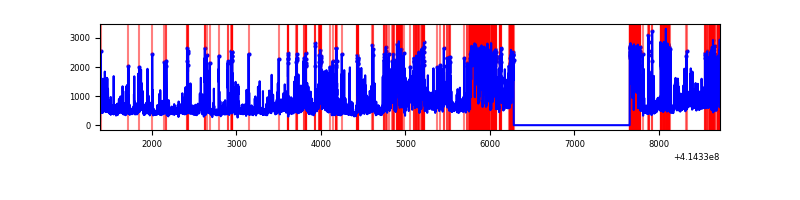 |
Top three noisy pixels from each quadrant. If the there are fewer than three noisy pixels in the level2.evt file, extra rows are filled as -1
| Pixel properties | Quadrant properties | ||||||
|---|---|---|---|---|---|---|---|
| Quadrant | DetID | PixID | Counts | Sigma | Mean | Median | Sigma |
| A | 10 | 83 | 518602 | 3992.64 | 636 | 623 | 129.7 |
| A | 13 | 248 | 398668 | 3068.18 | 636 | 623 | 129.7 |
| A | 15 | 222 | 23224 | 174.21 | 636 | 623 | 129.7 |
| B | 5 | 32 | 287062 | 2368.01 | 627 | 611 | 121.0 |
| B | 5 | 255 | 263392 | 2172.34 | 627 | 611 | 121.0 |
| B | 4 | 171 | 124390 | 1023.25 | 627 | 611 | 121.0 |
| C | 15 | 214 | 250872 | 1727.44 | 617 | 620 | 144.9 |
| C | 7 | 220 | 53062 | 361.99 | 617 | 620 | 144.9 |
| C | 10 | 20 | 49562 | 337.83 | 617 | 620 | 144.9 |
| D | 2 | 249 | 1136929 | 7595.0 | 601 | 582 | 149.6 |
| D | 12 | 227 | 973218 | 6500.81 | 601 | 582 | 149.6 |
| D | 12 | 233 | 289071 | 1928.17 | 601 | 582 | 149.6 |
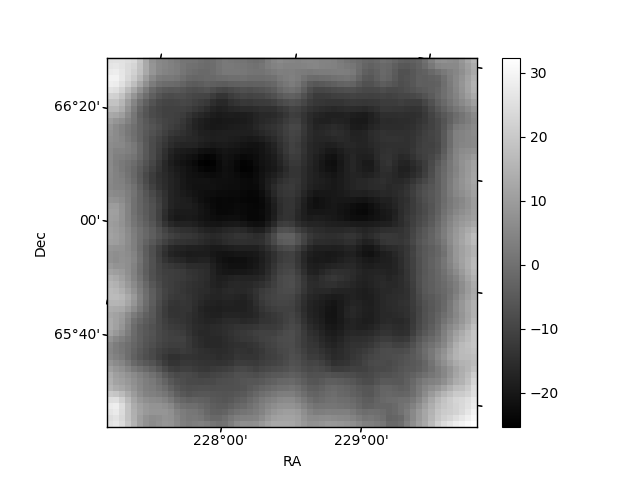
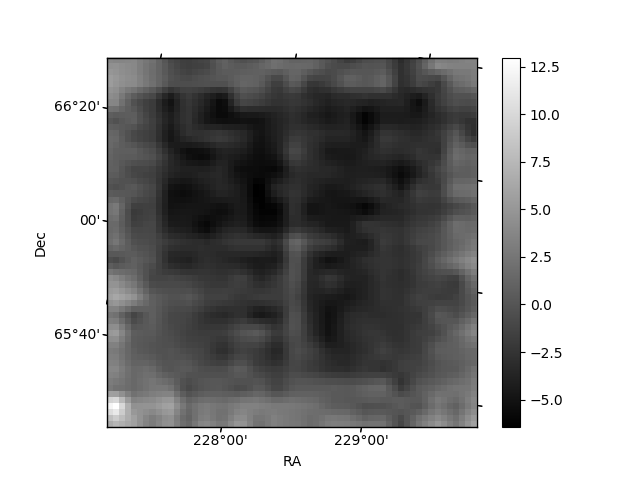
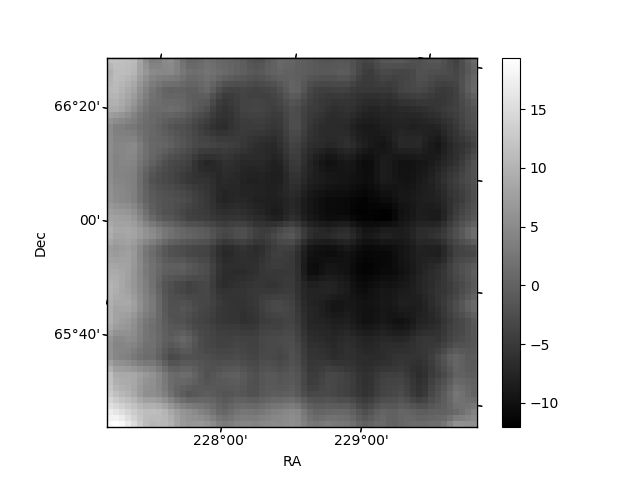
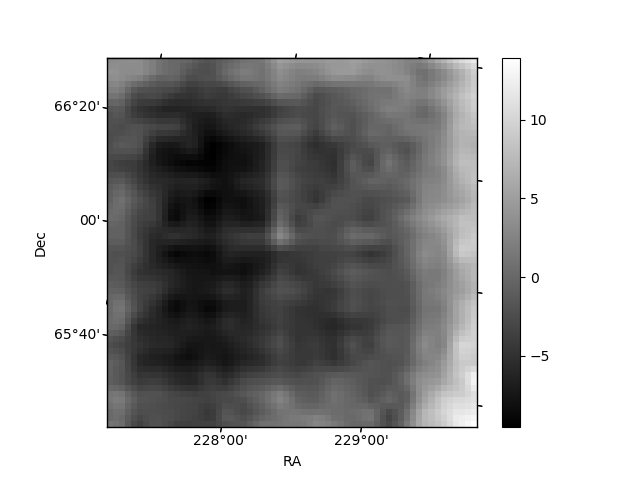
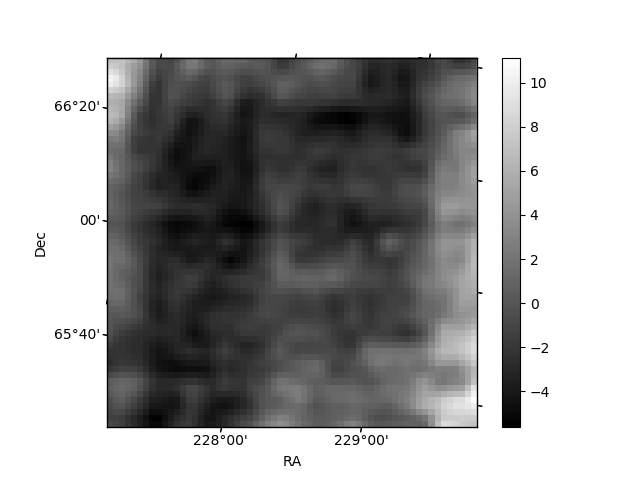
Histogram calculated using DETX and DETY for each event in the final _common_clean file
| Quadrant A | 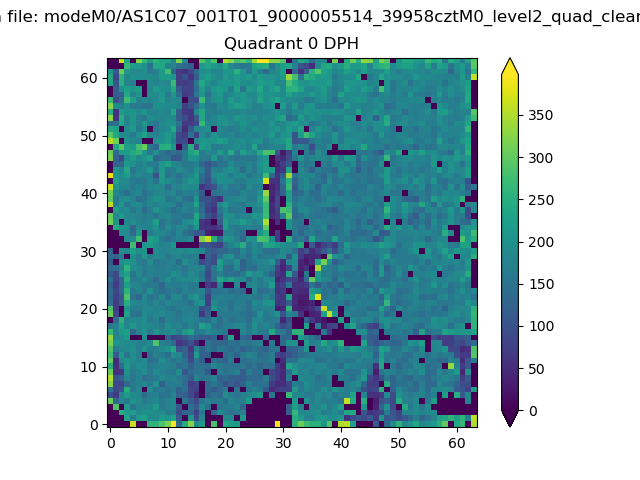 |
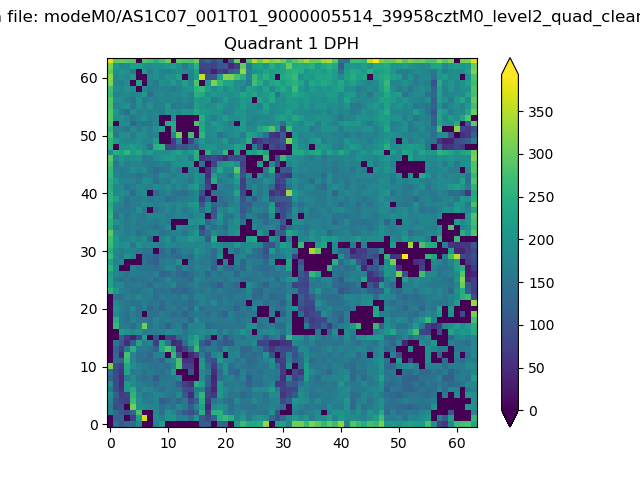 |
Quadrant B |
|---|---|---|---|
| Quadrant D | 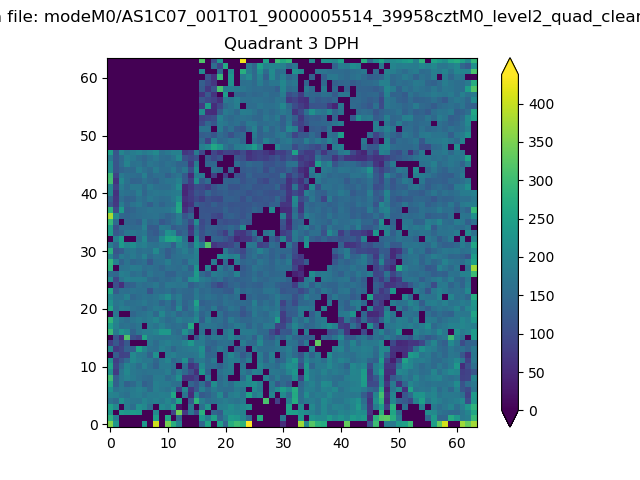 |
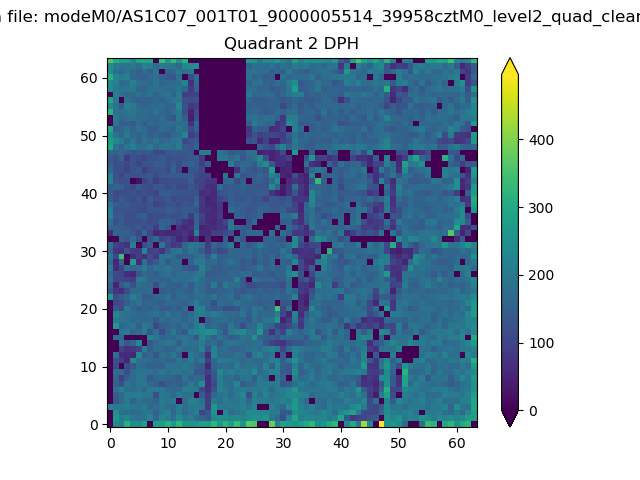 |
Quadrant C |
| Plot type | Count rate plots | Images |
|---|---|---|
| Comparison with Poisson distribution Blue bars denote a histogram of data divided into 1 sec bins. Red curve is a Poisson curve with rate = median count rate of data. |
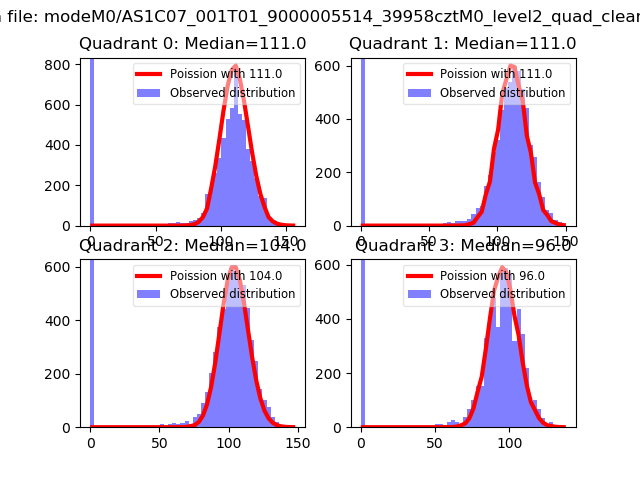 |
 |
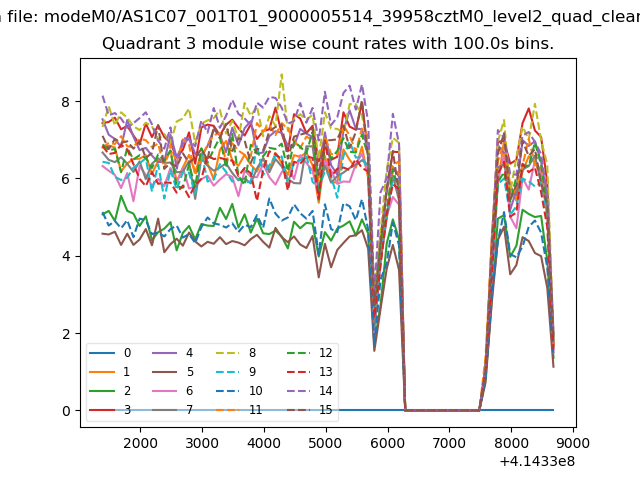
| Quadrant-wise count rates Data is divided into 100 sec bins |
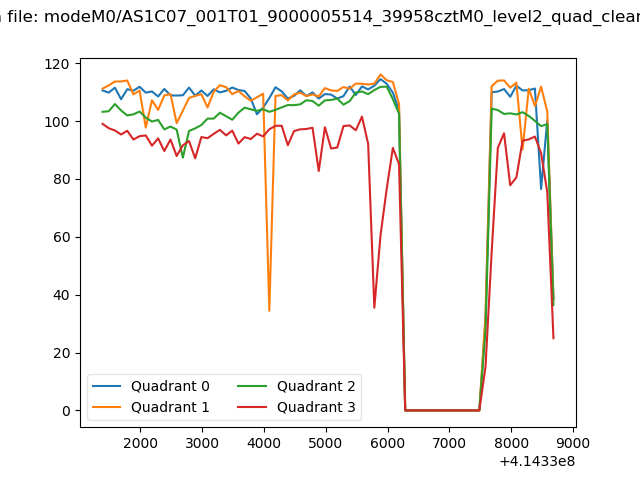 |
|
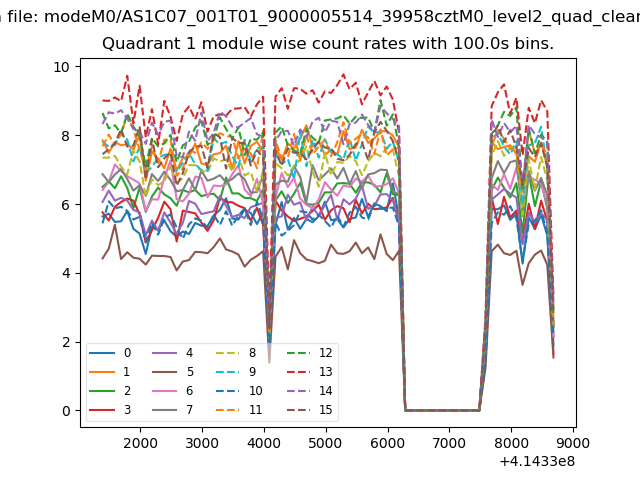
| Module-wise count rates for Quadrant A Data is divided into 100 sec bins |
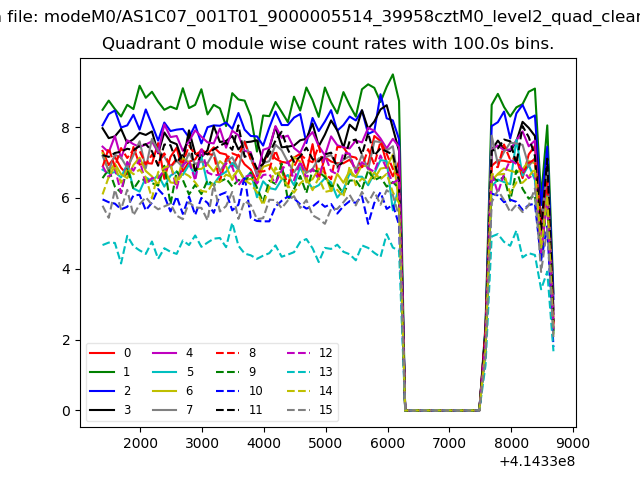 |
 |
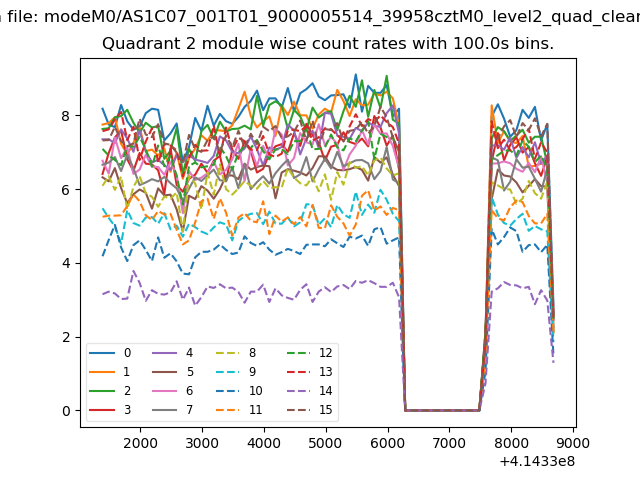
| Module-wise count rates for Quadrant B Data is divided into 100 sec bins |
 |
 |
| Module-wise count rates for Quadrant C Data is divided into 100 sec bins |
 |
 |
| Module-wise count rates for Quadrant D Data is divided into 100 sec bins |
 |
 |
| Parameter | Plot |
|---|---|
| CZT HV Monitor | 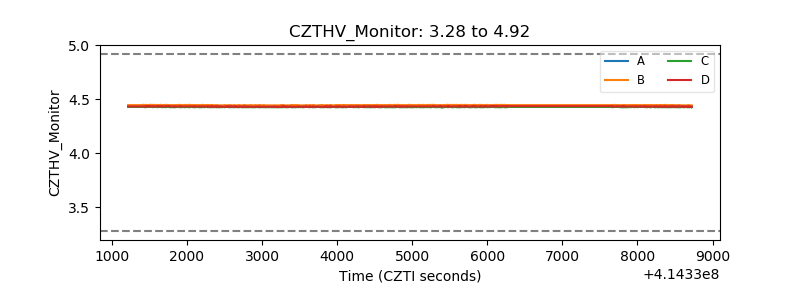 |
| D_VDD | 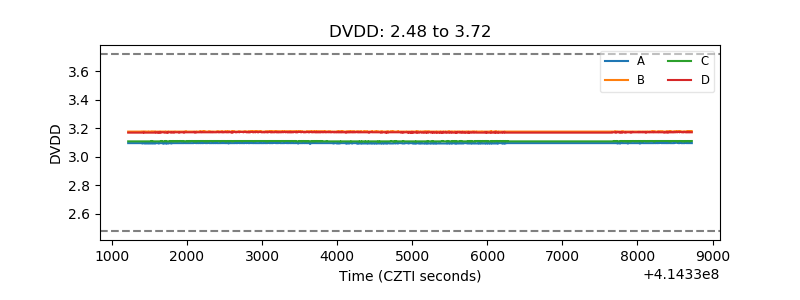 |
| Temperature 1 | 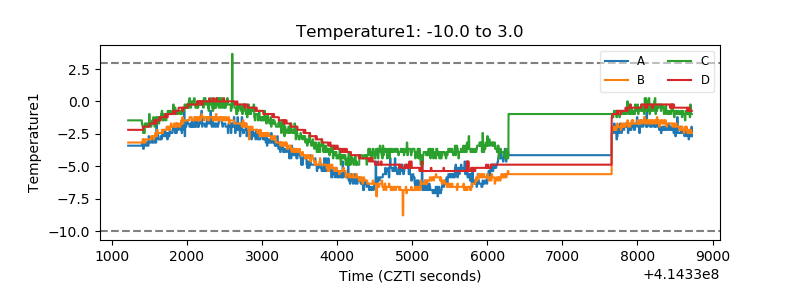 |
| Veto HV Monitor | 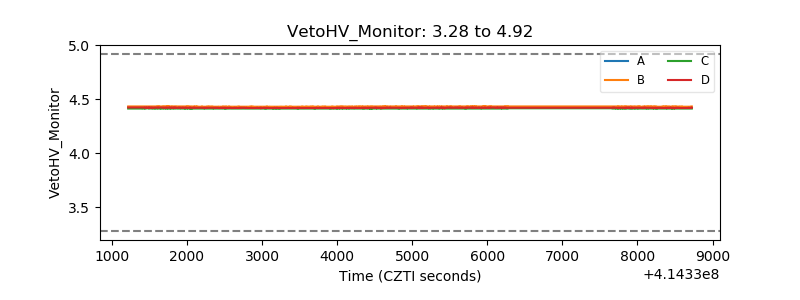 |
| Veto LLD | 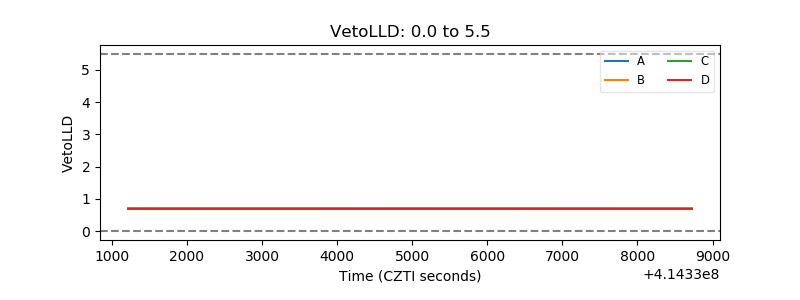 |
| Alpha Counter | 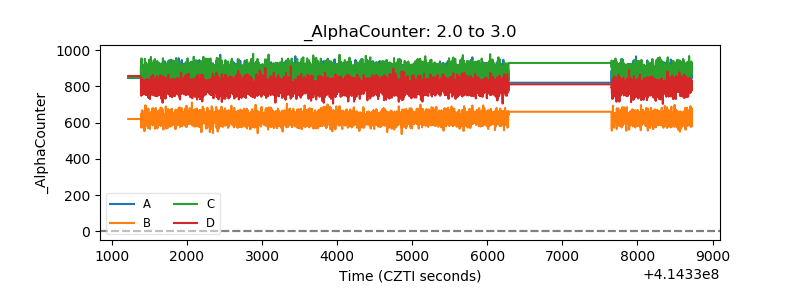 |
| _CPM_Rate | 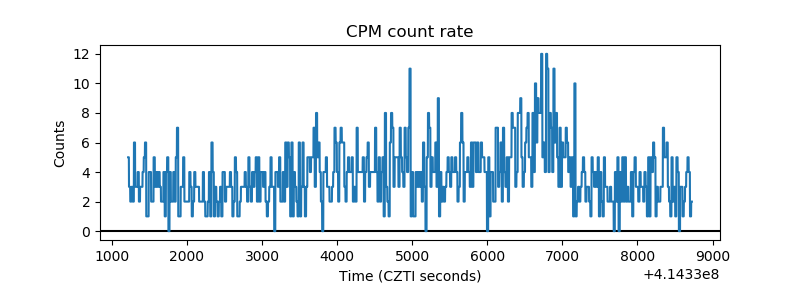 |
| CZT Counter | 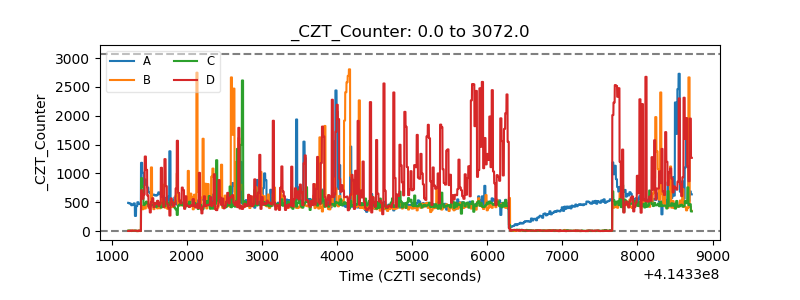 |
| +2.5 Volts monitor | 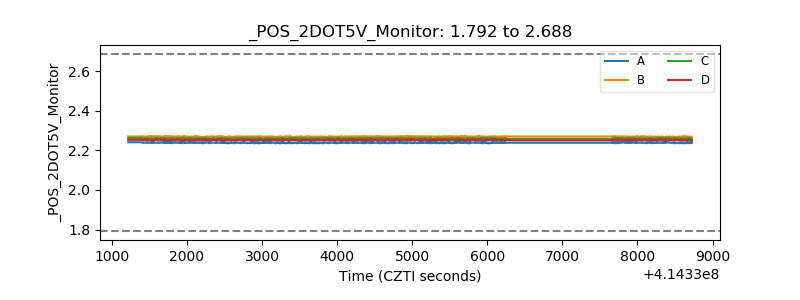 |
| +5 Volts monitor | 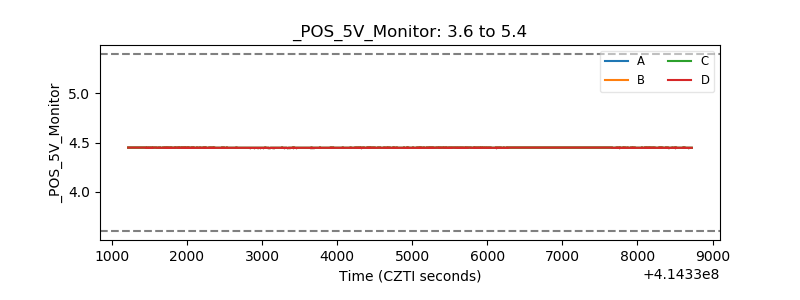 |
| _ROLL_ROT | 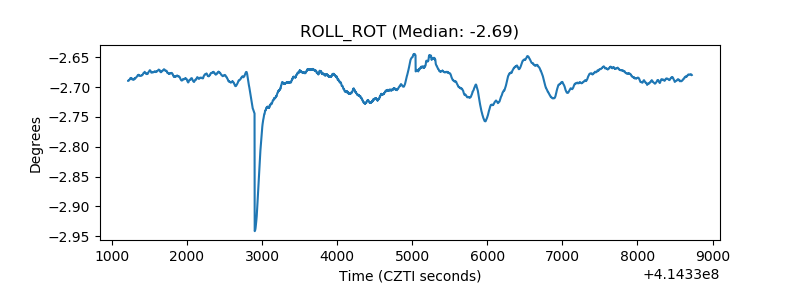 |
| _Roll_DEC | 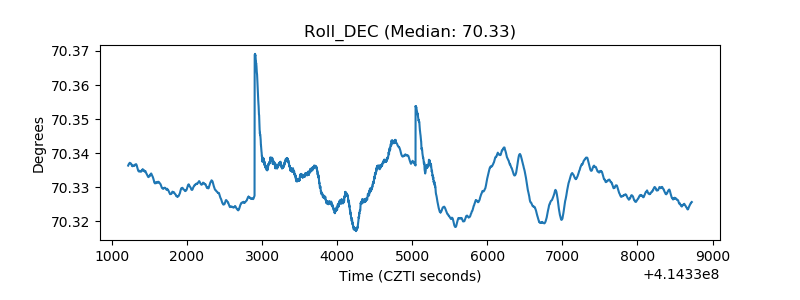 |
| _Roll_RA | 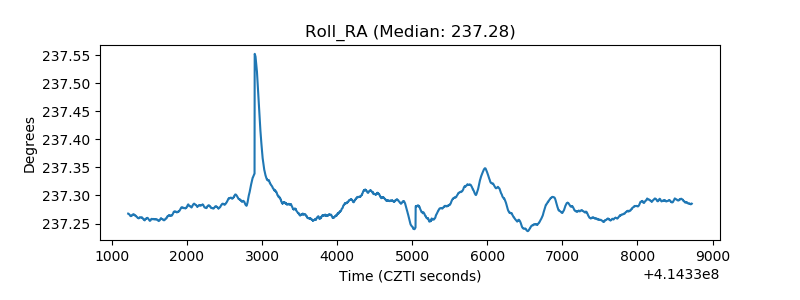 |
| Veto Counter | 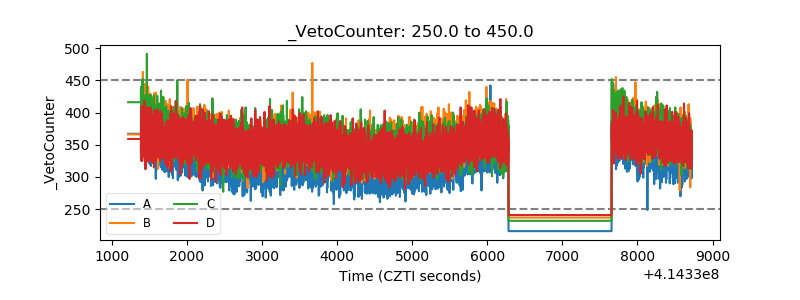 |