| Param | Original file | Final file |
|---|---|---|
| Filename | modeM0/AS1C07_001T01_9000005514_39963cztM0_level2.fits | modeM0/AS1C07_001T01_9000005514_39963cztM0_level2_quad_clean.evt |
| Size (bytes) | 136,016,640 | 39,605,760 |
| Size | 129.7 MB | 37.8 MB |
| Events in quadrant A | 1,204,173 | 261,384 |
| Events in quadrant B | 1,162,984 | 265,319 |
| Events in quadrant C | 1,119,017 | 258,268 |
| Events in quadrant D | 1,353,760 | 237,114 |
| Mode SS | |||
|---|---|---|---|
| Quadrant | BADHDUFLAG | Total packets | Discarded packets |
| A | 0 | 48 | 0 |
| B | 0 | 48 | 0 |
| C | 0 | 48 | 0 |
| D | 0 | 48 | 0 |
| Mode M9 | |||
|---|---|---|---|
| Quadrant | BADHDUFLAG | Total packets | Discarded packets |
| A | 0 | 14 | 0 |
| B | 0 | 14 | 0 |
| C | 0 | 14 | 0 |
| D | 0 | 15 | 0 |
| Mode M0 | |||
|---|---|---|---|
| Quadrant | BADHDUFLAG | Total packets | Discarded packets |
| A | 0 | 5411 | 1 |
| B | 0 | 5378 | 1 |
| C | 0 | 5093 | 1 |
| D | 0 | 5946 | 1 |
| Quadrant | Total seconds | Saturated seconds | Saturation percentage |
|---|---|---|---|
| A | 2472 | 22 | 0.889968% |
| B | 2472 | 29 | 1.173139% |
| C | 2472 | 6 | 0.242718% |
| D | 2472 | 54 | 2.184466% |
Noise dominated data is calculated using 1-second bins in cleaned event files. If a bin has >2000 counts, and if more than 50% of those come from <1% of pixels, then it is considered to be noise-dominated and hence unusable.
| Quadrant | # 1 sec bins | Bins with >0 counts | Bins with >2000 counts | High rate bins dominated by noise | Noise dominated (total time) | Noise dominated (detector-on time) | Marked lightcurve |
|---|---|---|---|---|---|---|---|
| A | 2472 | 2472 | 15 | 15 | 0.61% | 0.61% | 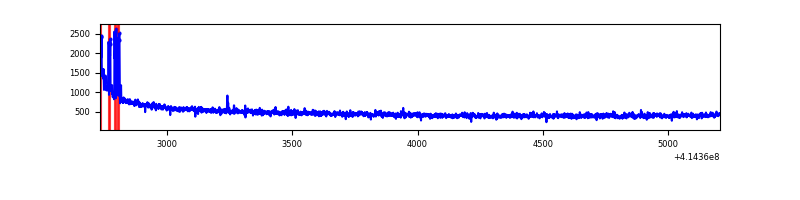 |
| B | 2472 | 2472 | 20 | 20 | 0.81% | 0.81% | 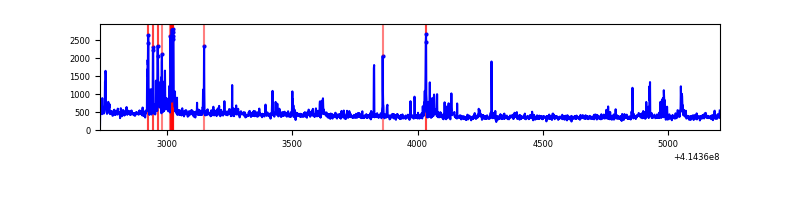 |
| C | 2472 | 2472 | 5 | 5 | 0.20% | 0.20% | 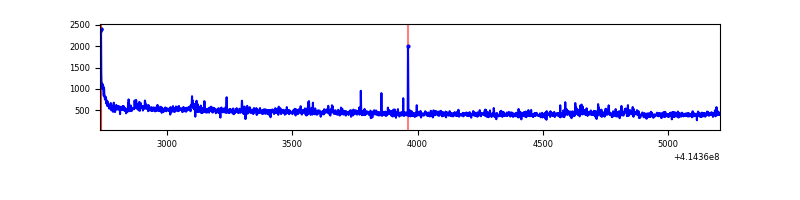 |
| D | 2472 | 2472 | 40 | 40 | 1.62% | 1.62% | 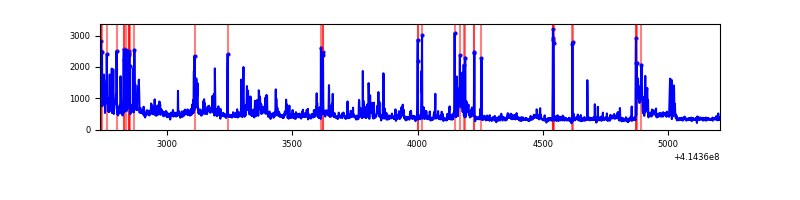 |
Top three noisy pixels from each quadrant. If the there are fewer than three noisy pixels in the level2.evt file, extra rows are filled as -1
| Pixel properties | Quadrant properties | ||||||
|---|---|---|---|---|---|---|---|
| Quadrant | DetID | PixID | Counts | Sigma | Mean | Median | Sigma |
| A | 10 | 83 | 212357 | 4066.95 | 245 | 239 | 52.2 |
| A | 13 | 248 | 38220 | 728.21 | 245 | 239 | 52.2 |
| A | 9 | 191 | 3552 | 63.52 | 245 | 239 | 52.2 |
| B | 5 | 255 | 104939 | 2133.0 | 247 | 240 | 49.1 |
| B | 4 | 171 | 75925 | 1541.9 | 247 | 240 | 49.1 |
| B | 5 | 63 | 6145 | 120.3 | 247 | 240 | 49.1 |
| C | 15 | 214 | 104826 | 1778.75 | 246 | 248 | 58.8 |
| C | 9 | 54 | 25691 | 432.76 | 246 | 248 | 58.8 |
| C | 0 | 10 | 19402 | 325.79 | 246 | 248 | 58.8 |
| D | 12 | 227 | 227227 | 3771.4 | 238 | 230 | 60.2 |
| D | 1 | 47 | 78642 | 1302.76 | 238 | 230 | 60.2 |
| D | 2 | 250 | 63694 | 1054.41 | 238 | 230 | 60.2 |
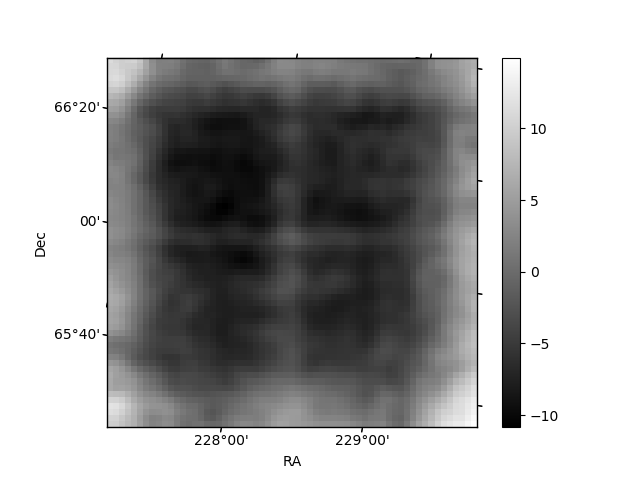
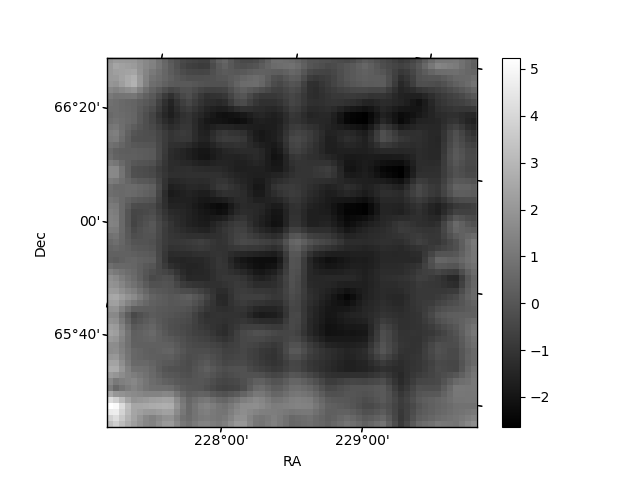
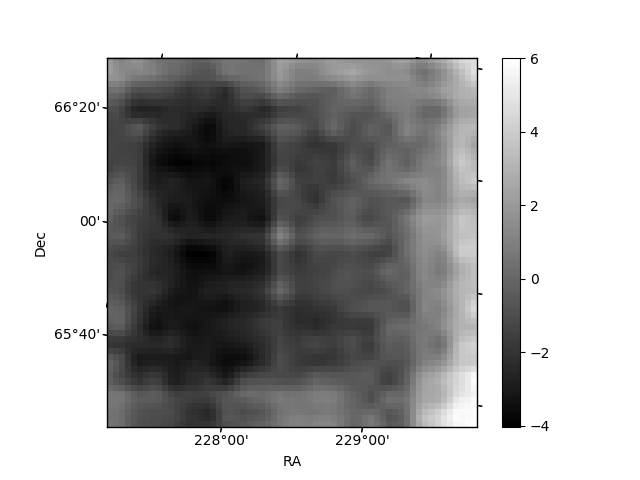
Histogram calculated using DETX and DETY for each event in the final _common_clean file
| Quadrant A | 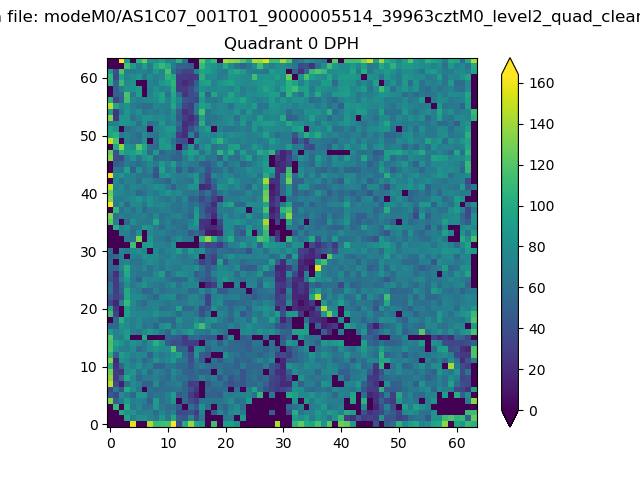 |
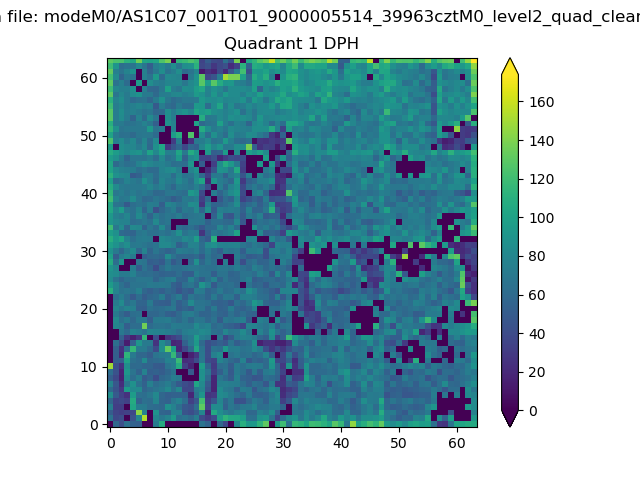 |
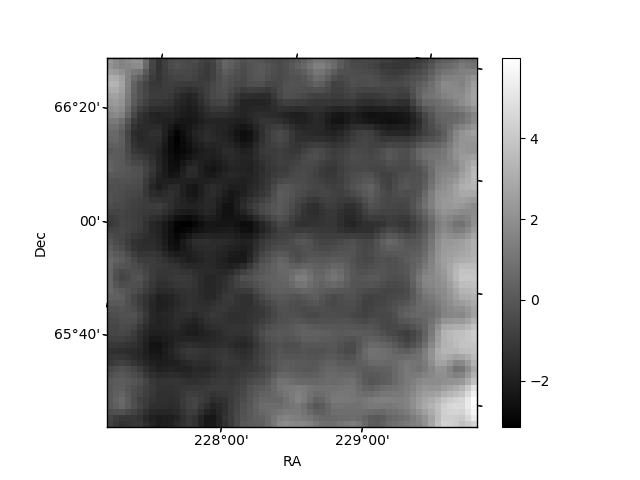
Quadrant B |
|---|---|---|---|
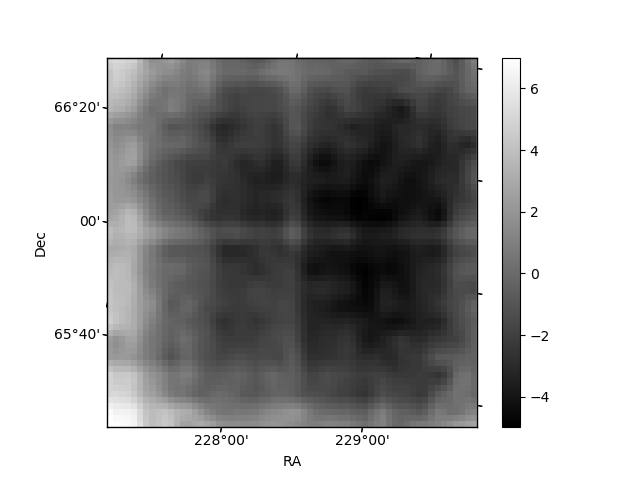
| Quadrant D | 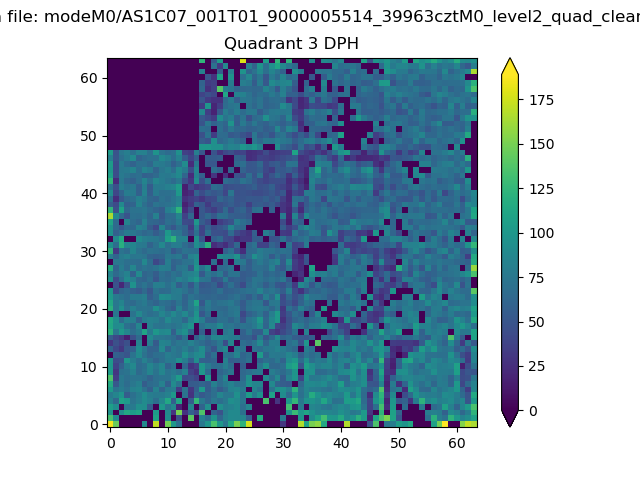 |
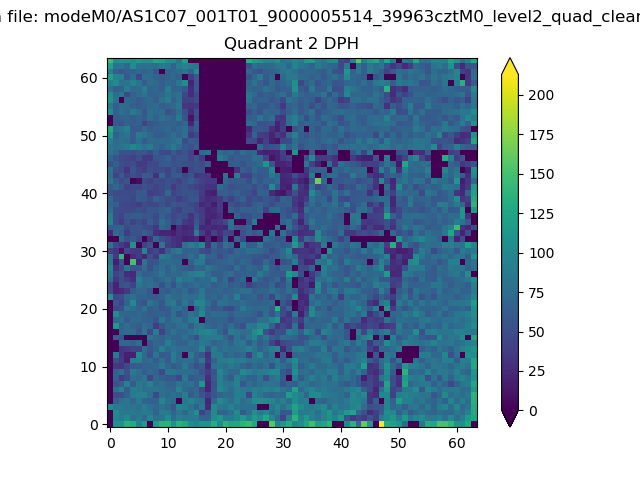 |
Quadrant C |
| Plot type | Count rate plots | Images |
|---|---|---|
| Comparison with Poisson distribution Blue bars denote a histogram of data divided into 1 sec bins. Red curve is a Poisson curve with rate = median count rate of data. |
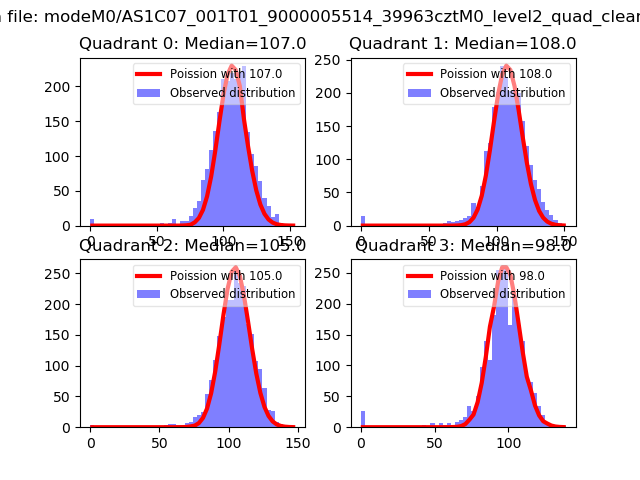 |
 |
| Quadrant-wise count rates Data is divided into 100 sec bins |
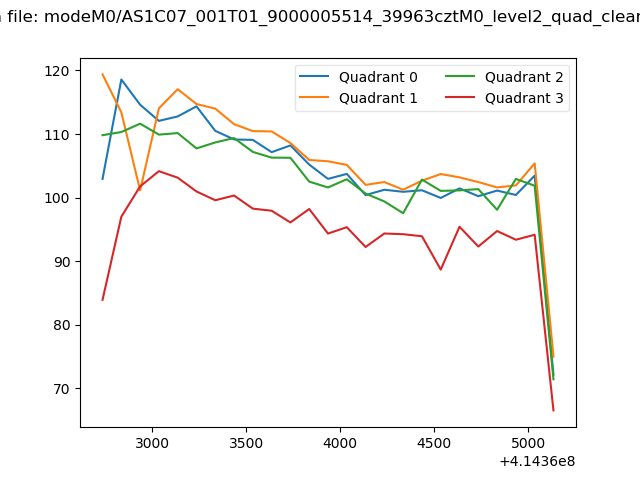 |
|
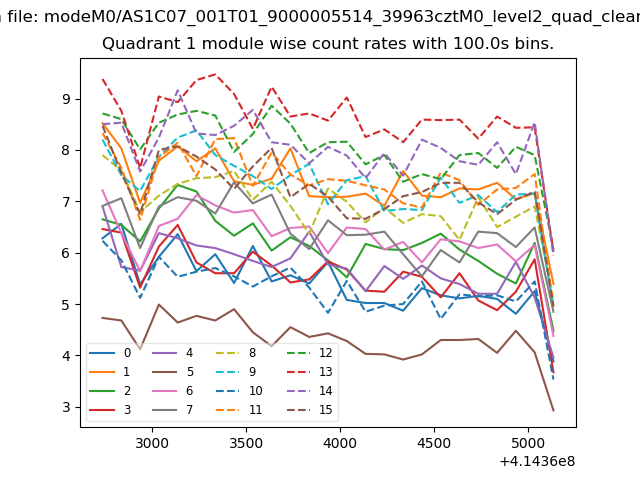
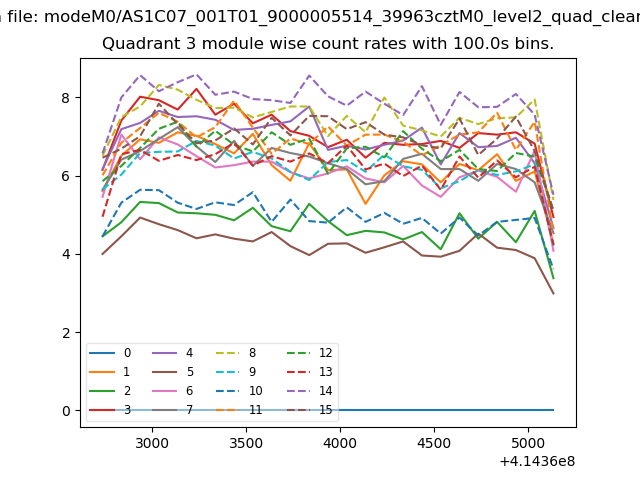
| Module-wise count rates for Quadrant A Data is divided into 100 sec bins |
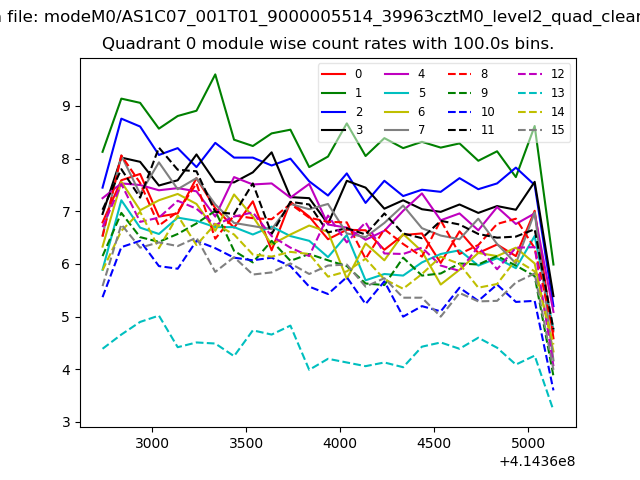 |
 |
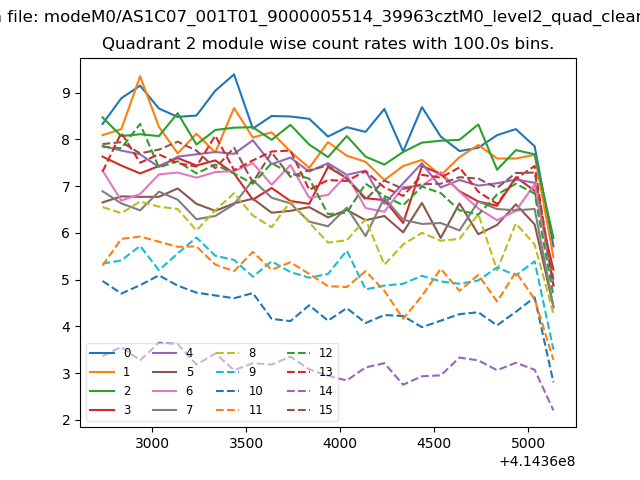
| Module-wise count rates for Quadrant B Data is divided into 100 sec bins |
 |
 |
| Module-wise count rates for Quadrant C Data is divided into 100 sec bins |
 |
 |
| Module-wise count rates for Quadrant D Data is divided into 100 sec bins |
 |
 |
| Parameter | Plot |
|---|---|
| CZT HV Monitor | 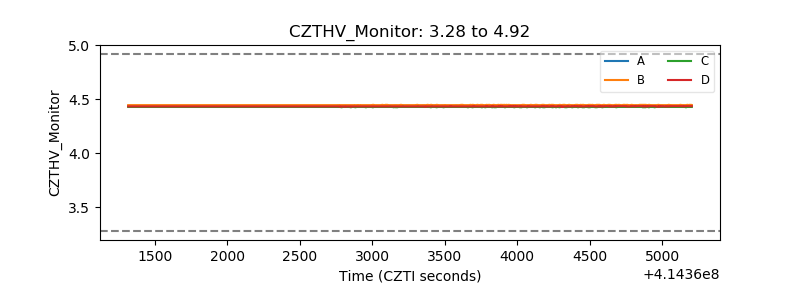 |
| D_VDD | 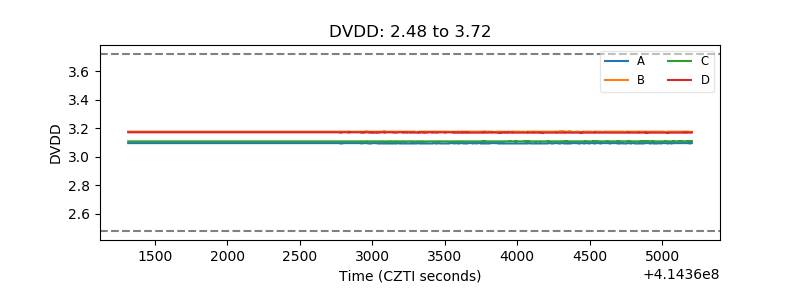 |
| Temperature 1 | 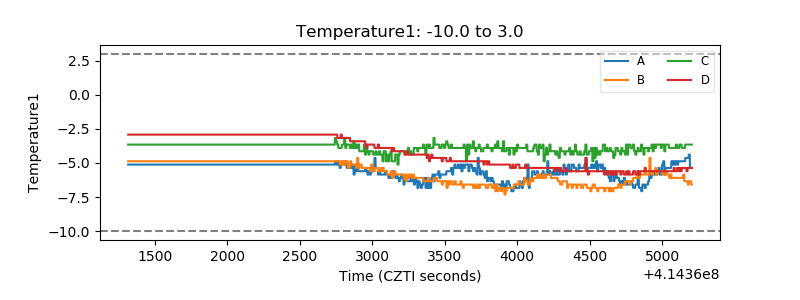 |
| Veto HV Monitor | 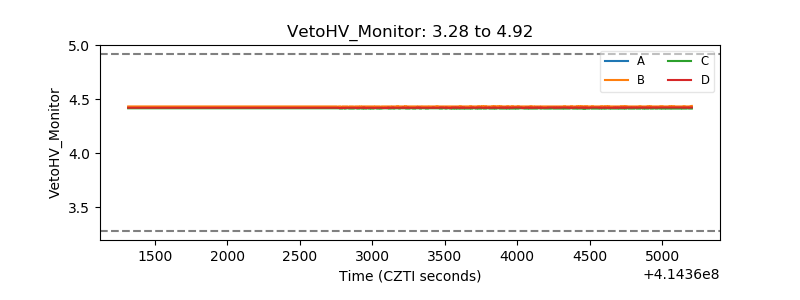 |
| Veto LLD | 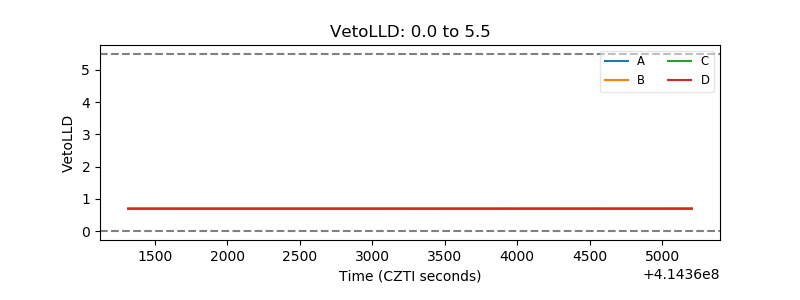 |
| Alpha Counter | 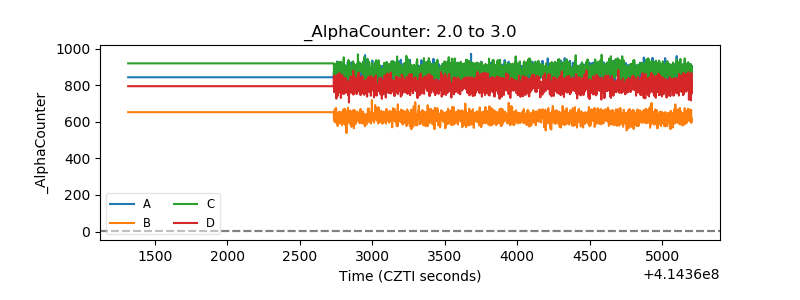 |
| _CPM_Rate | 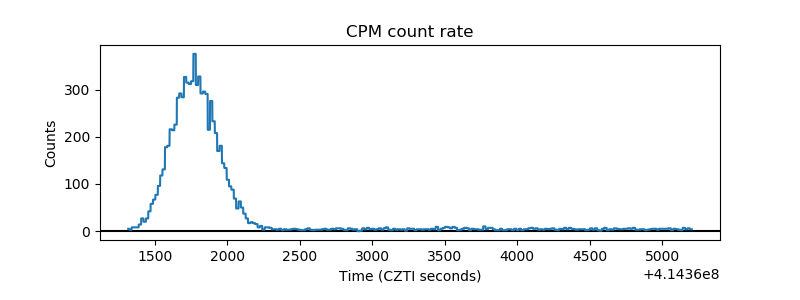 |
| CZT Counter | 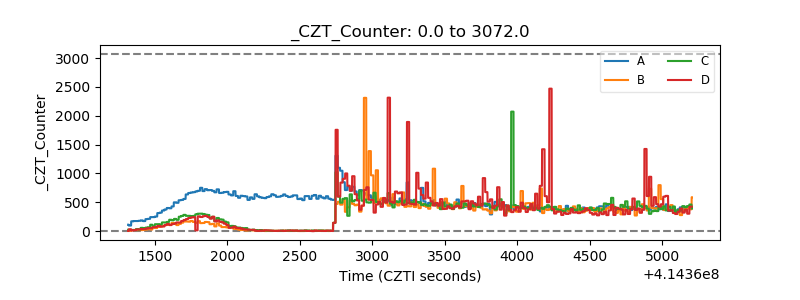 |
| +2.5 Volts monitor | 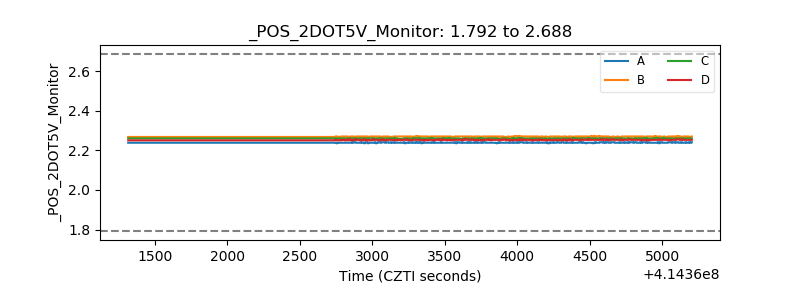 |
| +5 Volts monitor | 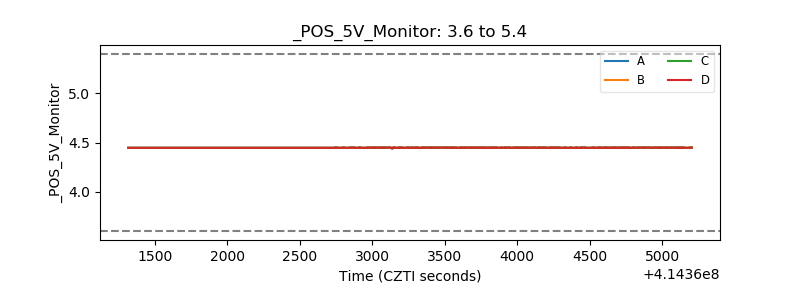 |
| _ROLL_ROT | 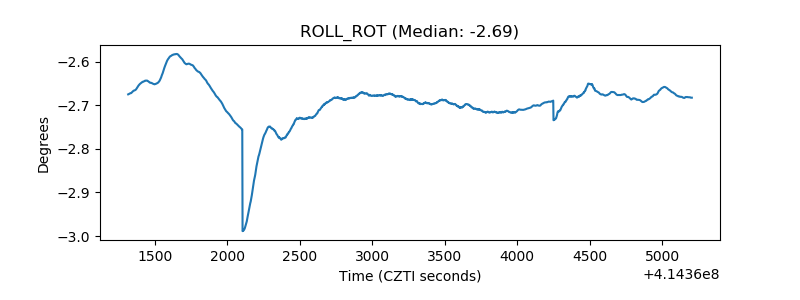 |
| _Roll_DEC | 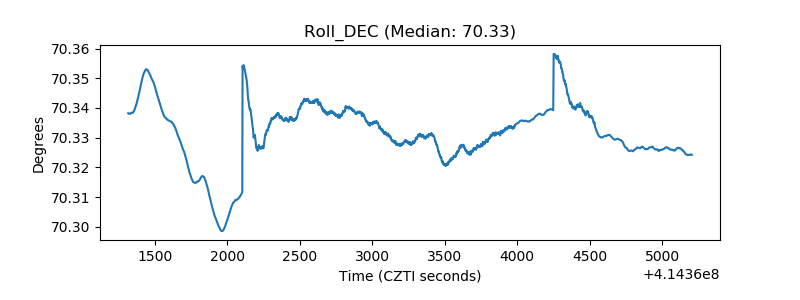 |
| _Roll_RA | 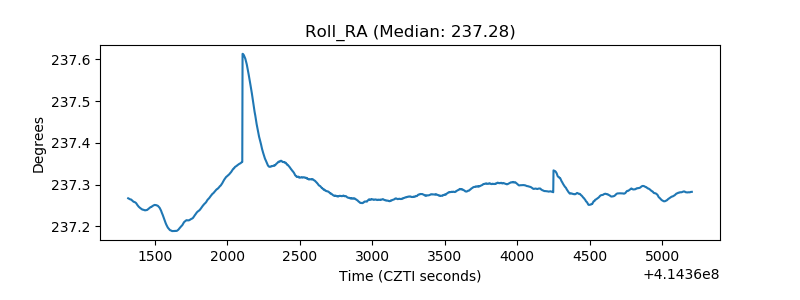 |
| Veto Counter | 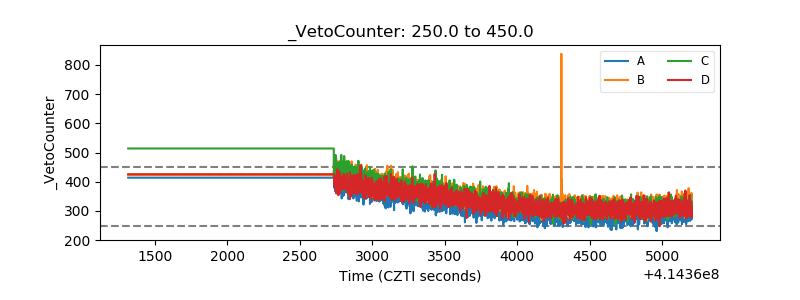 |