| Param | Original file | Final file |
|---|---|---|
| Filename | modeM0/AS1A12_054T03_9000005516_39963cztM0_level2.fits | modeM0/AS1A12_054T03_9000005516_39963cztM0_level2_quad_clean.evt |
| Size (bytes) | 137,810,880 | 41,359,680 |
| Size | 131.4 MB | 39.4 MB |
| Events in quadrant A | 1,298,348 | 274,584 |
| Events in quadrant B | 1,201,954 | 282,965 |
| Events in quadrant C | 1,189,651 | 272,193 |
| Events in quadrant D | 1,221,898 | 249,934 |
| Mode M9 | |||
|---|---|---|---|
| Quadrant | BADHDUFLAG | Total packets | Discarded packets |
| A | 0 | 16 | 0 |
| B | 0 | 16 | 0 |
| C | 0 | 16 | 0 |
| D | 0 | 16 | 0 |
| Mode SS | |||
|---|---|---|---|
| Quadrant | BADHDUFLAG | Total packets | Discarded packets |
| A | 0 | 50 | 0 |
| B | 0 | 50 | 0 |
| C | 0 | 50 | 0 |
| D | 0 | 50 | 0 |
| Mode M0 | |||
|---|---|---|---|
| Quadrant | BADHDUFLAG | Total packets | Discarded packets |
| A | 0 | 5248 | 2 |
| B | 0 | 5086 | 1 |
| C | 0 | 4918 | 1 |
| D | 0 | 5225 | 1 |
| Quadrant | Total seconds | Saturated seconds | Saturation percentage |
|---|---|---|---|
| A | 2401 | 8 | 0.333195% |
| B | 2401 | 9 | 0.374844% |
| C | 2401 | 4 | 0.166597% |
| D | 2401 | 15 | 0.624740% |
Noise dominated data is calculated using 1-second bins in cleaned event files. If a bin has >2000 counts, and if more than 50% of those come from <1% of pixels, then it is considered to be noise-dominated and hence unusable.
| Quadrant | # 1 sec bins | Bins with >0 counts | Bins with >2000 counts | High rate bins dominated by noise | Noise dominated (total time) | Noise dominated (detector-on time) | Marked lightcurve |
|---|---|---|---|---|---|---|---|
| A | 4044 | 2402 | 2 | 2 | 0.05% | 0.08% | 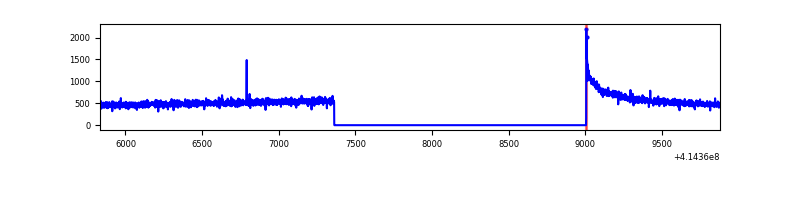 |
| B | 4044 | 2402 | 5 | 5 | 0.12% | 0.21% | 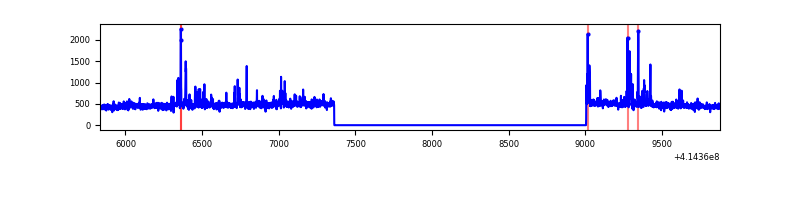 |
| C | 4044 | 2402 | 5 | 5 | 0.12% | 0.21% | 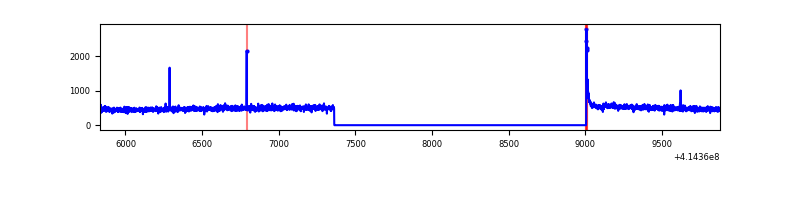 |
| D | 4044 | 2402 | 11 | 11 | 0.27% | 0.46% | 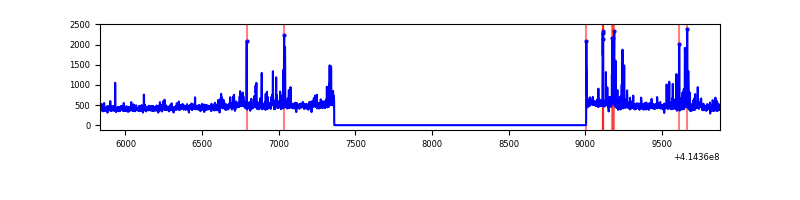 |
Top three noisy pixels from each quadrant. If the there are fewer than three noisy pixels in the level2.evt file, extra rows are filled as -1
| Pixel properties | Quadrant properties | ||||||
|---|---|---|---|---|---|---|---|
| Quadrant | DetID | PixID | Counts | Sigma | Mean | Median | Sigma |
| A | 10 | 83 | 206099 | 3475.77 | 280 | 275 | 59.2 |
| A | 13 | 252 | 4900 | 78.1 | 280 | 275 | 59.2 |
| A | 3 | 137 | 3095 | 47.62 | 280 | 275 | 59.2 |
| B | 4 | 171 | 61330 | 1084.65 | 277 | 269 | 56.3 |
| B | 5 | 255 | 38522 | 679.5 | 277 | 269 | 56.3 |
| B | 4 | 170 | 7718 | 132.32 | 277 | 269 | 56.3 |
| C | 15 | 214 | 101567 | 1557.18 | 273 | 274 | 65.0 |
| C | 0 | 10 | 11666 | 175.13 | 273 | 274 | 65.0 |
| C | 9 | 187 | 6812 | 100.51 | 273 | 274 | 65.0 |
| D | 2 | 250 | 66522 | 980.61 | 273 | 266 | 67.6 |
| D | 12 | 227 | 34884 | 512.36 | 273 | 266 | 67.6 |
| D | 2 | 249 | 20473 | 299.07 | 273 | 266 | 67.6 |
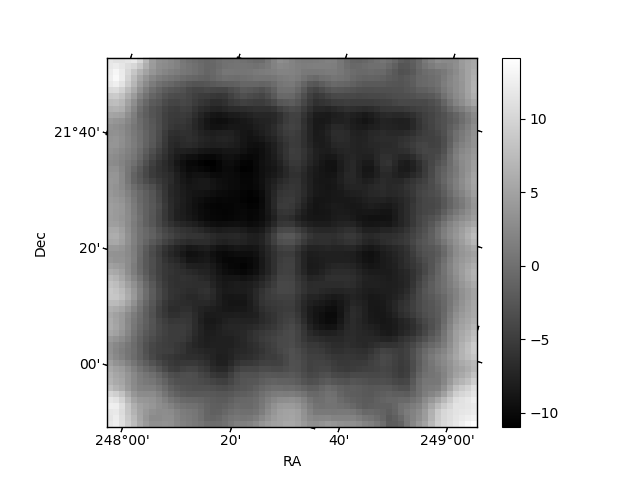
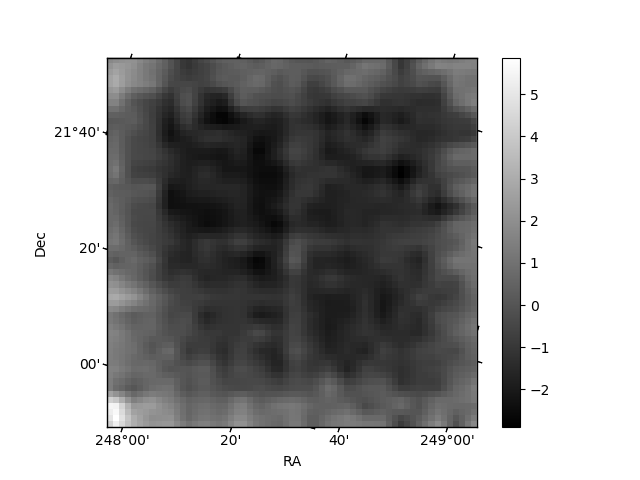
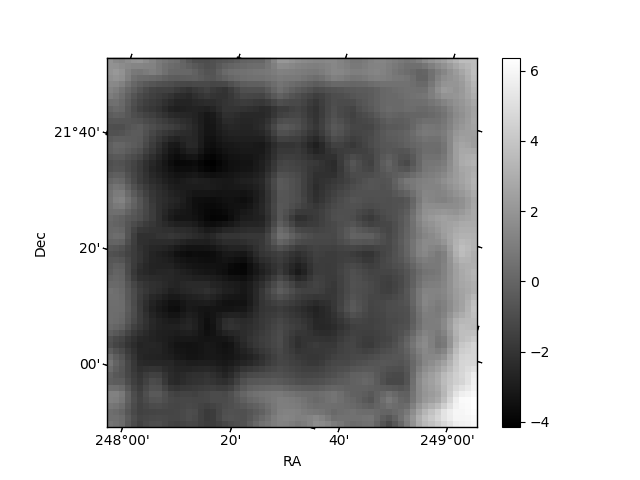
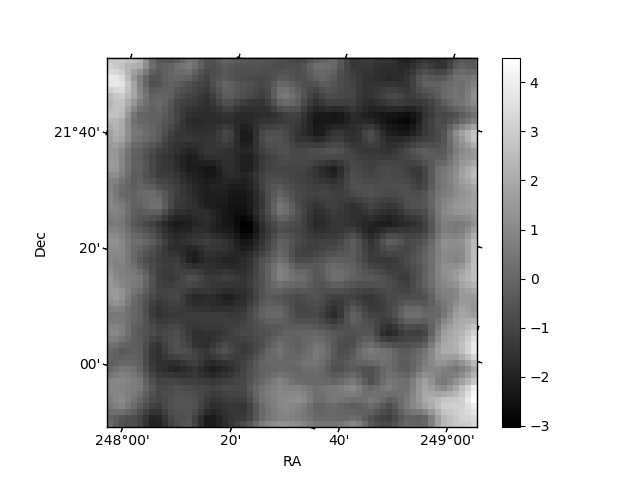
Histogram calculated using DETX and DETY for each event in the final _common_clean file
| Quadrant A | 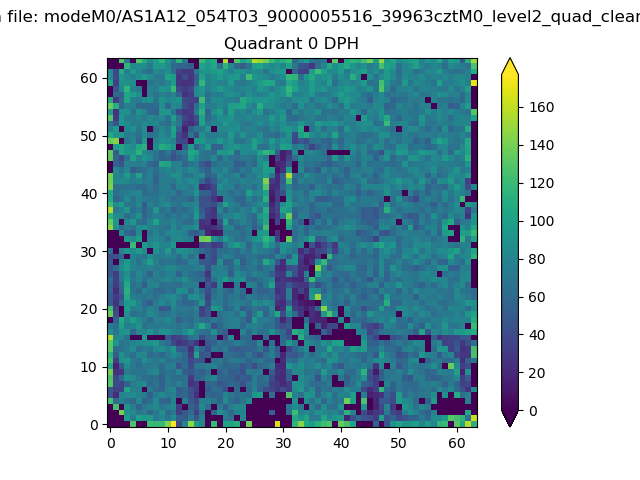 |
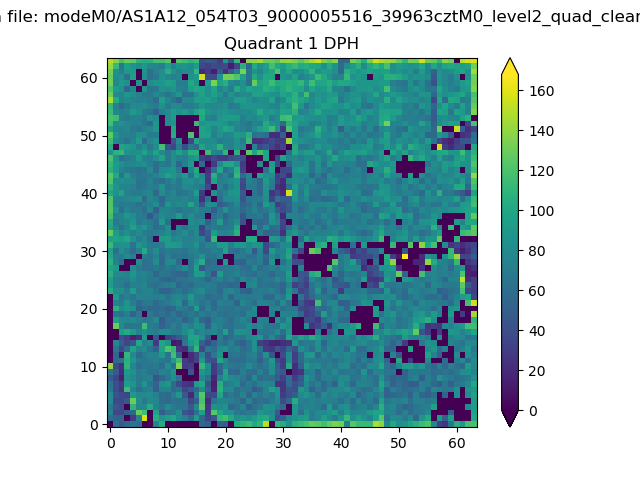 |
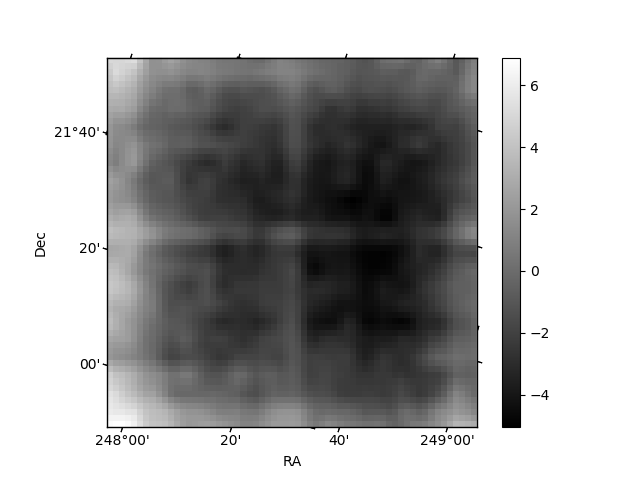
Quadrant B |
|---|---|---|---|
| Quadrant D | 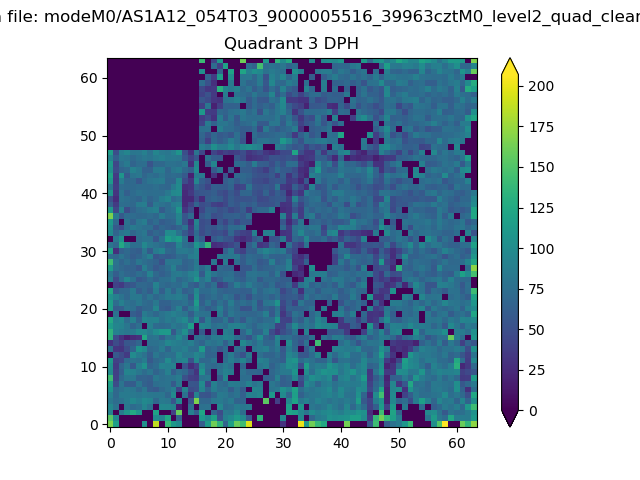 |
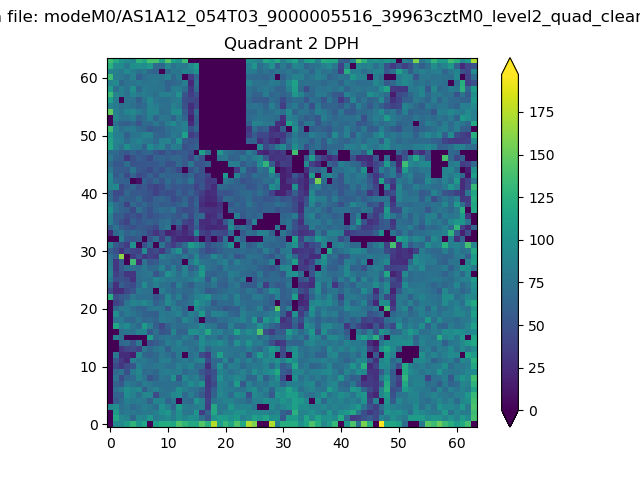 |
Quadrant C |
| Plot type | Count rate plots | Images |
|---|---|---|
| Comparison with Poisson distribution Blue bars denote a histogram of data divided into 1 sec bins. Red curve is a Poisson curve with rate = median count rate of data. |
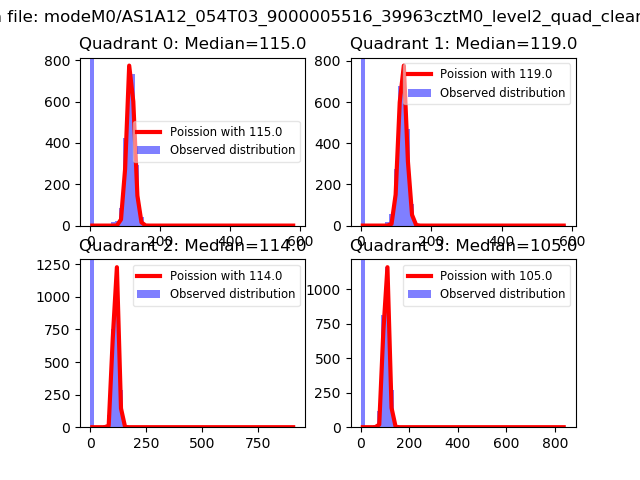 |
 |
| Quadrant-wise count rates Data is divided into 100 sec bins |
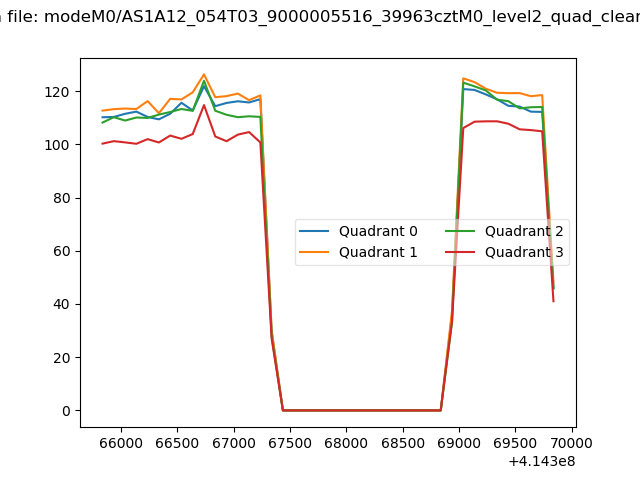 |
|
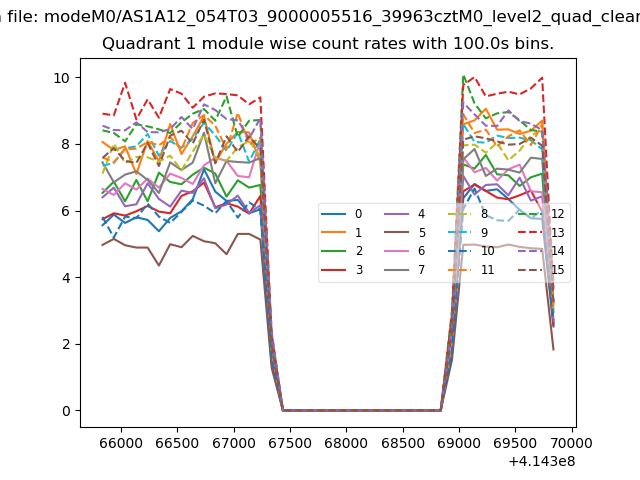
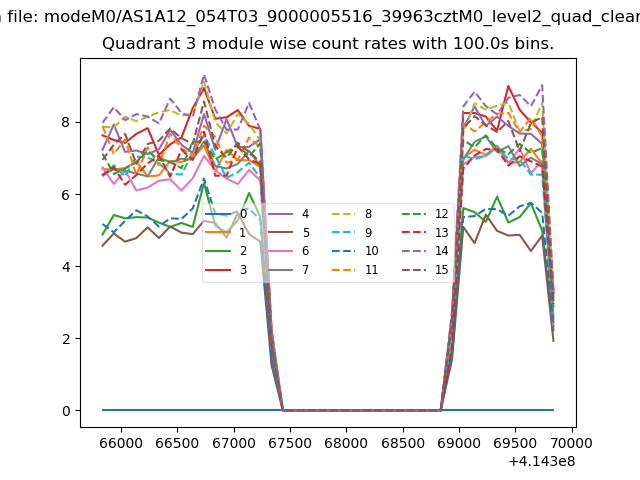
| Module-wise count rates for Quadrant A Data is divided into 100 sec bins |
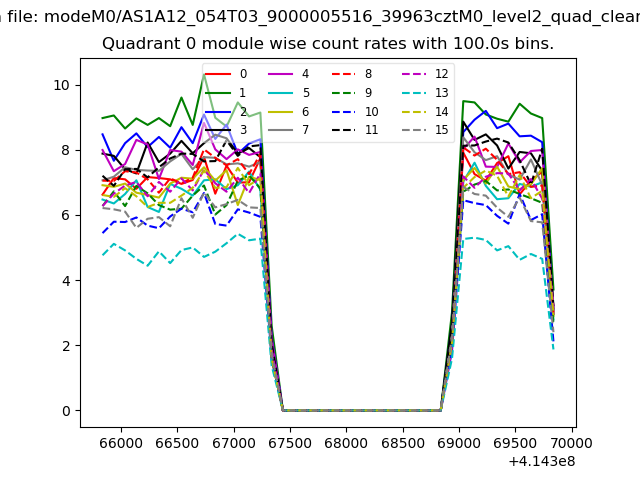 |
 |
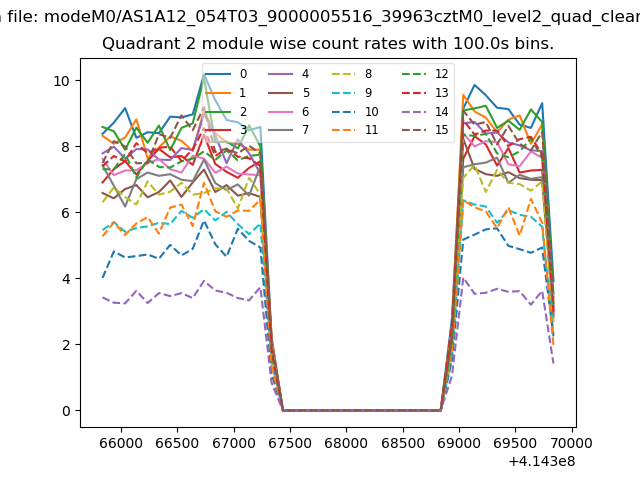
| Module-wise count rates for Quadrant B Data is divided into 100 sec bins |
 |
 |
| Module-wise count rates for Quadrant C Data is divided into 100 sec bins |
 |
 |
| Module-wise count rates for Quadrant D Data is divided into 100 sec bins |
 |
 |
| Parameter | Plot |
|---|---|
| CZT HV Monitor | 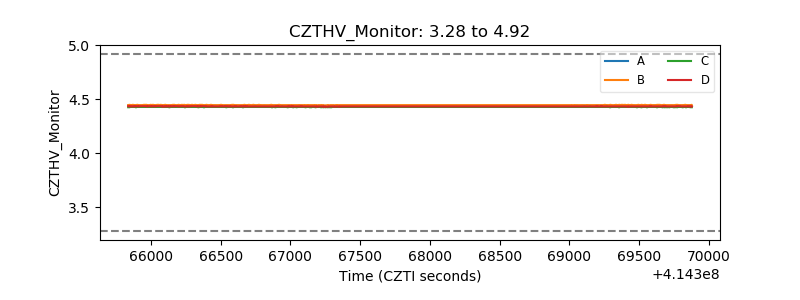 |
| D_VDD | 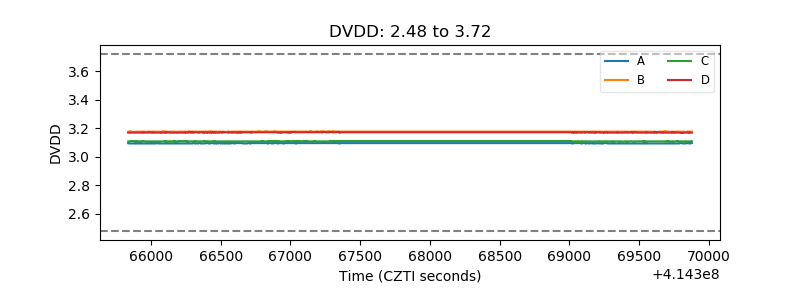 |
| Temperature 1 | 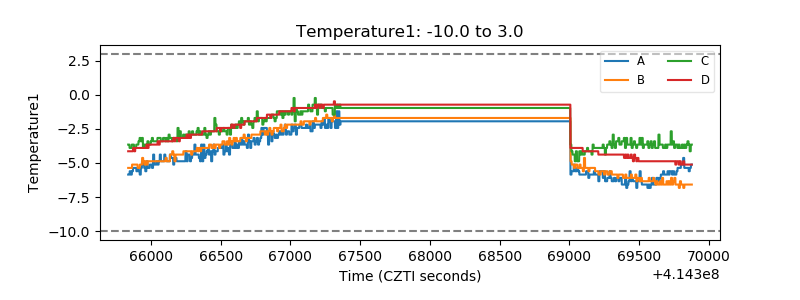 |
| Veto HV Monitor | 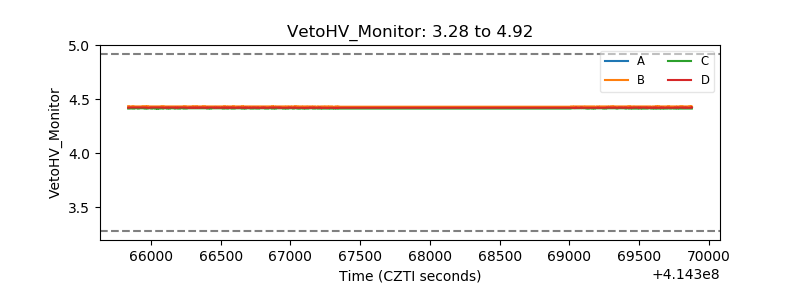 |
| Veto LLD | 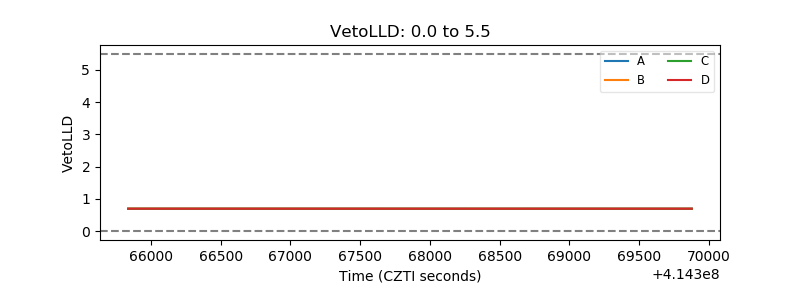 |
| Alpha Counter | 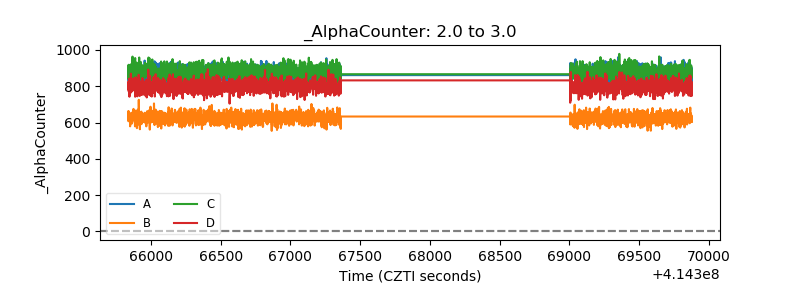 |
| _CPM_Rate | 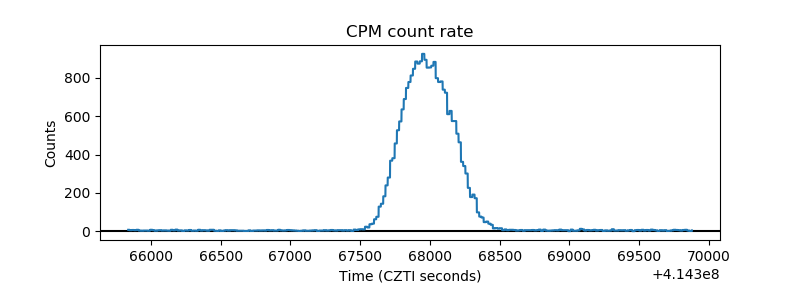 |
| CZT Counter | 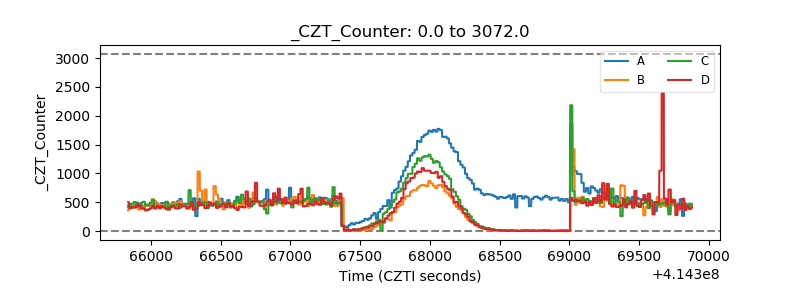 |
| +2.5 Volts monitor | 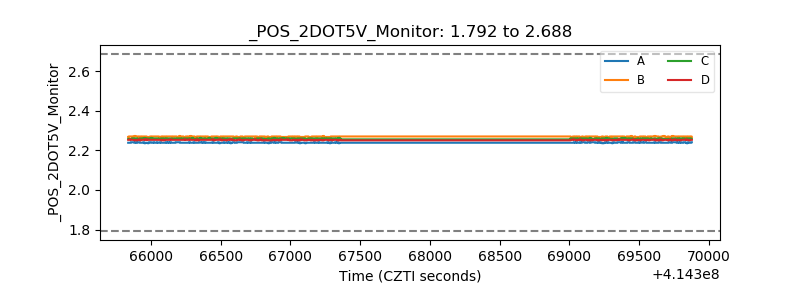 |
| +5 Volts monitor |  |
| _ROLL_ROT | 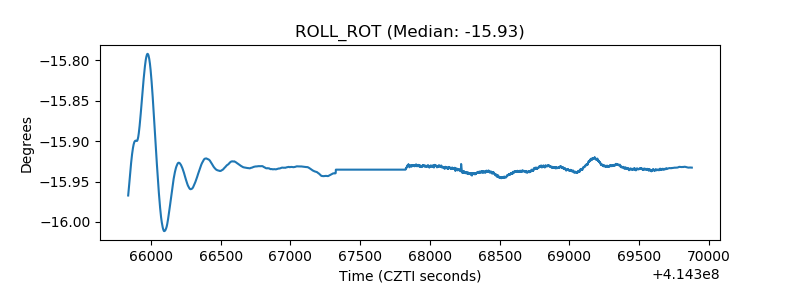 |
| _Roll_DEC | 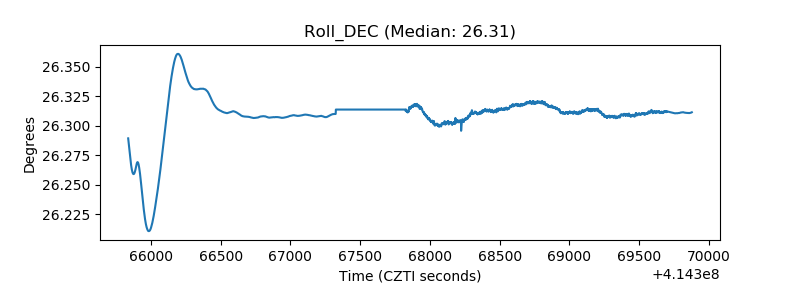 |
| _Roll_RA | 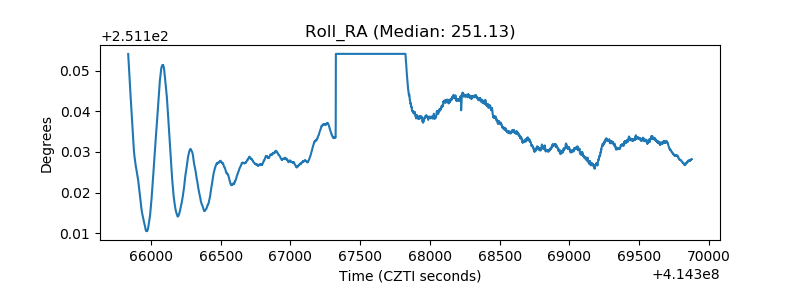 |
| Veto Counter | 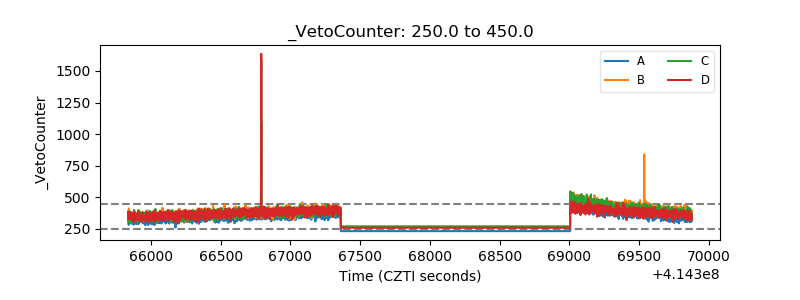 |