| Param | Original file | Final file |
|---|---|---|
| Filename | modeM0/AS1A12_054T03_9000005516_39965cztM0_level2.fits | modeM0/AS1A12_054T03_9000005516_39965cztM0_level2_quad_clean.evt |
| Size (bytes) | 303,269,760 | 91,068,480 |
| Size | 289.2 MB | 86.8 MB |
| Events in quadrant A | 2,766,225 | 605,934 |
| Events in quadrant B | 2,518,913 | 628,249 |
| Events in quadrant C | 2,810,355 | 601,366 |
| Events in quadrant D | 2,712,799 | 546,831 |
| Mode M9 | |||
|---|---|---|---|
| Quadrant | BADHDUFLAG | Total packets | Discarded packets |
| A | 0 | 28 | 0 |
| B | 0 | 28 | 0 |
| C | 0 | 28 | 0 |
| D | 0 | 29 | 0 |
| Mode SS | |||
|---|---|---|---|
| Quadrant | BADHDUFLAG | Total packets | Discarded packets |
| A | 0 | 110 | 0 |
| B | 0 | 110 | 0 |
| C | 0 | 110 | 0 |
| D | 0 | 110 | 0 |
| Mode M0 | |||
|---|---|---|---|
| Quadrant | BADHDUFLAG | Total packets | Discarded packets |
| A | 0 | 11624 | 3 |
| B | 0 | 11286 | 2 |
| C | 0 | 12048 | 2 |
| D | 0 | 12018 | 2 |
| Quadrant | Total seconds | Saturated seconds | Saturation percentage |
|---|---|---|---|
| A | 5358 | 16 | 0.298619% |
| B | 5358 | 31 | 0.578574% |
| C | 5358 | 9 | 0.167973% |
| D | 5358 | 58 | 1.082493% |
Noise dominated data is calculated using 1-second bins in cleaned event files. If a bin has >2000 counts, and if more than 50% of those come from <1% of pixels, then it is considered to be noise-dominated and hence unusable.
| Quadrant | # 1 sec bins | Bins with >0 counts | Bins with >2000 counts | High rate bins dominated by noise | Noise dominated (total time) | Noise dominated (detector-on time) | Marked lightcurve |
|---|---|---|---|---|---|---|---|
| A | 7122 | 5359 | 11 | 11 | 0.15% | 0.21% | 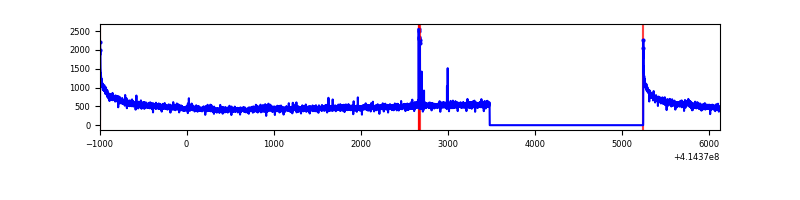 |
| B | 7122 | 5359 | 23 | 23 | 0.32% | 0.43% | 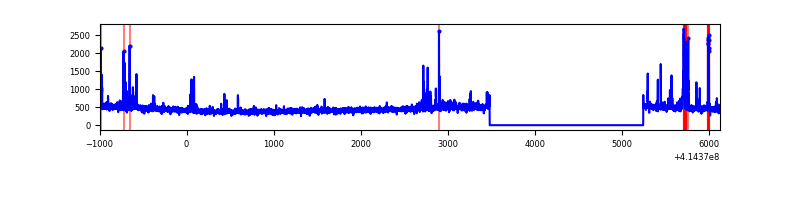 |
| C | 7122 | 5359 | 5 | 5 | 0.07% | 0.09% | 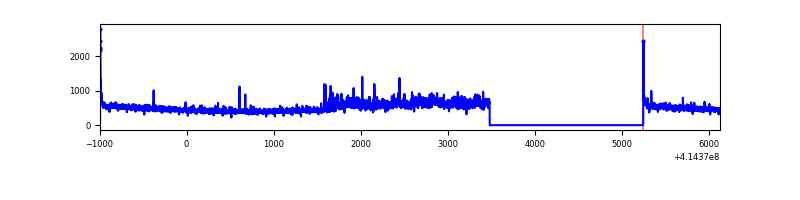 |
| D | 7122 | 5359 | 56 | 56 | 0.79% | 1.04% | 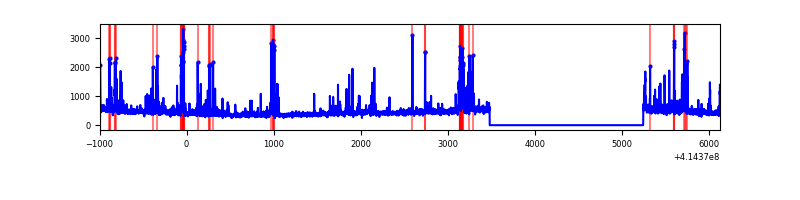 |
Top three noisy pixels from each quadrant. If the there are fewer than three noisy pixels in the level2.evt file, extra rows are filled as -1
| Pixel properties | Quadrant properties | ||||||
|---|---|---|---|---|---|---|---|
| Quadrant | DetID | PixID | Counts | Sigma | Mean | Median | Sigma |
| A | 10 | 83 | 450269 | 3746.29 | 587 | 577 | 120.0 |
| A | 15 | 223 | 18933 | 152.92 | 587 | 577 | 120.0 |
| A | 13 | 252 | 14455 | 115.61 | 587 | 577 | 120.0 |
| B | 5 | 255 | 96469 | 828.87 | 589 | 575 | 115.7 |
| B | 4 | 171 | 91052 | 782.05 | 589 | 575 | 115.7 |
| B | 12 | 111 | 14375 | 119.28 | 589 | 575 | 115.7 |
| C | 9 | 54 | 291653 | 2145.14 | 576 | 582 | 135.7 |
| C | 15 | 214 | 222459 | 1635.19 | 576 | 582 | 135.7 |
| C | 0 | 10 | 23924 | 172.03 | 576 | 582 | 135.7 |
| D | 2 | 250 | 235683 | 1691.34 | 568 | 554 | 139.0 |
| D | 12 | 227 | 194153 | 1392.61 | 568 | 554 | 139.0 |
| D | 2 | 234 | 26880 | 189.37 | 568 | 554 | 139.0 |
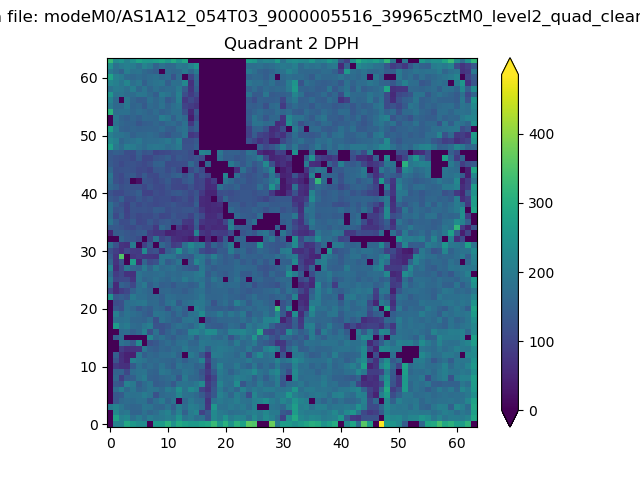
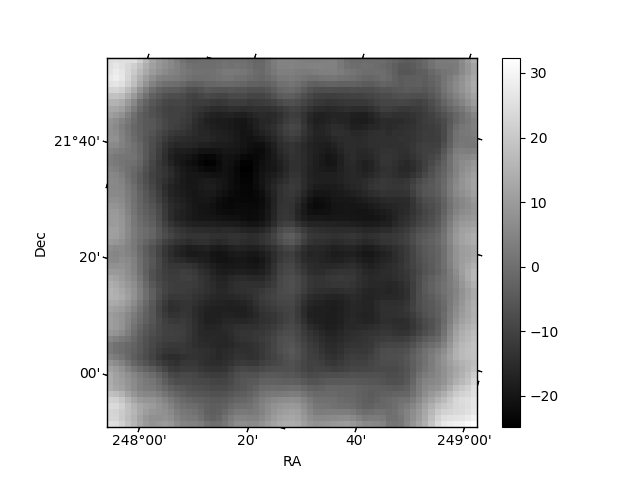
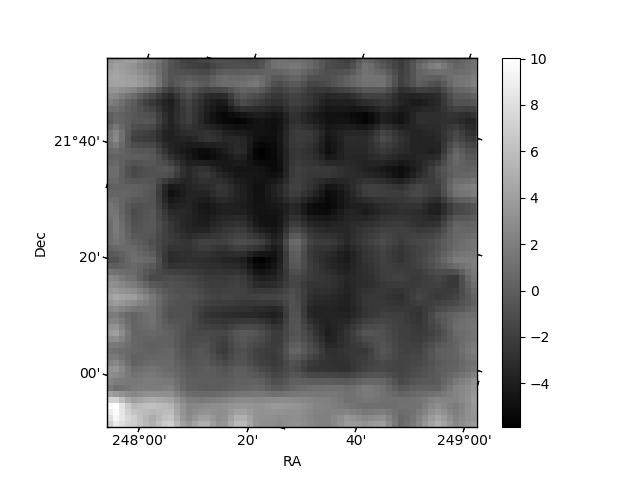
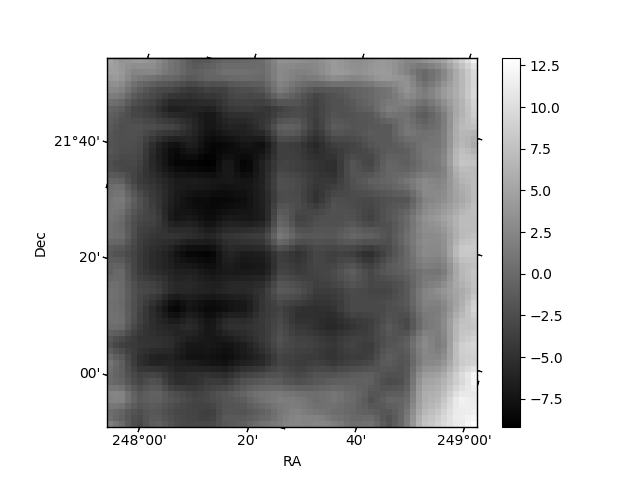
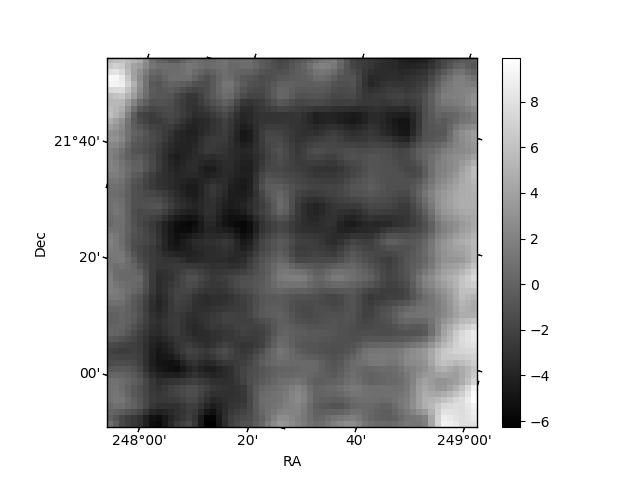
Histogram calculated using DETX and DETY for each event in the final _common_clean file
| Quadrant A | 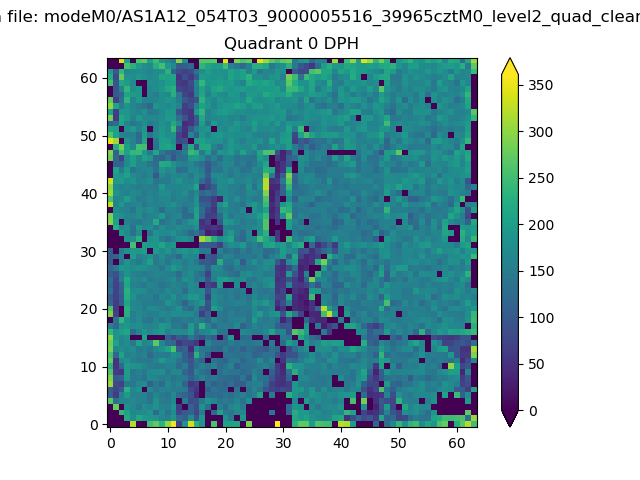 |
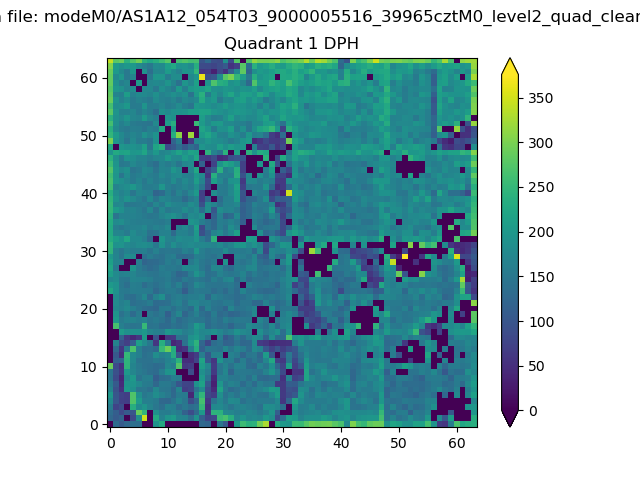 |
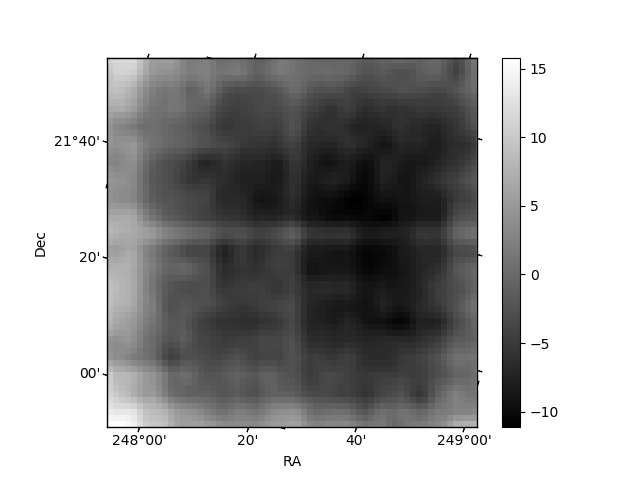
Quadrant B |
|---|---|---|---|
| Quadrant D | 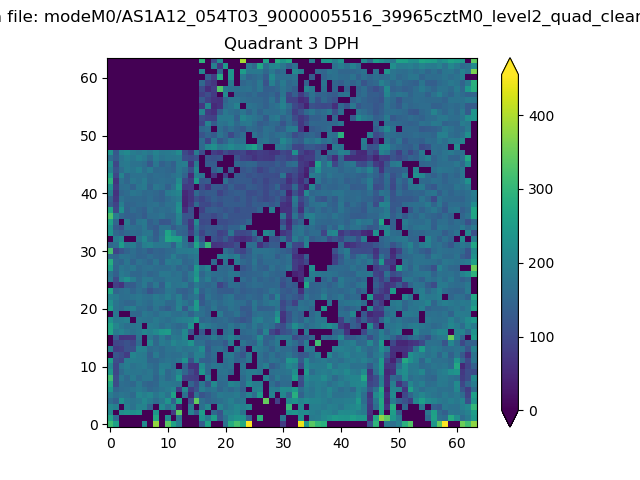 |
 |
Quadrant C |
| Plot type | Count rate plots | Images |
|---|---|---|
| Comparison with Poisson distribution Blue bars denote a histogram of data divided into 1 sec bins. Red curve is a Poisson curve with rate = median count rate of data. |
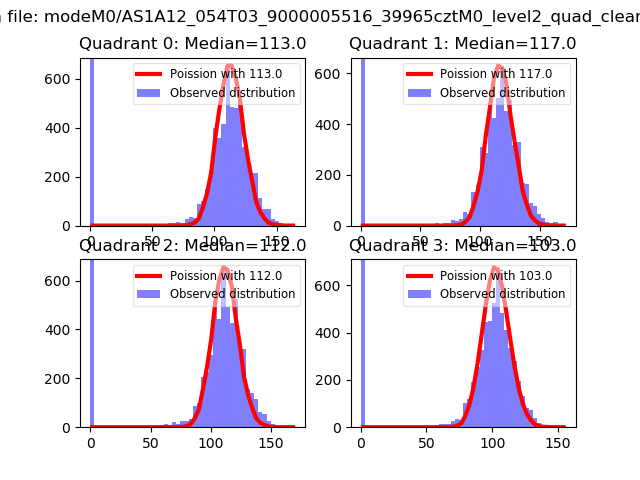 |
 |
| Quadrant-wise count rates Data is divided into 100 sec bins |
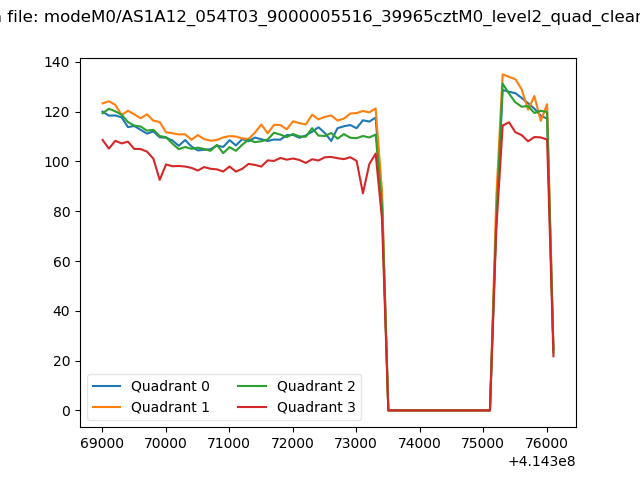 |
|
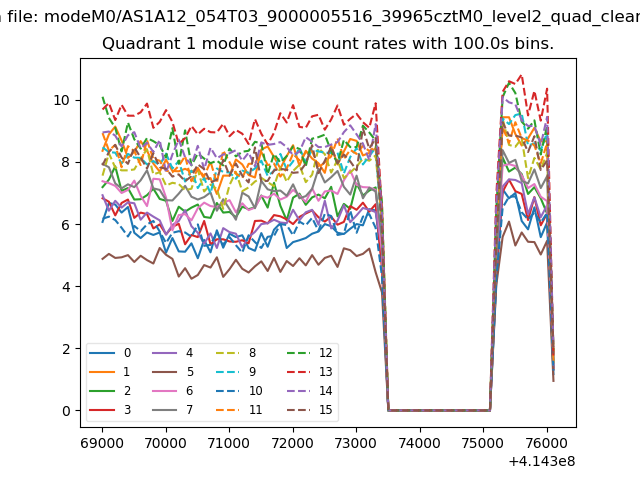
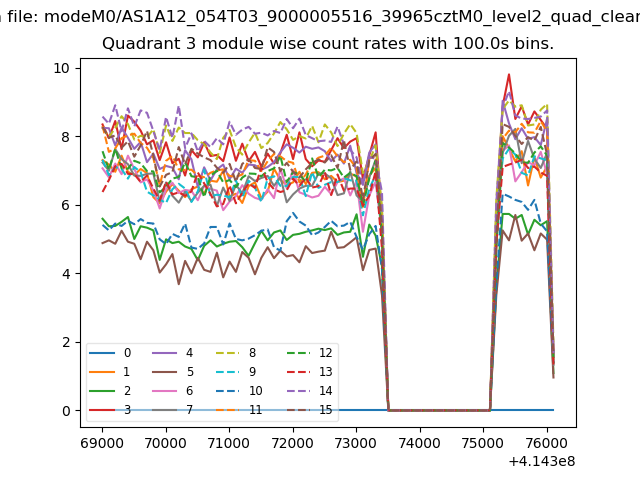
| Module-wise count rates for Quadrant A Data is divided into 100 sec bins |
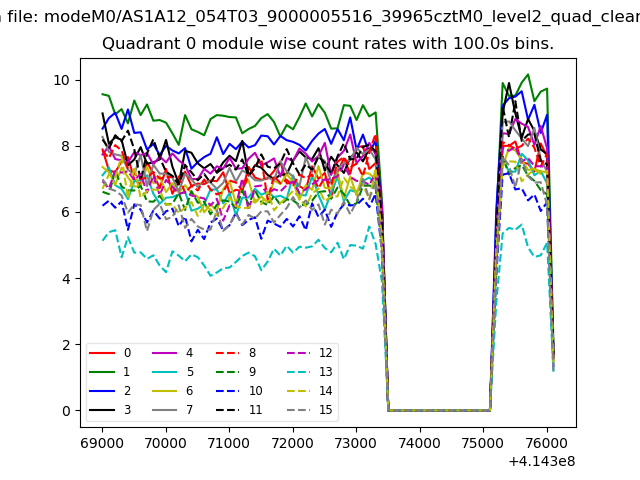 |
 |
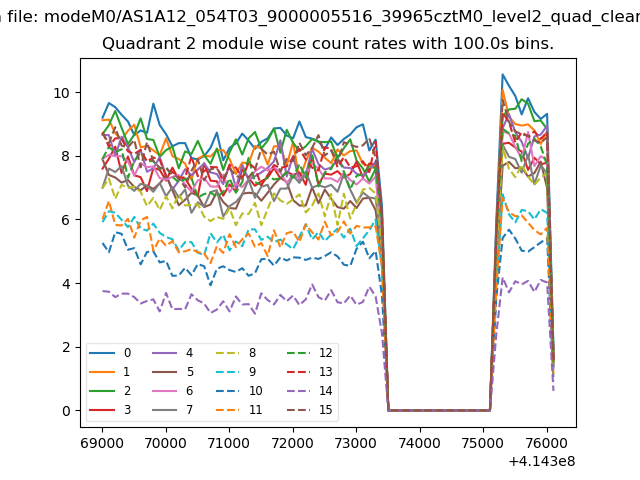
| Module-wise count rates for Quadrant B Data is divided into 100 sec bins |
 |
 |
| Module-wise count rates for Quadrant C Data is divided into 100 sec bins |
 |
 |
| Module-wise count rates for Quadrant D Data is divided into 100 sec bins |
 |
 |
| Parameter | Plot |
|---|---|
| CZT HV Monitor | 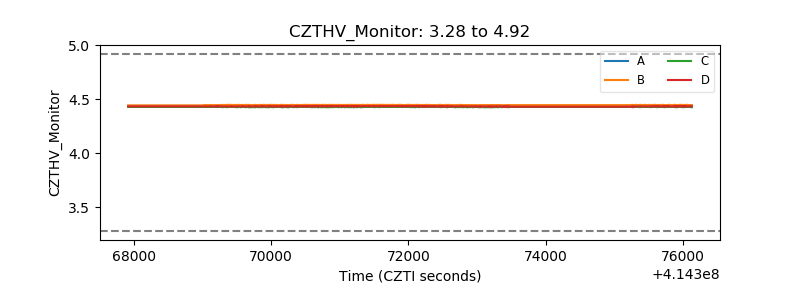 |
| D_VDD | 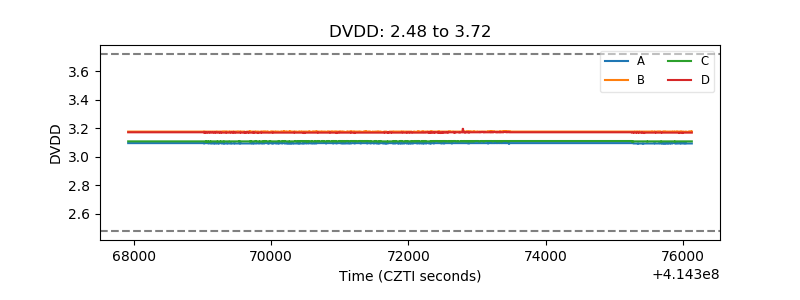 |
| Temperature 1 | 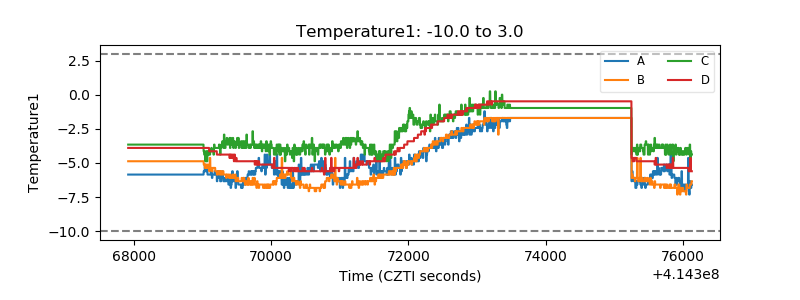 |
| Veto HV Monitor | 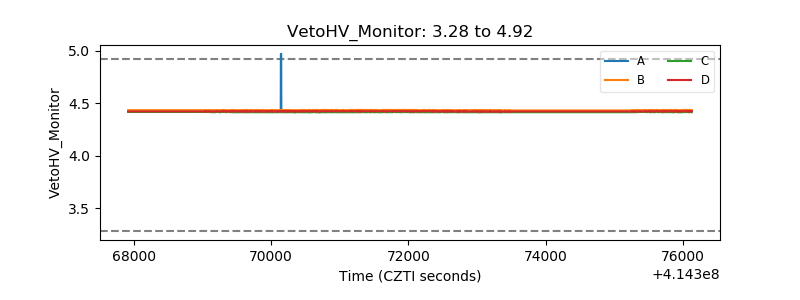 |
| Veto LLD | 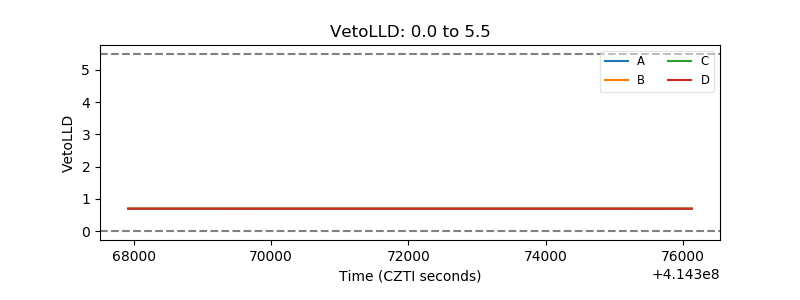 |
| Alpha Counter | 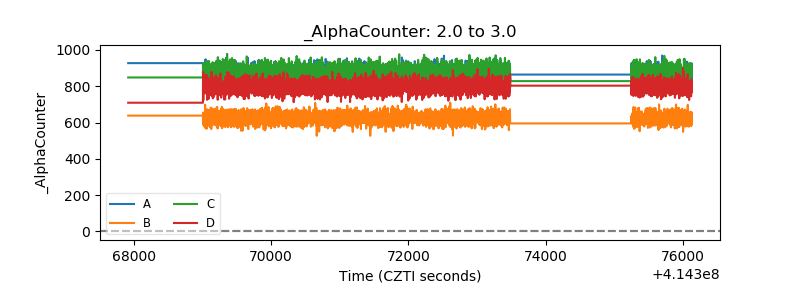 |
| _CPM_Rate | 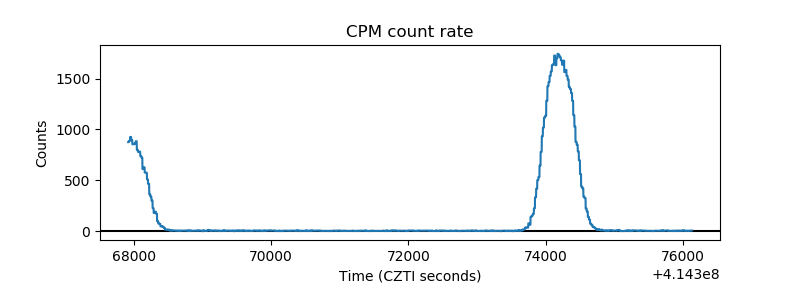 |
| CZT Counter | 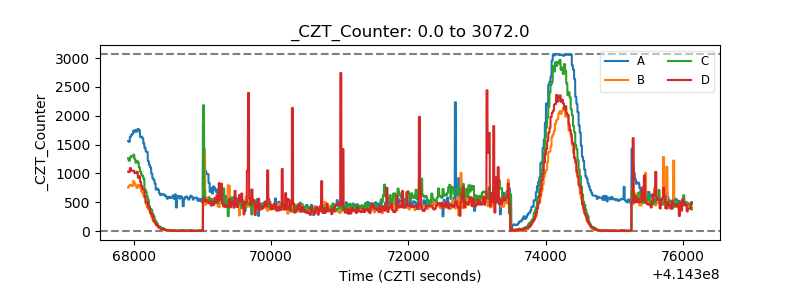 |
| +2.5 Volts monitor | 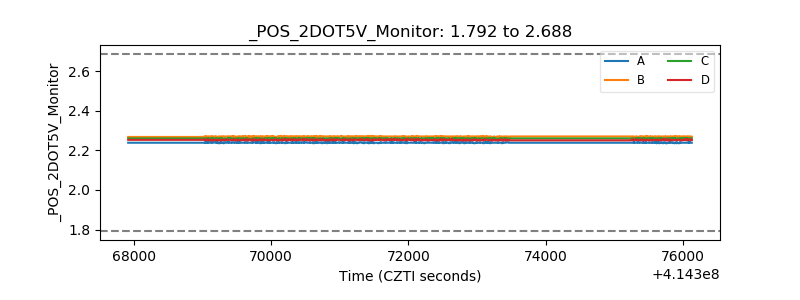 |
| +5 Volts monitor | 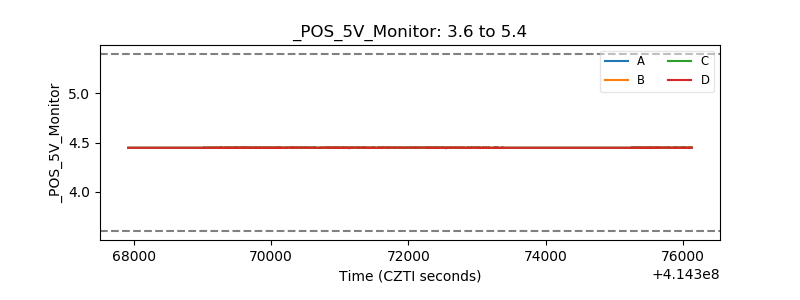 |
| _ROLL_ROT | 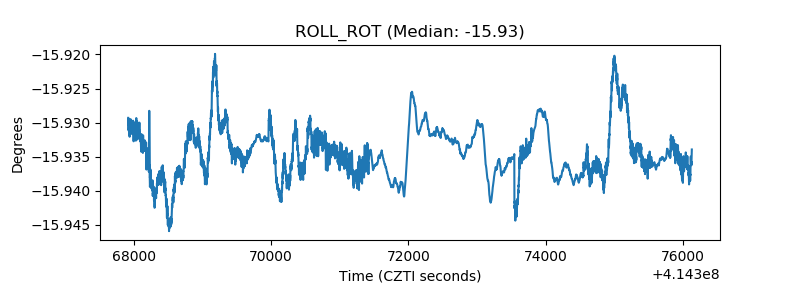 |
| _Roll_DEC | 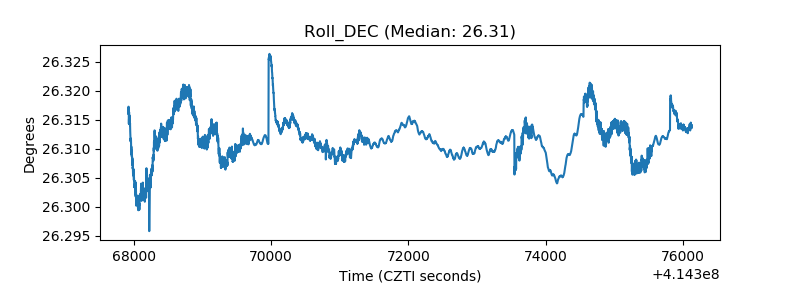 |
| _Roll_RA | 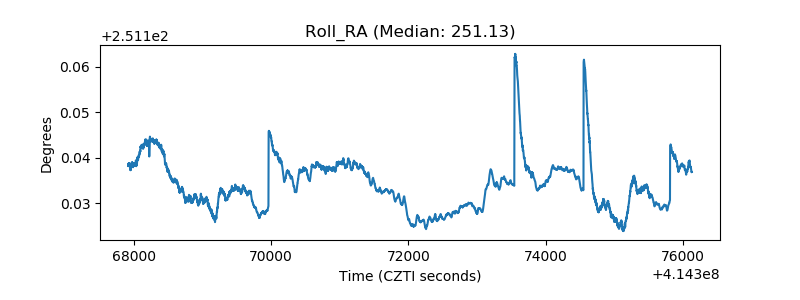 |
| Veto Counter | 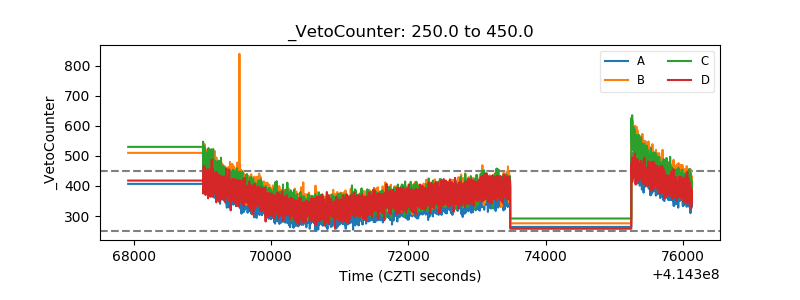 |