| Param | Original file | Final file |
|---|---|---|
| Filename | modeM0/AS1A12_054T03_9000005516_39966cztM0_level2.fits | modeM0/AS1A12_054T03_9000005516_39966cztM0_level2_quad_clean.evt |
| Size (bytes) | 348,255,360 | 95,739,840 |
| Size | 332.1 MB | 91.3 MB |
| Events in quadrant A | 2,877,366 | 651,486 |
| Events in quadrant B | 3,695,087 | 638,711 |
| Events in quadrant C | 2,686,782 | 643,264 |
| Events in quadrant D | 3,202,533 | 579,933 |
| Mode M9 | |||
|---|---|---|---|
| Quadrant | BADHDUFLAG | Total packets | Discarded packets |
| A | 0 | 33 | 0 |
| B | 0 | 33 | 0 |
| C | 0 | 33 | 0 |
| D | 0 | 34 | 0 |
| Mode SS | |||
|---|---|---|---|
| Quadrant | BADHDUFLAG | Total packets | Discarded packets |
| A | 0 | 112 | 0 |
| B | 0 | 112 | 0 |
| C | 0 | 112 | 0 |
| D | 0 | 112 | 0 |
| Mode M0 | |||
|---|---|---|---|
| Quadrant | BADHDUFLAG | Total packets | Discarded packets |
| A | 0 | 12015 | 2 |
| B | 0 | 14794 | 1 |
| C | 0 | 11400 | 1 |
| D | 0 | 13394 | 1 |
| Quadrant | Total seconds | Saturated seconds | Saturation percentage |
|---|---|---|---|
| A | 5515 | 8 | 0.145059% |
| B | 5515 | 383 | 6.944696% |
| C | 5515 | 22 | 0.398912% |
| D | 5515 | 90 | 1.631913% |
Noise dominated data is calculated using 1-second bins in cleaned event files. If a bin has >2000 counts, and if more than 50% of those come from <1% of pixels, then it is considered to be noise-dominated and hence unusable.
| Quadrant | # 1 sec bins | Bins with >0 counts | Bins with >2000 counts | High rate bins dominated by noise | Noise dominated (total time) | Noise dominated (detector-on time) | Marked lightcurve |
|---|---|---|---|---|---|---|---|
| A | 7398 | 5516 | 3 | 3 | 0.04% | 0.05% | 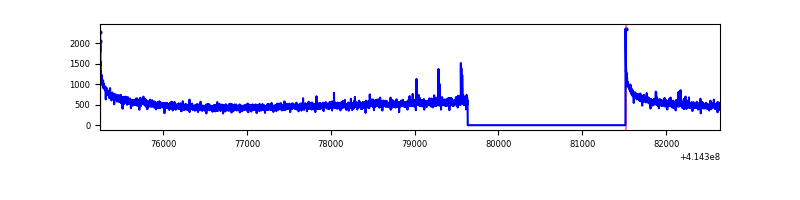 |
| B | 7398 | 5516 | 336 | 336 | 4.54% | 6.09% | 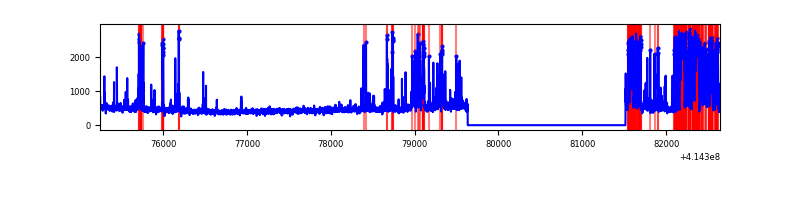 |
| C | 7398 | 5516 | 17 | 17 | 0.23% | 0.31% | 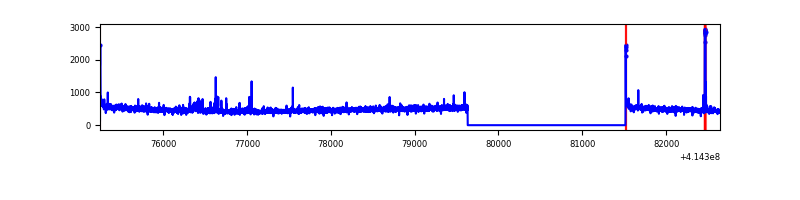 |
| D | 7398 | 5516 | 90 | 90 | 1.22% | 1.63% | 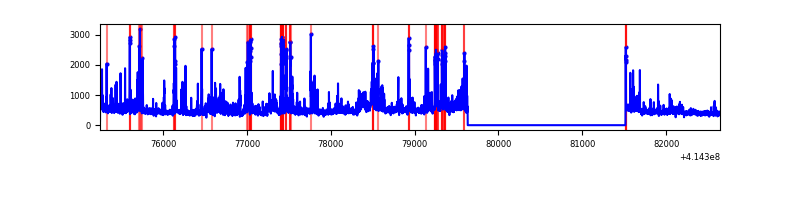 |
Top three noisy pixels from each quadrant. If the there are fewer than three noisy pixels in the level2.evt file, extra rows are filled as -1
| Pixel properties | Quadrant properties | ||||||
|---|---|---|---|---|---|---|---|
| Quadrant | DetID | PixID | Counts | Sigma | Mean | Median | Sigma |
| A | 10 | 83 | 456980 | 3654.73 | 613 | 602 | 124.9 |
| A | 2 | 79 | 17744 | 137.28 | 613 | 602 | 124.9 |
| A | 13 | 248 | 8302 | 61.66 | 613 | 602 | 124.9 |
| B | 4 | 171 | 1008570 | 8776.23 | 601 | 586 | 114.9 |
| B | 5 | 255 | 287802 | 2500.71 | 601 | 586 | 114.9 |
| B | 4 | 170 | 31187 | 266.43 | 601 | 586 | 114.9 |
| C | 15 | 214 | 229036 | 1639.55 | 600 | 605 | 139.3 |
| C | 9 | 54 | 80719 | 575.01 | 600 | 605 | 139.3 |
| C | 0 | 10 | 25752 | 180.49 | 600 | 605 | 139.3 |
| D | 12 | 227 | 366852 | 2526.23 | 591 | 575 | 145.0 |
| D | 2 | 249 | 295486 | 2034.02 | 591 | 575 | 145.0 |
| D | 2 | 250 | 169073 | 1162.14 | 591 | 575 | 145.0 |
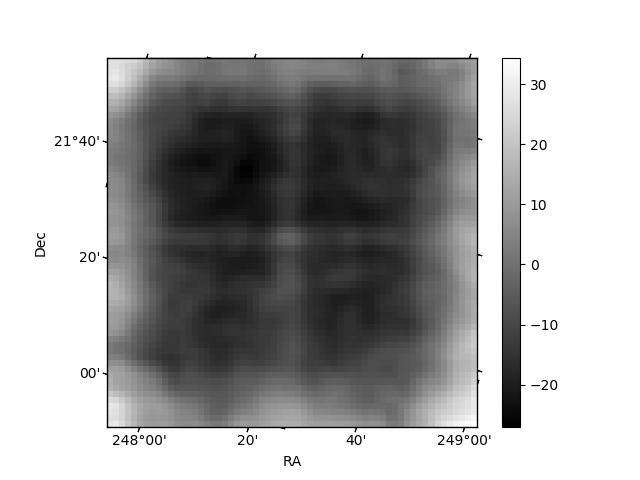
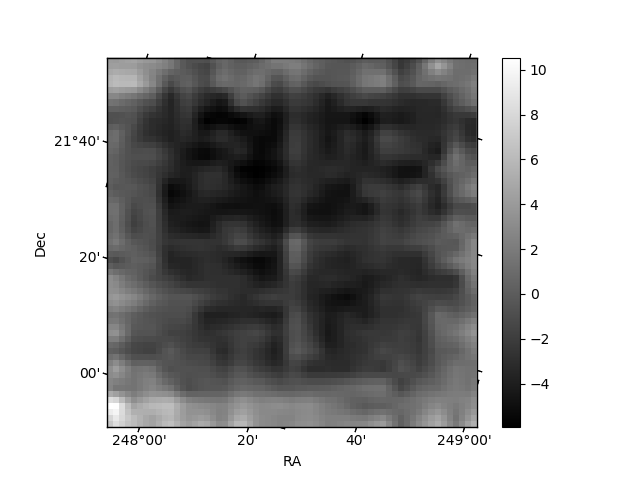
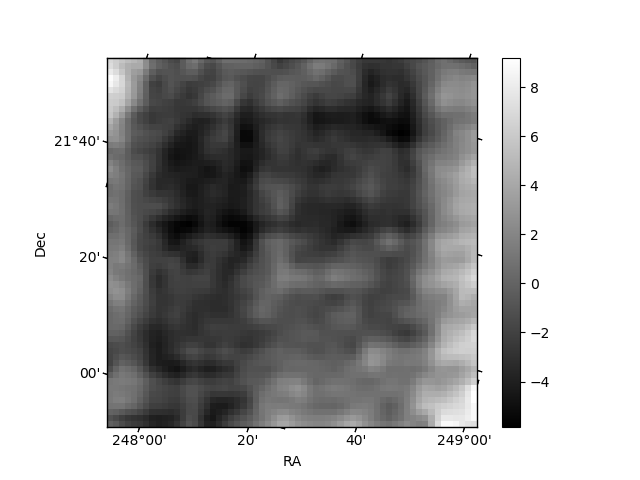
Histogram calculated using DETX and DETY for each event in the final _common_clean file
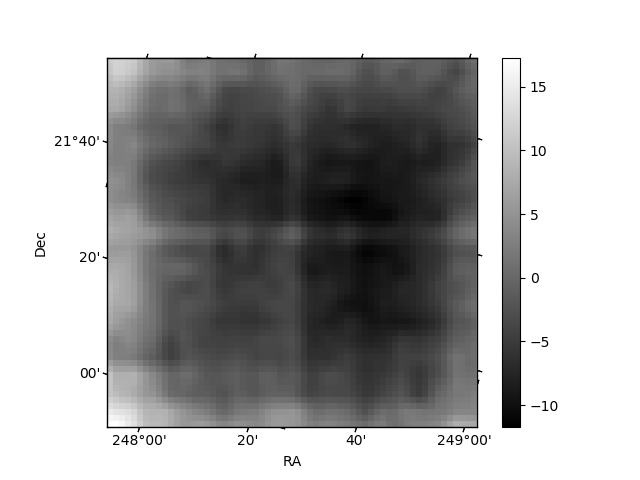
| Quadrant A | 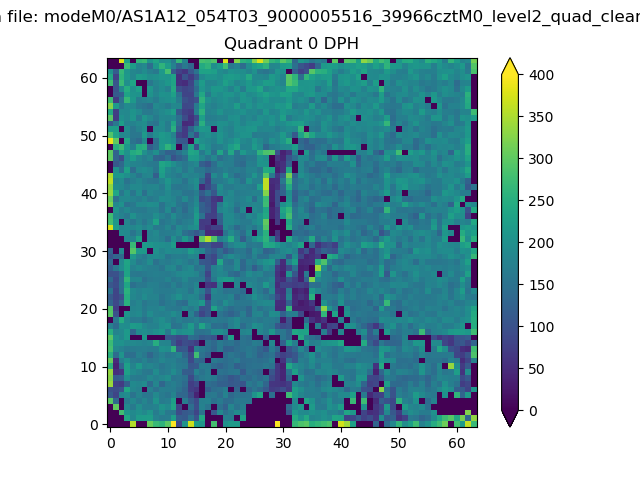 |
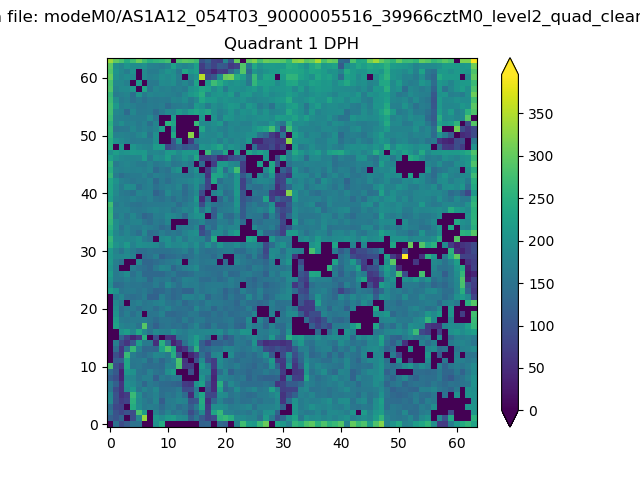 |
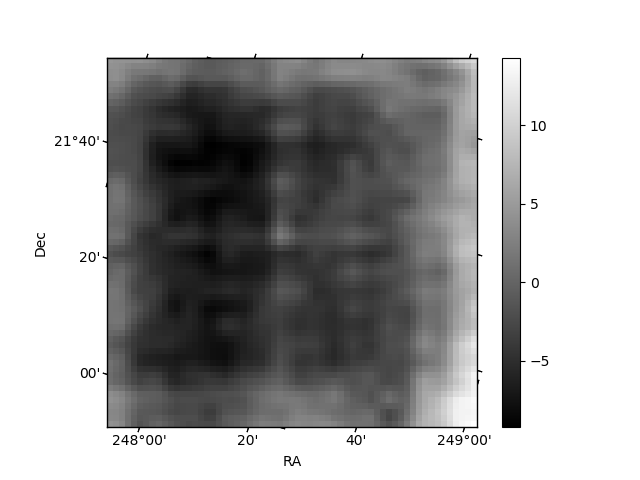
Quadrant B |
|---|---|---|---|
| Quadrant D | 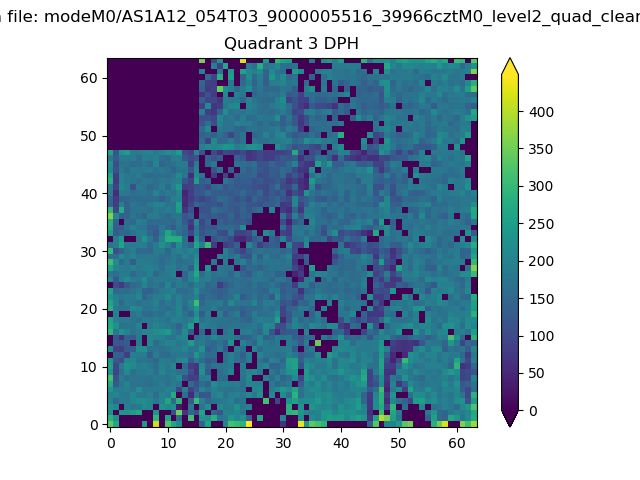 |
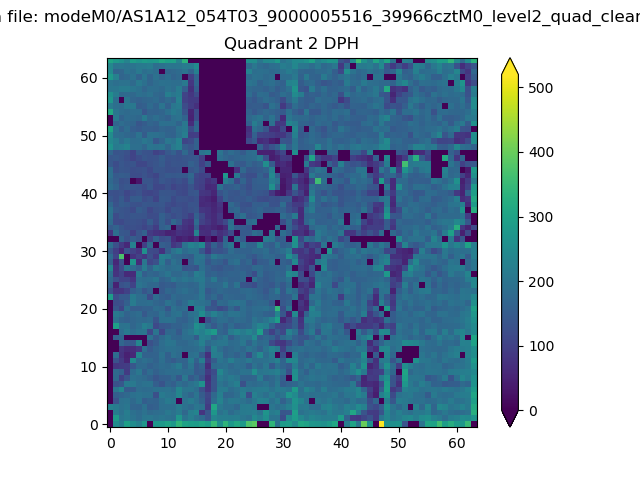 |
Quadrant C |
| Plot type | Count rate plots | Images |
|---|---|---|
| Comparison with Poisson distribution Blue bars denote a histogram of data divided into 1 sec bins. Red curve is a Poisson curve with rate = median count rate of data. |
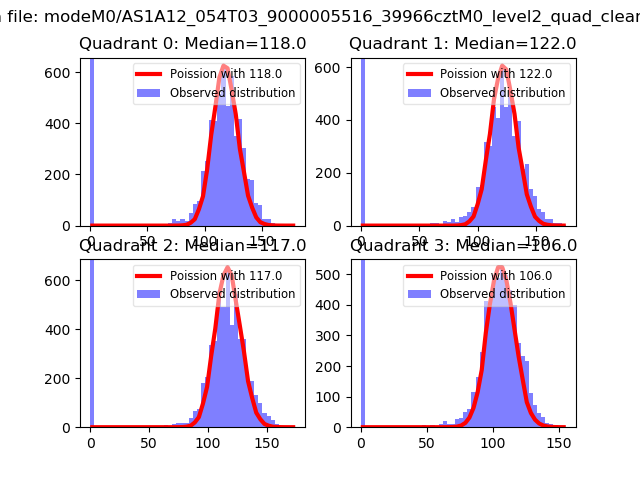 |
 |
| Quadrant-wise count rates Data is divided into 100 sec bins |
 |
|
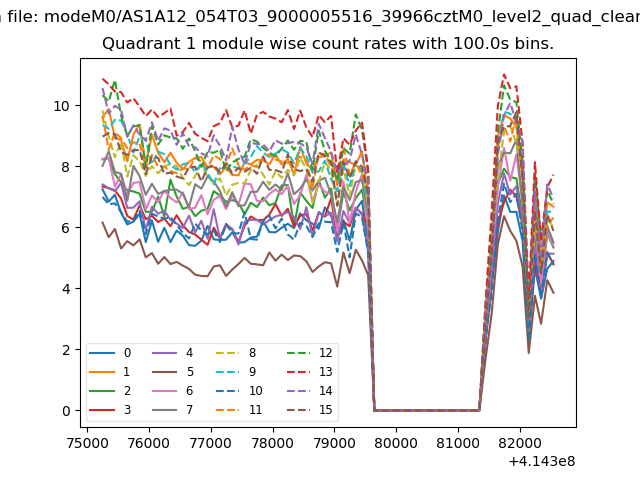
| Module-wise count rates for Quadrant A Data is divided into 100 sec bins |
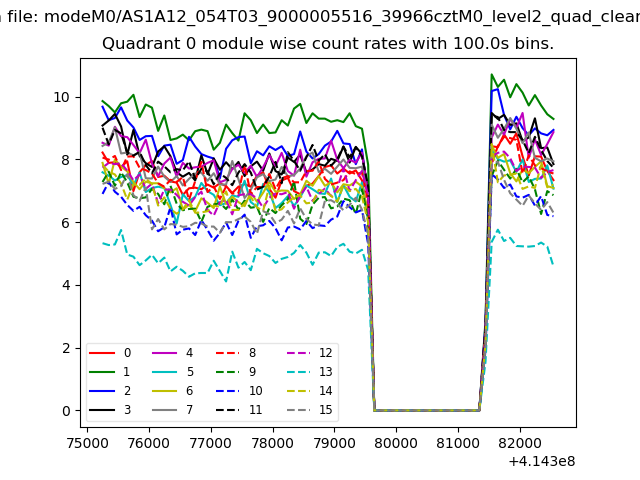 |
 |
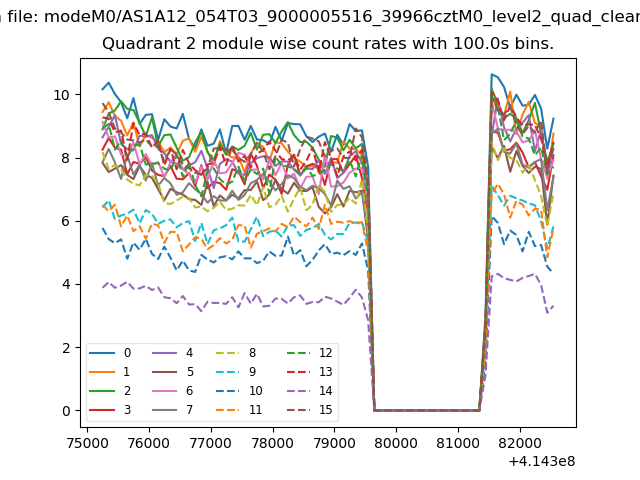
| Module-wise count rates for Quadrant B Data is divided into 100 sec bins |
 |
 |
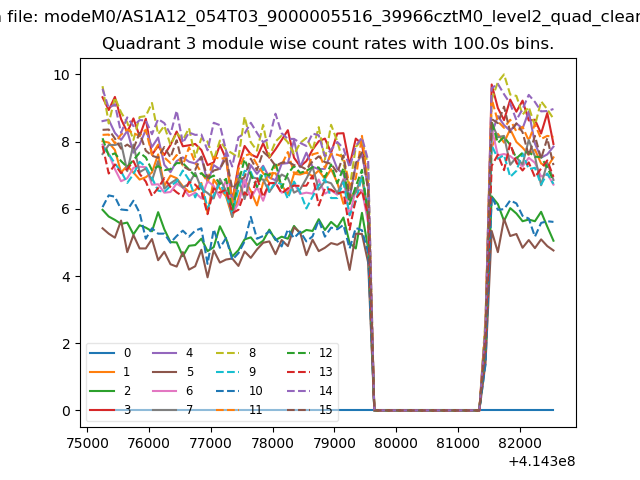
| Module-wise count rates for Quadrant C Data is divided into 100 sec bins |
 |
 |
| Module-wise count rates for Quadrant D Data is divided into 100 sec bins |
 |
 |
| Parameter | Plot |
|---|---|
| CZT HV Monitor | 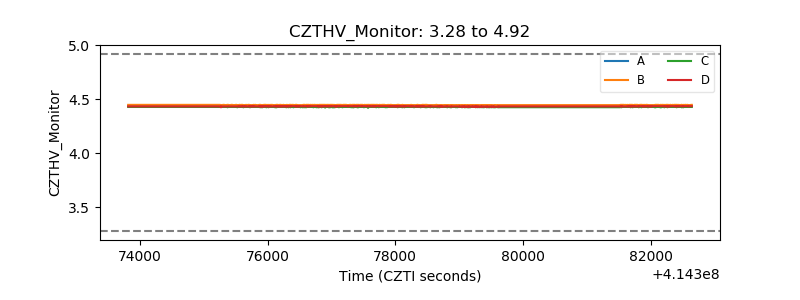 |
| D_VDD | 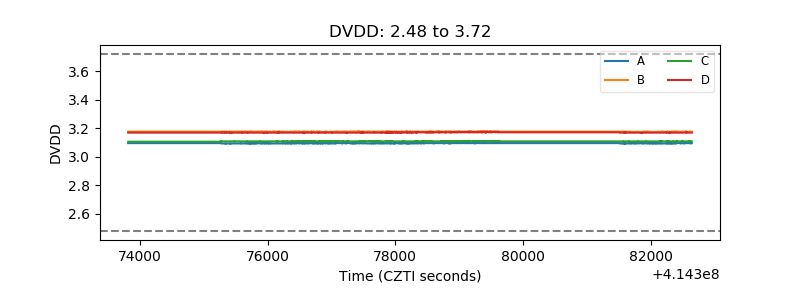 |
| Temperature 1 | 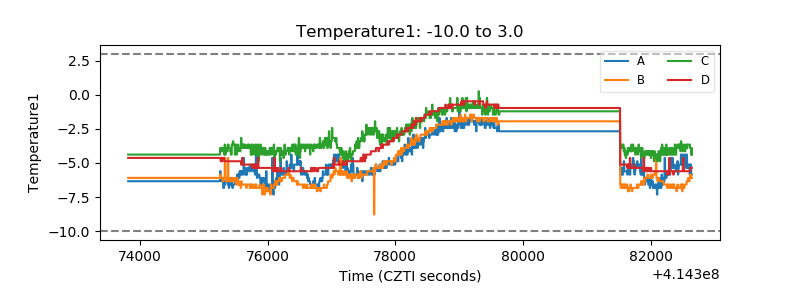 |
| Veto HV Monitor | 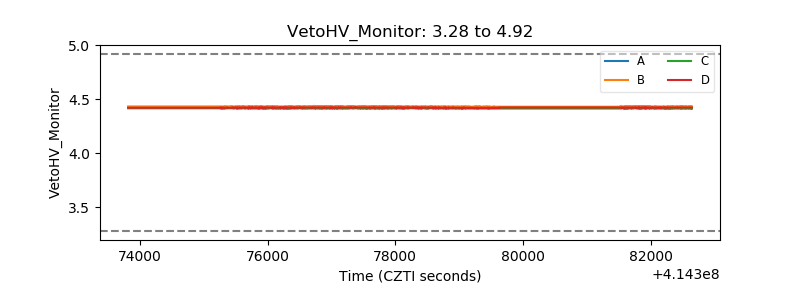 |
| Veto LLD | 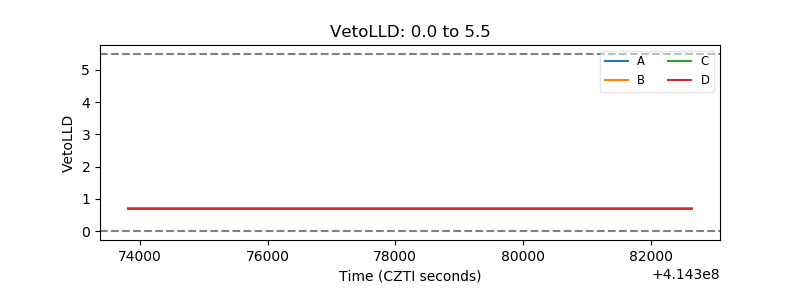 |
| Alpha Counter | 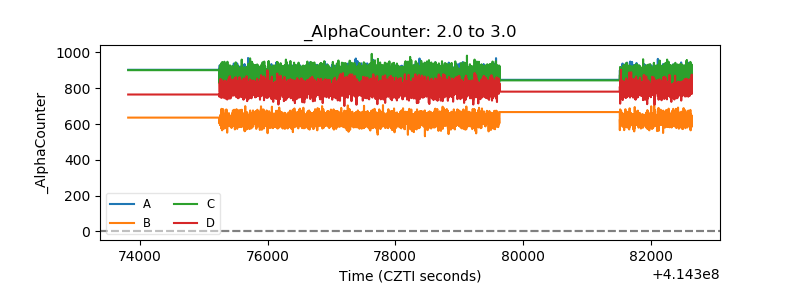 |
| _CPM_Rate | 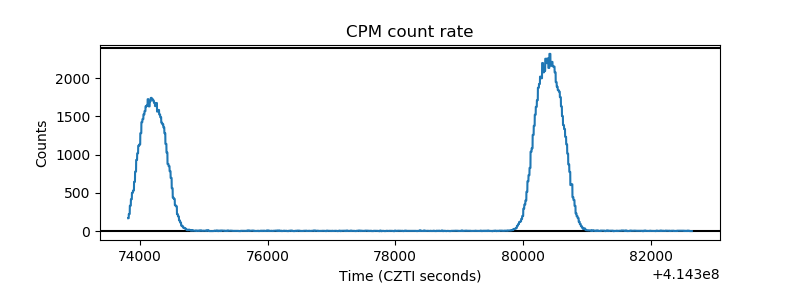 |
| CZT Counter | 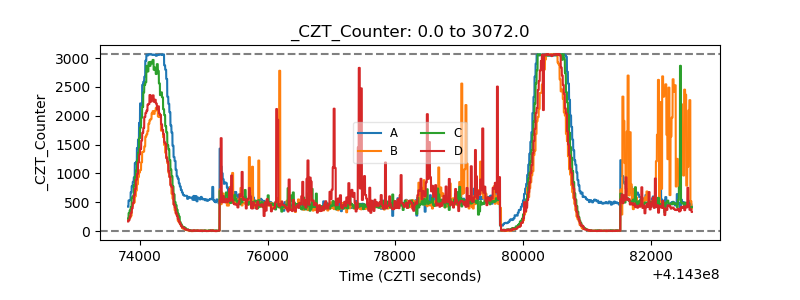 |
| +2.5 Volts monitor | 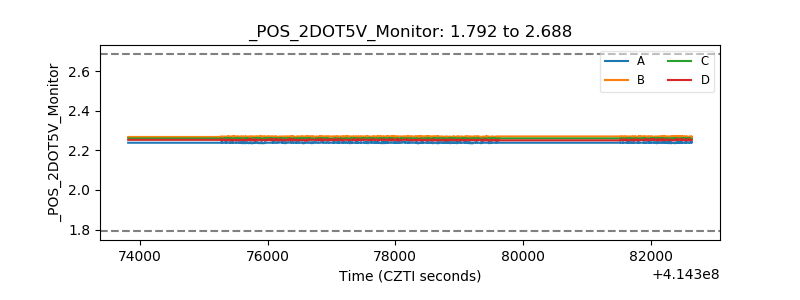 |
| +5 Volts monitor | 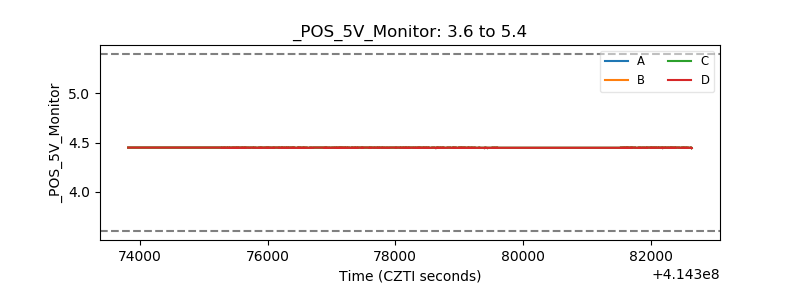 |
| _ROLL_ROT |  |
| _Roll_DEC | 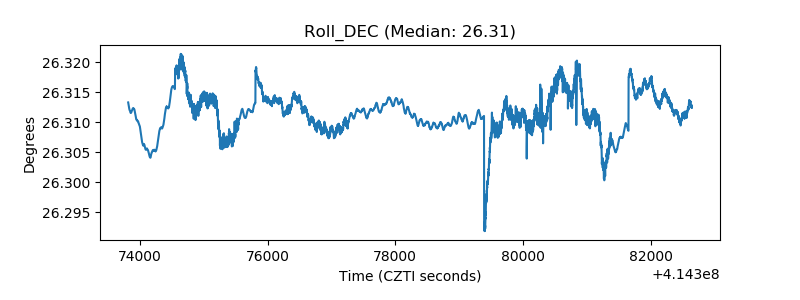 |
| _Roll_RA | 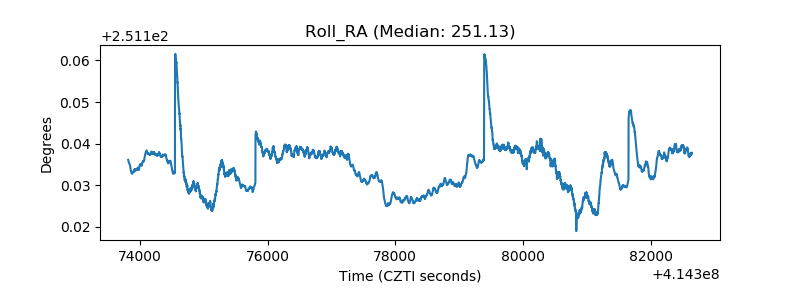 |
| Veto Counter | 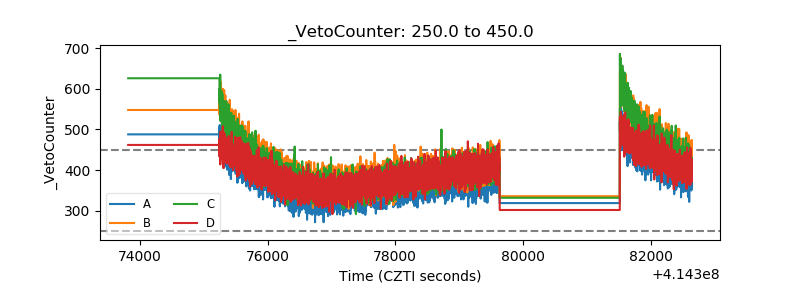 |