| Param | Original file | Final file |
|---|---|---|
| Filename | modeM0/AS1A12_054T03_9000005516_39967cztM0_level2.fits | modeM0/AS1A12_054T03_9000005516_39967cztM0_level2_quad_clean.evt |
| Size (bytes) | 347,613,120 | 94,703,040 |
| Size | 331.5 MB | 90.3 MB |
| Events in quadrant A | 2,895,506 | 652,849 |
| Events in quadrant B | 3,750,682 | 642,927 |
| Events in quadrant C | 2,696,259 | 643,692 |
| Events in quadrant D | 3,107,166 | 553,355 |
| Mode M9 | |||
|---|---|---|---|
| Quadrant | BADHDUFLAG | Total packets | Discarded packets |
| A | 0 | 29 | 0 |
| B | 0 | 29 | 0 |
| C | 0 | 29 | 0 |
| D | 0 | 30 | 0 |
| Mode SS | |||
|---|---|---|---|
| Quadrant | BADHDUFLAG | Total packets | Discarded packets |
| A | 0 | 108 | 0 |
| B | 0 | 108 | 0 |
| C | 0 | 108 | 0 |
| D | 0 | 108 | 0 |
| Mode M0 | |||
|---|---|---|---|
| Quadrant | BADHDUFLAG | Total packets | Discarded packets |
| A | 0 | 11884 | 2 |
| B | 0 | 14702 | 1 |
| C | 0 | 11153 | 1 |
| D | 0 | 13191 | 1 |
| Quadrant | Total seconds | Saturated seconds | Saturation percentage |
|---|---|---|---|
| A | 5361 | 26 | 0.484984% |
| B | 5361 | 386 | 7.200149% |
| C | 5361 | 26 | 0.484984% |
| D | 5361 | 318 | 5.931729% |
Noise dominated data is calculated using 1-second bins in cleaned event files. If a bin has >2000 counts, and if more than 50% of those come from <1% of pixels, then it is considered to be noise-dominated and hence unusable.
| Quadrant | # 1 sec bins | Bins with >0 counts | Bins with >2000 counts | High rate bins dominated by noise | Noise dominated (total time) | Noise dominated (detector-on time) | Marked lightcurve |
|---|---|---|---|---|---|---|---|
| A | 7365 | 5362 | 15 | 15 | 0.20% | 0.28% | 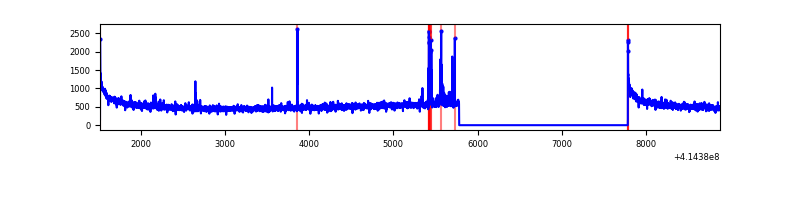 |
| B | 7365 | 5362 | 348 | 348 | 4.73% | 6.49% | 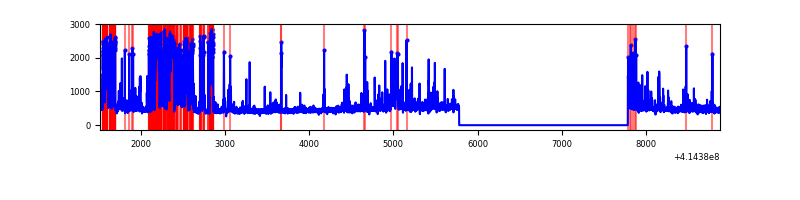 |
| C | 7365 | 5362 | 25 | 25 | 0.34% | 0.47% | 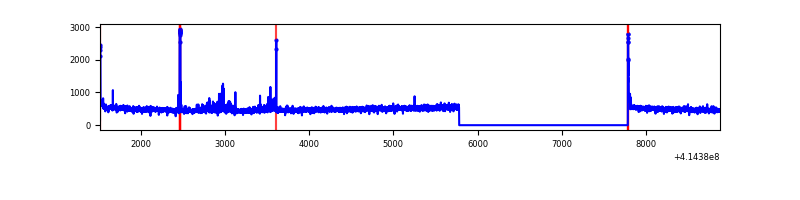 |
| D | 7365 | 5362 | 278 | 278 | 3.77% | 5.18% | 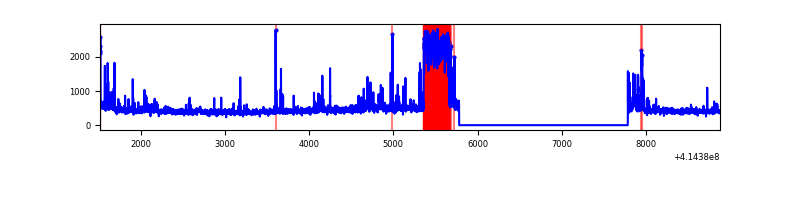 |
Top three noisy pixels from each quadrant. If the there are fewer than three noisy pixels in the level2.evt file, extra rows are filled as -1
| Pixel properties | Quadrant properties | ||||||
|---|---|---|---|---|---|---|---|
| Quadrant | DetID | PixID | Counts | Sigma | Mean | Median | Sigma |
| A | 10 | 83 | 454853 | 3648.57 | 609 | 598 | 124.5 |
| A | 13 | 248 | 41735 | 330.41 | 609 | 598 | 124.5 |
| A | 6 | 10 | 26857 | 210.91 | 609 | 598 | 124.5 |
| B | 4 | 171 | 1047697 | 9183.97 | 596 | 582 | 114.0 |
| B | 5 | 255 | 324716 | 2842.89 | 596 | 582 | 114.0 |
| B | 0 | 245 | 27195 | 233.42 | 596 | 582 | 114.0 |
| C | 15 | 214 | 222713 | 1618.37 | 594 | 598 | 137.2 |
| C | 9 | 54 | 83037 | 600.67 | 594 | 598 | 137.2 |
| C | 0 | 10 | 40127 | 288.02 | 594 | 598 | 137.2 |
| D | 2 | 250 | 733888 | 5410.72 | 558 | 543 | 135.5 |
| D | 2 | 249 | 143363 | 1053.74 | 558 | 543 | 135.5 |
| D | 12 | 227 | 48430 | 353.32 | 558 | 543 | 135.5 |
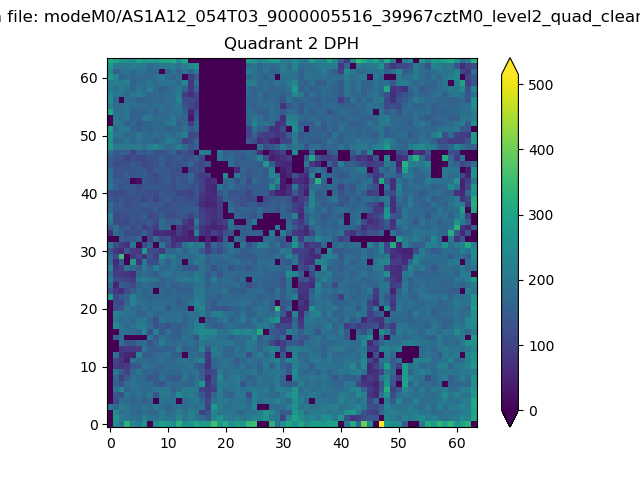
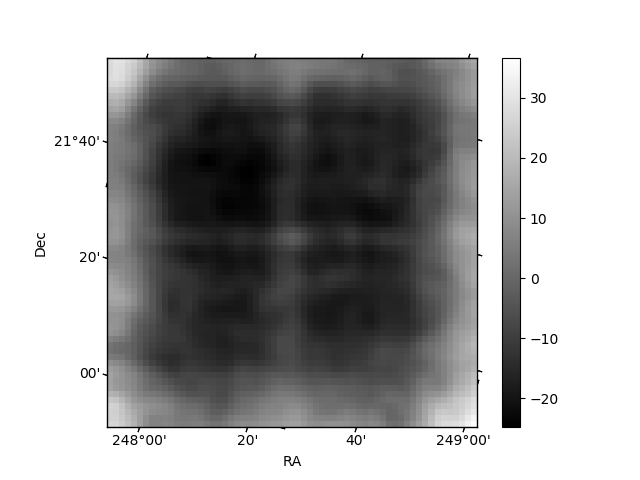
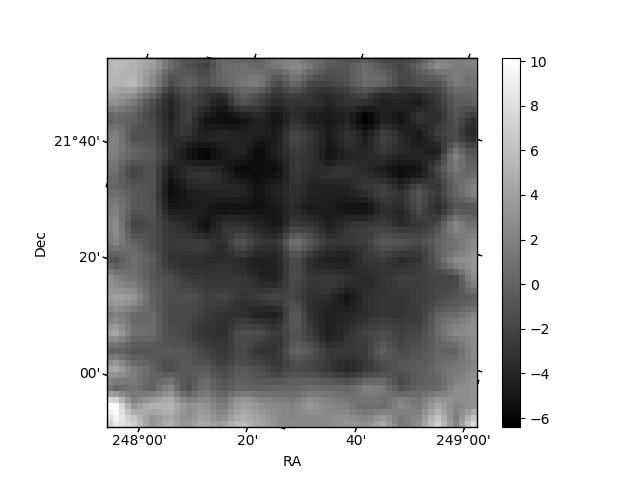
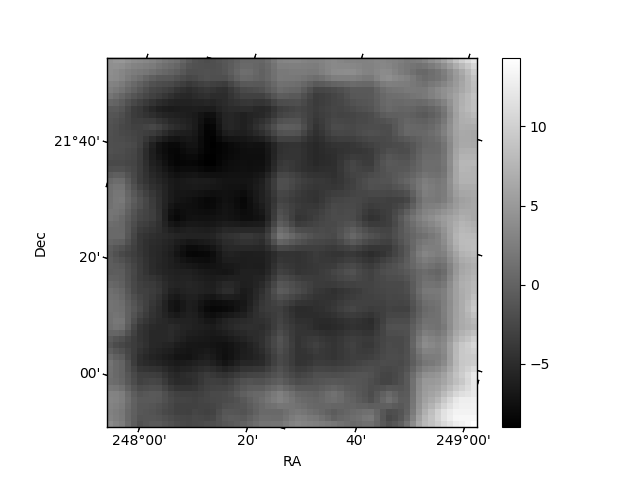
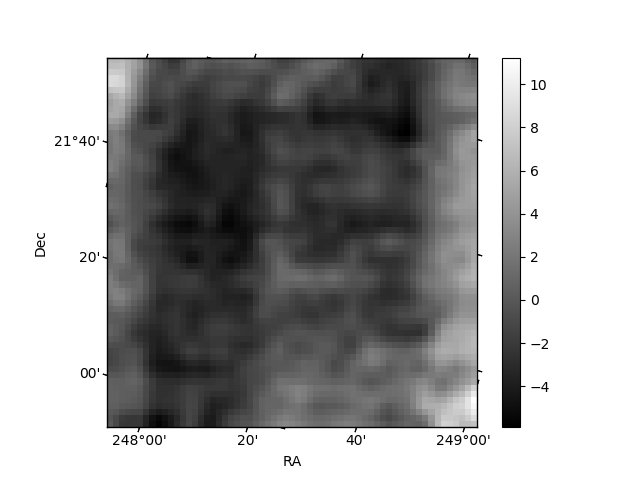
Histogram calculated using DETX and DETY for each event in the final _common_clean file
| Quadrant A | 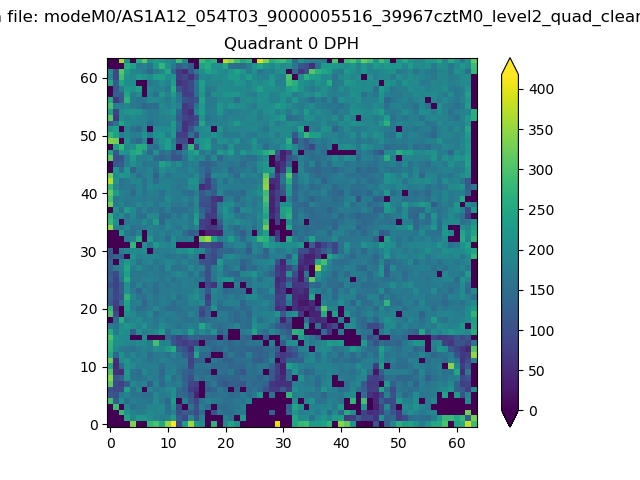 |
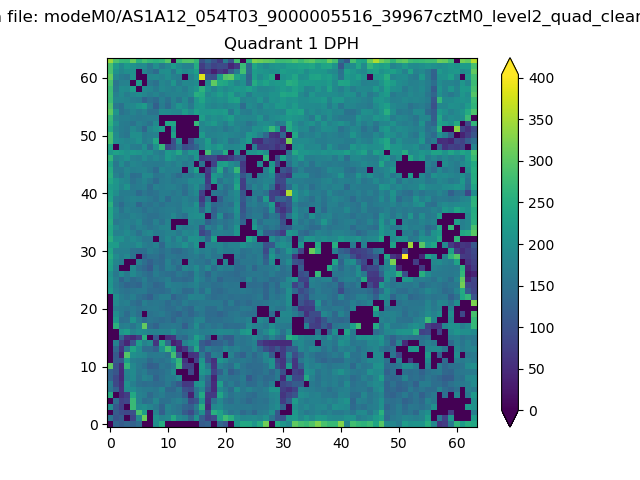 |
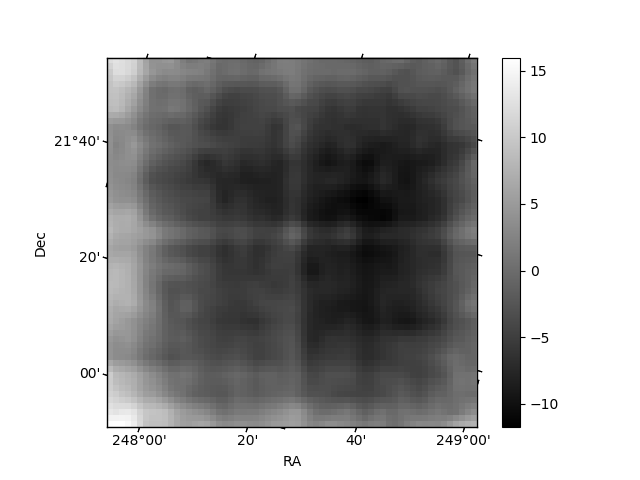
Quadrant B |
|---|---|---|---|
| Quadrant D | 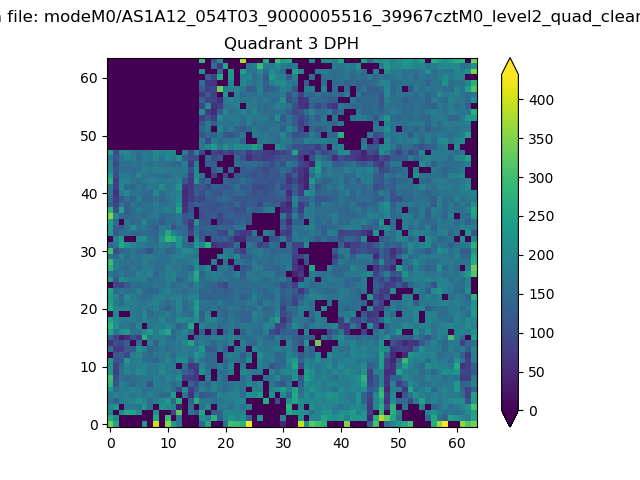 |
 |
Quadrant C |
| Plot type | Count rate plots | Images |
|---|---|---|
| Comparison with Poisson distribution Blue bars denote a histogram of data divided into 1 sec bins. Red curve is a Poisson curve with rate = median count rate of data. |
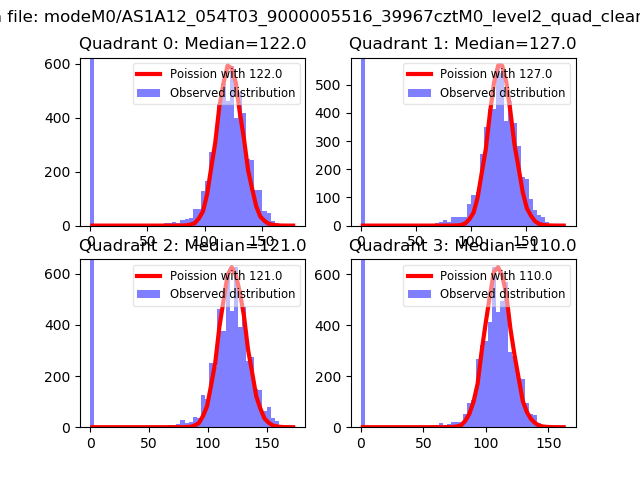 |
 |
| Quadrant-wise count rates Data is divided into 100 sec bins |
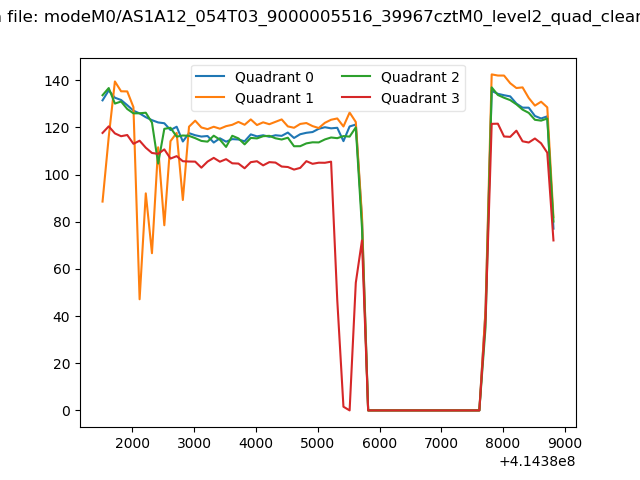 |
|
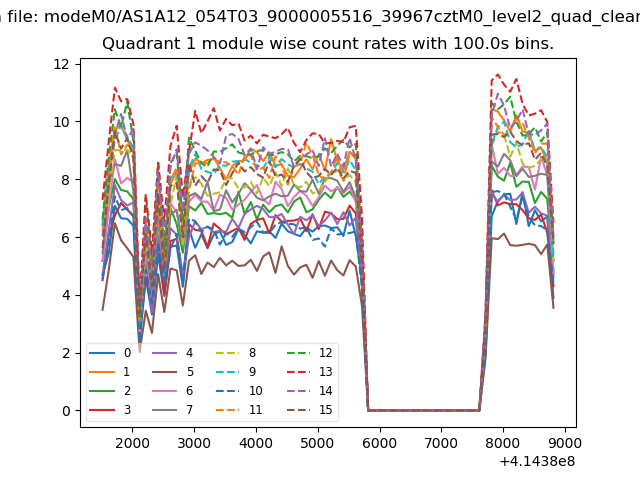
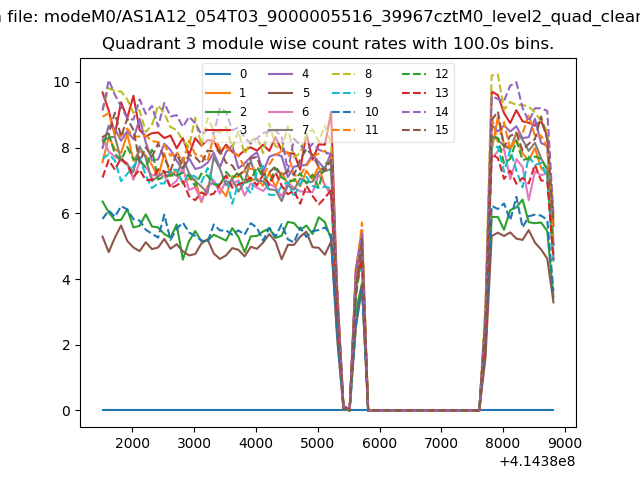
| Module-wise count rates for Quadrant A Data is divided into 100 sec bins |
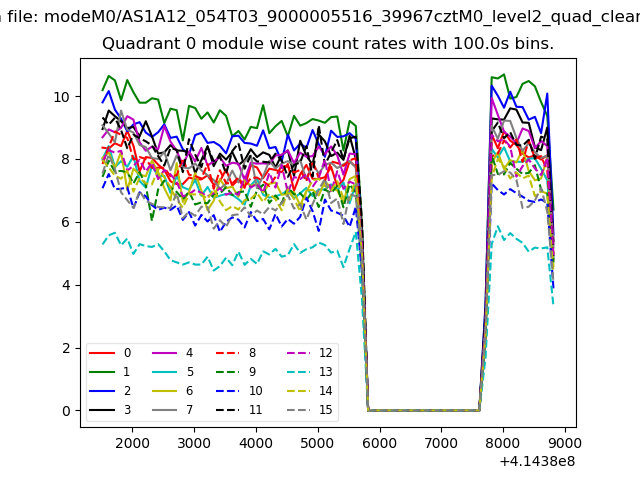 |
 |
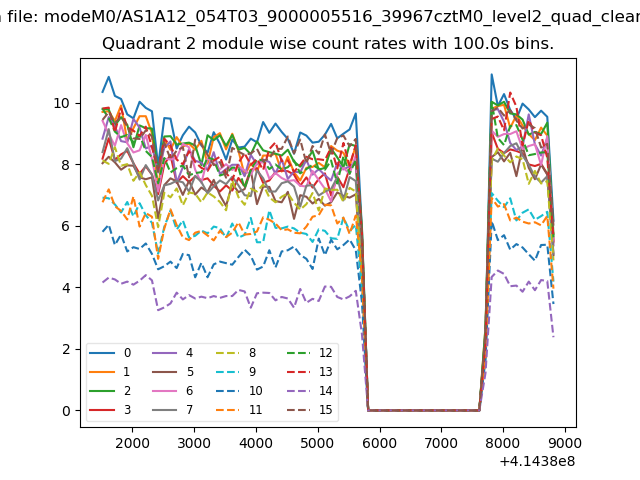
| Module-wise count rates for Quadrant B Data is divided into 100 sec bins |
 |
 |
| Module-wise count rates for Quadrant C Data is divided into 100 sec bins |
 |
 |
| Module-wise count rates for Quadrant D Data is divided into 100 sec bins |
 |
 |
| Parameter | Plot |
|---|---|
| CZT HV Monitor | 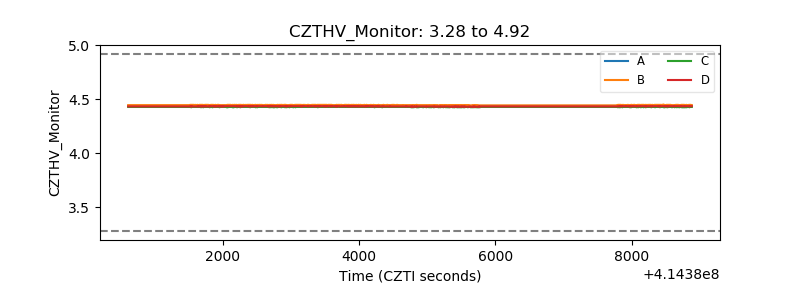 |
| D_VDD | 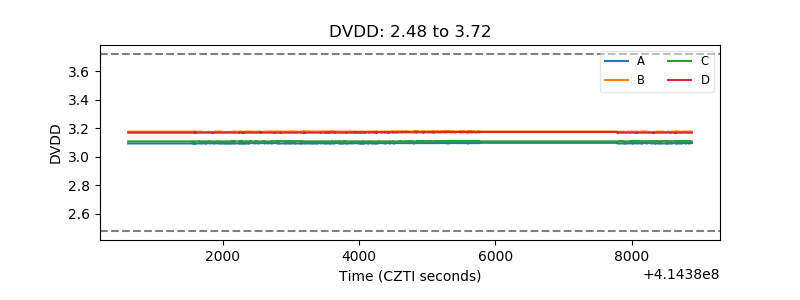 |
| Temperature 1 | 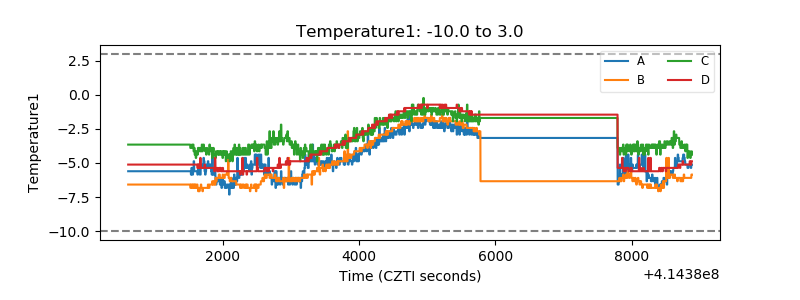 |
| Veto HV Monitor | 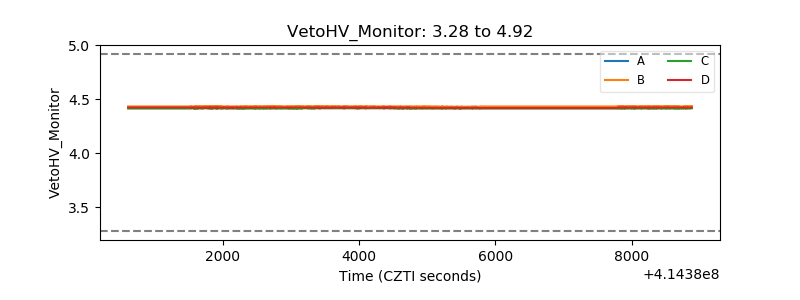 |
| Veto LLD | 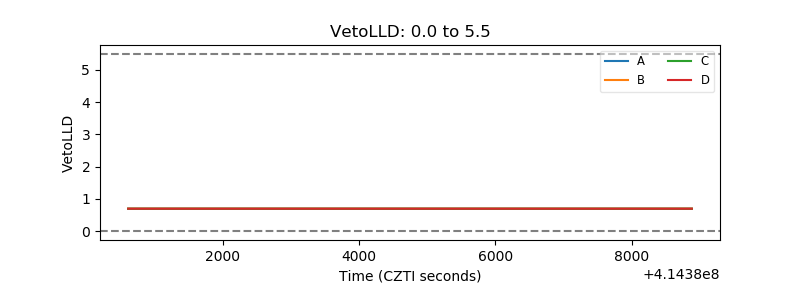 |
| Alpha Counter | 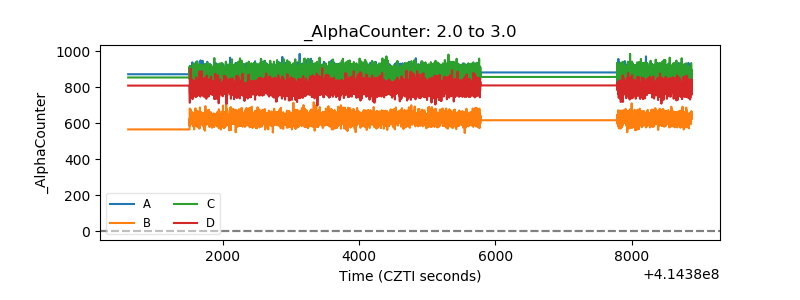 |
| _CPM_Rate | 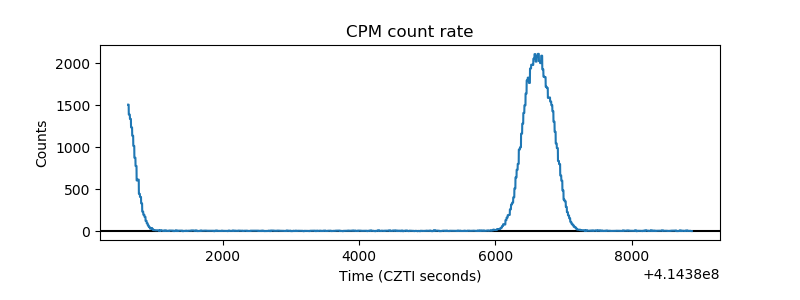 |
| CZT Counter | 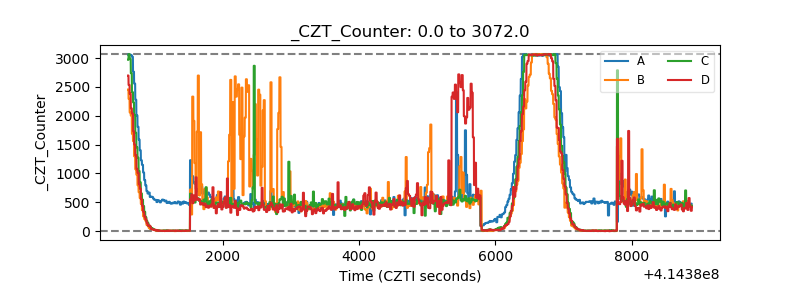 |
| +2.5 Volts monitor | 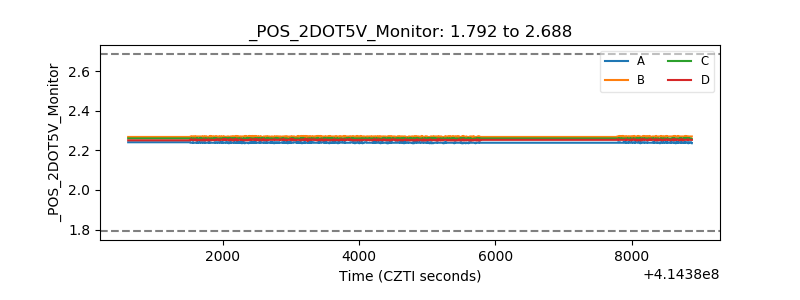 |
| +5 Volts monitor | 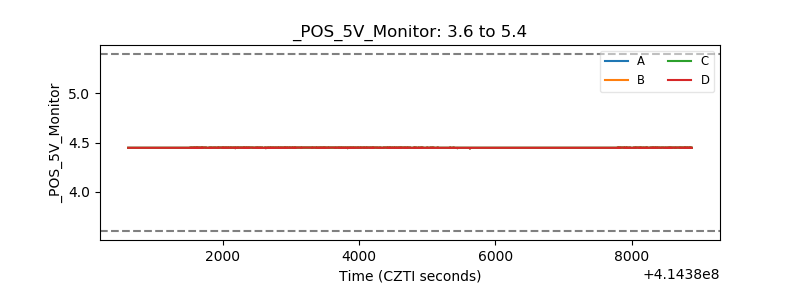 |
| _ROLL_ROT | 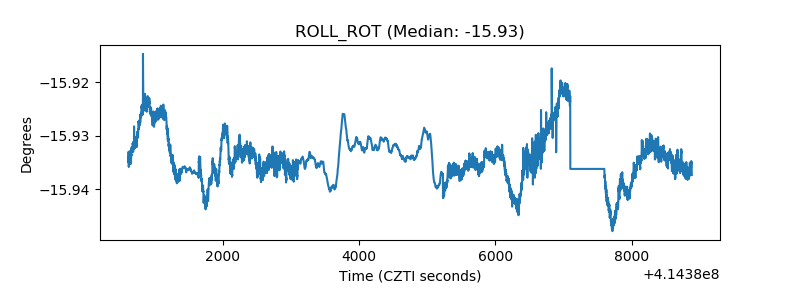 |
| _Roll_DEC | 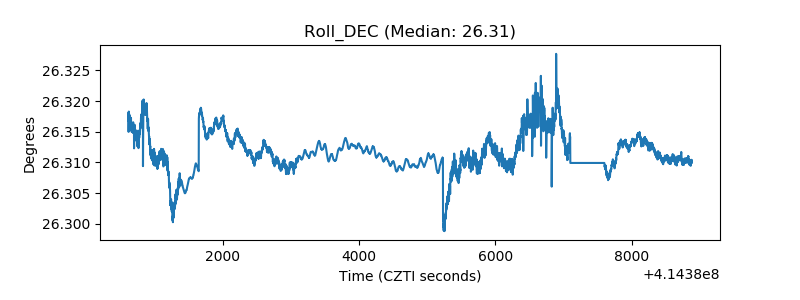 |
| _Roll_RA | 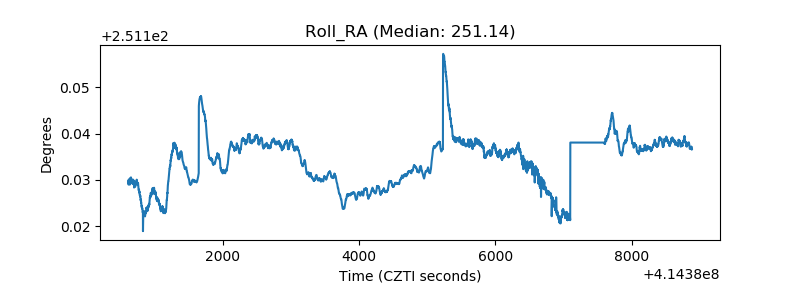 |
| Veto Counter | 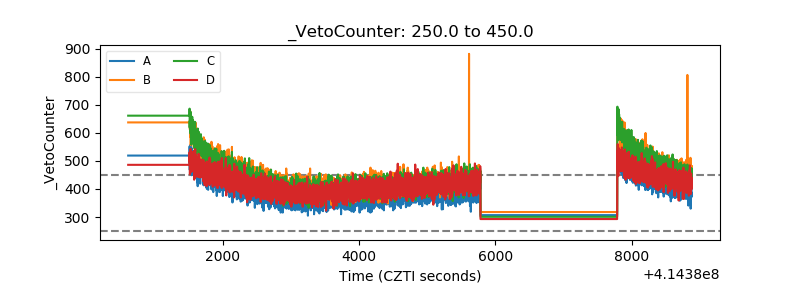 |