| Param | Original file | Final file |
|---|---|---|
| Filename | modeM0/AS1A12_054T03_9000005516_39968cztM0_level2.fits | modeM0/AS1A12_054T03_9000005516_39968cztM0_level2_quad_clean.evt |
| Size (bytes) | 337,982,400 | 93,769,920 |
| Size | 322.3 MB | 89.4 MB |
| Events in quadrant A | 2,910,690 | 642,439 |
| Events in quadrant B | 2,928,954 | 666,861 |
| Events in quadrant C | 2,641,126 | 632,432 |
| Events in quadrant D | 3,621,377 | 530,084 |
| Mode M9 | |||
|---|---|---|---|
| Quadrant | BADHDUFLAG | Total packets | Discarded packets |
| A | 0 | 22 | 0 |
| B | 0 | 22 | 0 |
| C | 0 | 22 | 0 |
| D | 0 | 23 | 0 |
| Mode SS | |||
|---|---|---|---|
| Quadrant | BADHDUFLAG | Total packets | Discarded packets |
| A | 0 | 108 | 0 |
| B | 0 | 108 | 0 |
| C | 0 | 108 | 0 |
| D | 0 | 108 | 0 |
| Mode M0 | |||
|---|---|---|---|
| Quadrant | BADHDUFLAG | Total packets | Discarded packets |
| A | 0 | 11835 | 3 |
| B | 0 | 12078 | 2 |
| C | 0 | 10930 | 2 |
| D | 0 | 14573 | 2 |
| Quadrant | Total seconds | Saturated seconds | Saturation percentage |
|---|---|---|---|
| A | 5247 | 31 | 0.590814% |
| B | 5247 | 81 | 1.543739% |
| C | 5247 | 10 | 0.190585% |
| D | 5247 | 478 | 9.109968% |
Noise dominated data is calculated using 1-second bins in cleaned event files. If a bin has >2000 counts, and if more than 50% of those come from <1% of pixels, then it is considered to be noise-dominated and hence unusable.
| Quadrant | # 1 sec bins | Bins with >0 counts | Bins with >2000 counts | High rate bins dominated by noise | Noise dominated (total time) | Noise dominated (detector-on time) | Marked lightcurve |
|---|---|---|---|---|---|---|---|
| A | 7340 | 5248 | 17 | 17 | 0.23% | 0.32% | 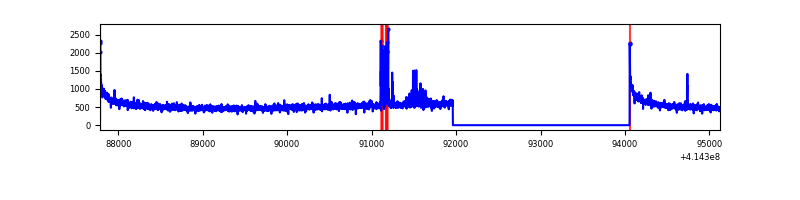 |
| B | 7340 | 5248 | 66 | 66 | 0.90% | 1.26% | 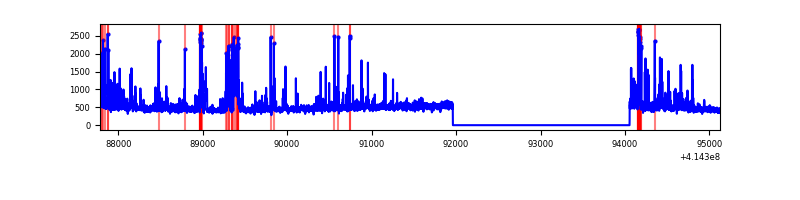 |
| C | 7340 | 5248 | 11 | 11 | 0.15% | 0.21% | 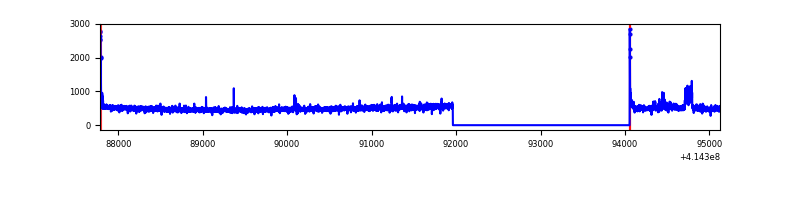 |
| D | 7340 | 5248 | 448 | 448 | 6.10% | 8.54% | 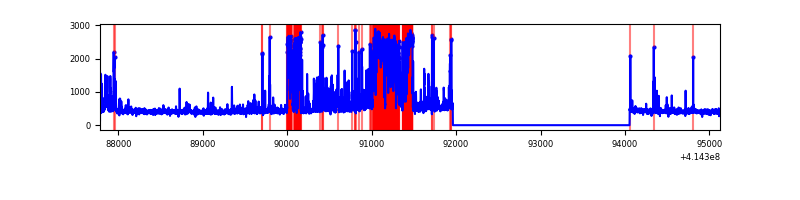 |
Top three noisy pixels from each quadrant. If the there are fewer than three noisy pixels in the level2.evt file, extra rows are filled as -1
| Pixel properties | Quadrant properties | ||||||
|---|---|---|---|---|---|---|---|
| Quadrant | DetID | PixID | Counts | Sigma | Mean | Median | Sigma |
| A | 10 | 83 | 458033 | 3777.24 | 604 | 595 | 121.1 |
| A | 13 | 248 | 93270 | 765.25 | 604 | 595 | 121.1 |
| A | 6 | 10 | 15304 | 121.46 | 604 | 595 | 121.1 |
| B | 4 | 171 | 303376 | 2629.93 | 600 | 585 | 115.1 |
| B | 5 | 255 | 229850 | 1991.31 | 600 | 585 | 115.1 |
| B | 0 | 230 | 25378 | 215.34 | 600 | 585 | 115.1 |
| C | 15 | 214 | 220411 | 1626.91 | 587 | 591 | 135.1 |
| C | 9 | 54 | 71394 | 524.02 | 587 | 591 | 135.1 |
| C | 0 | 10 | 43867 | 320.29 | 587 | 591 | 135.1 |
| D | 2 | 250 | 1151012 | 8489.52 | 555 | 540 | 135.5 |
| D | 12 | 227 | 128463 | 943.96 | 555 | 540 | 135.5 |
| D | 2 | 249 | 107163 | 786.79 | 555 | 540 | 135.5 |
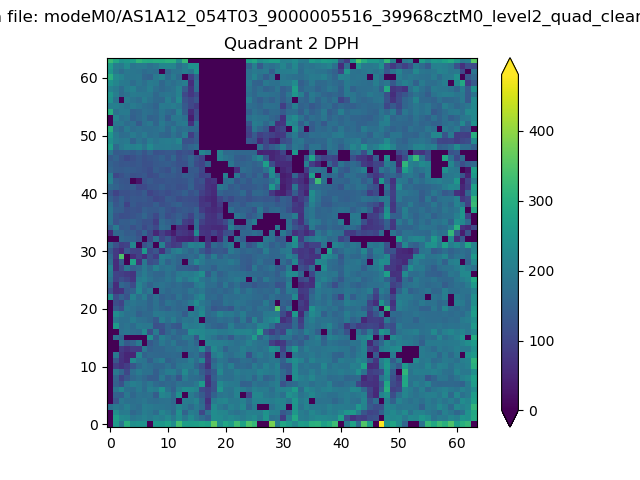
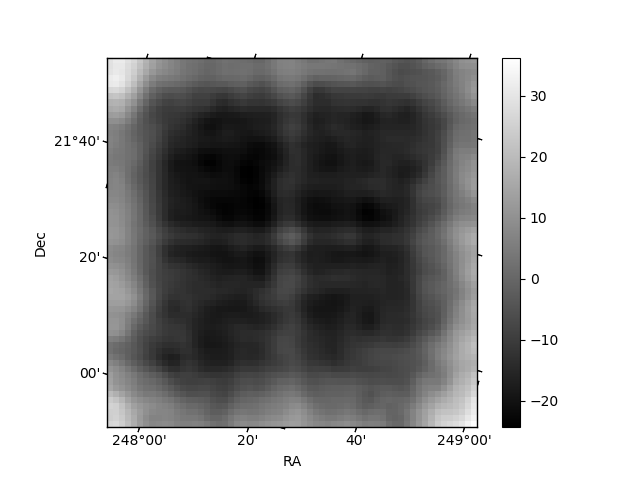
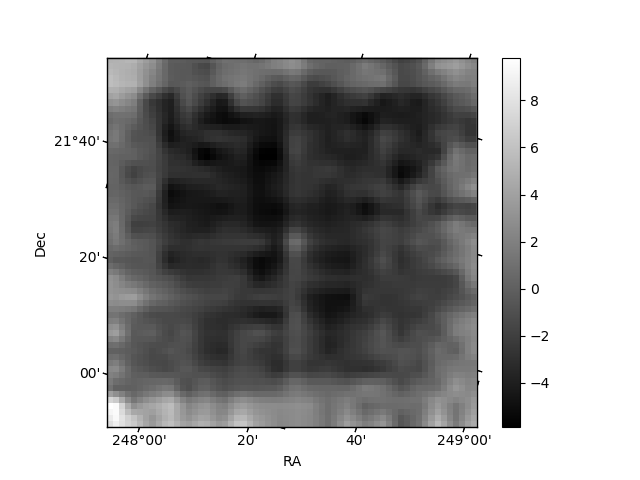
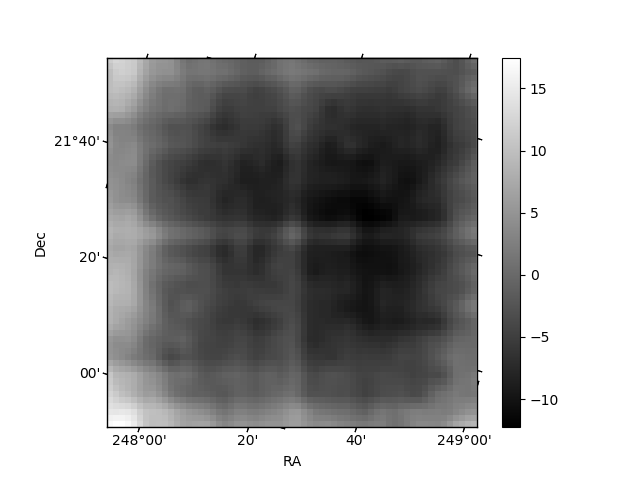
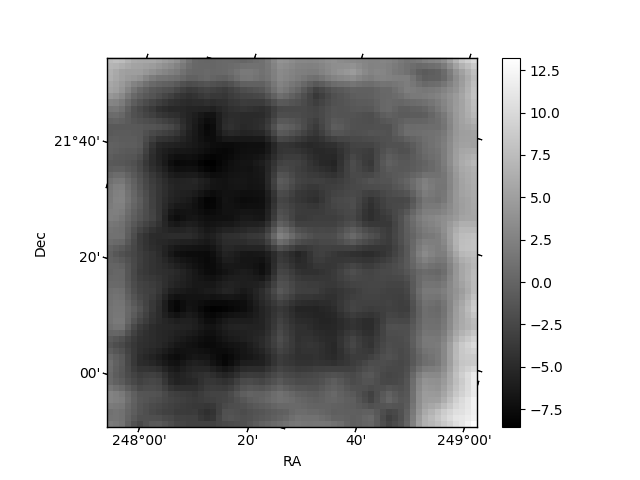
Histogram calculated using DETX and DETY for each event in the final _common_clean file
| Quadrant A | 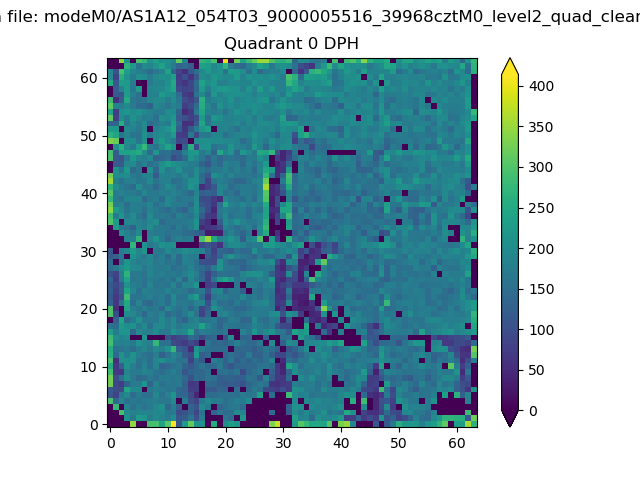 |
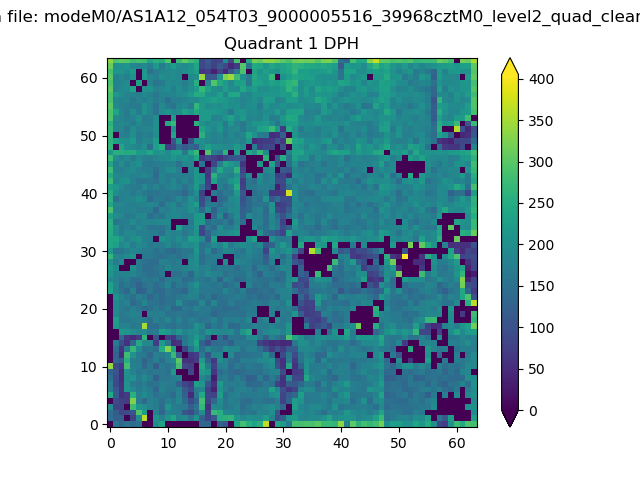 |
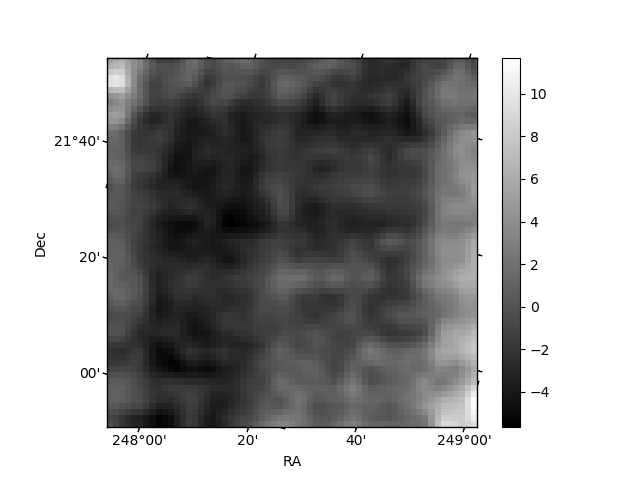
Quadrant B |
|---|---|---|---|
| Quadrant D | 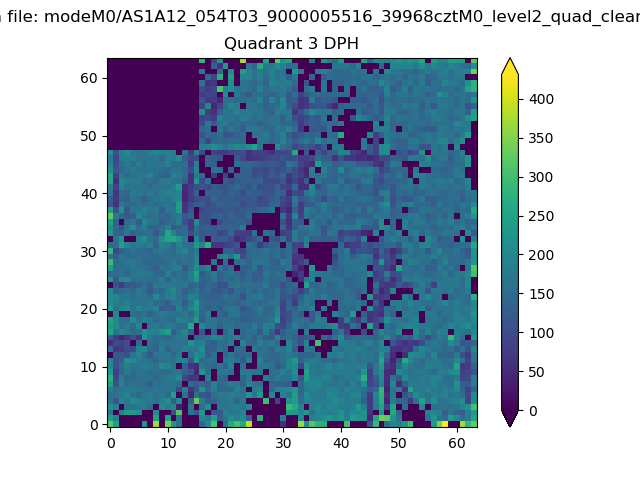 |
 |
Quadrant C |
| Plot type | Count rate plots | Images |
|---|---|---|
| Comparison with Poisson distribution Blue bars denote a histogram of data divided into 1 sec bins. Red curve is a Poisson curve with rate = median count rate of data. |
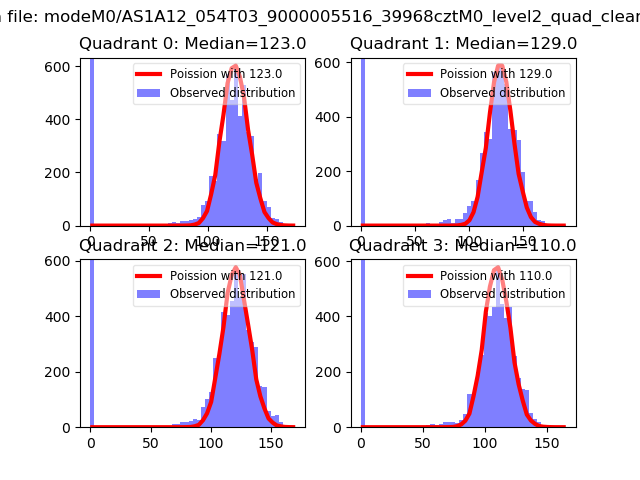 |
 |
| Quadrant-wise count rates Data is divided into 100 sec bins |
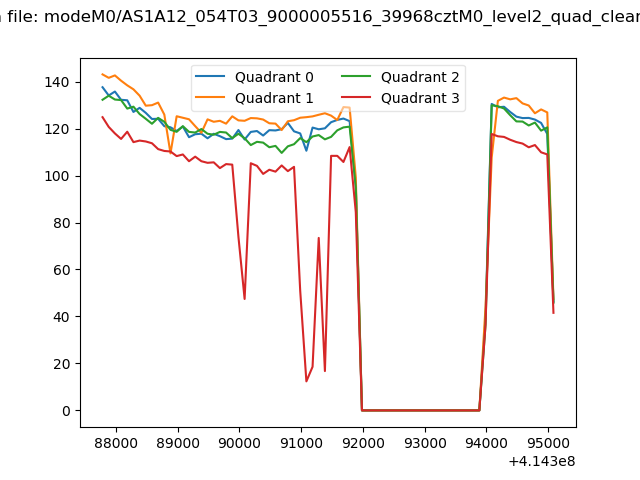 |
|
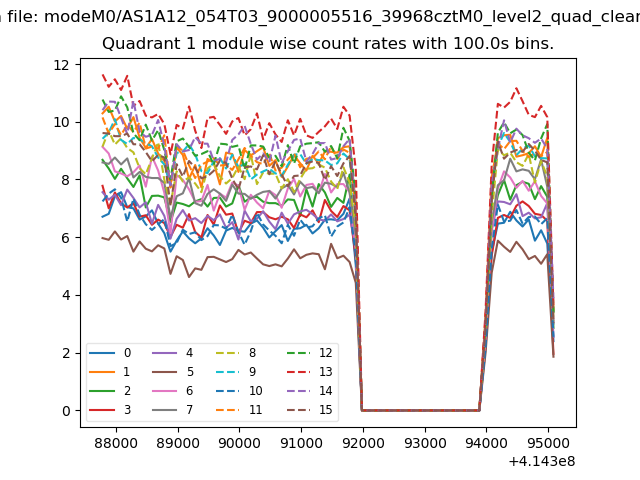
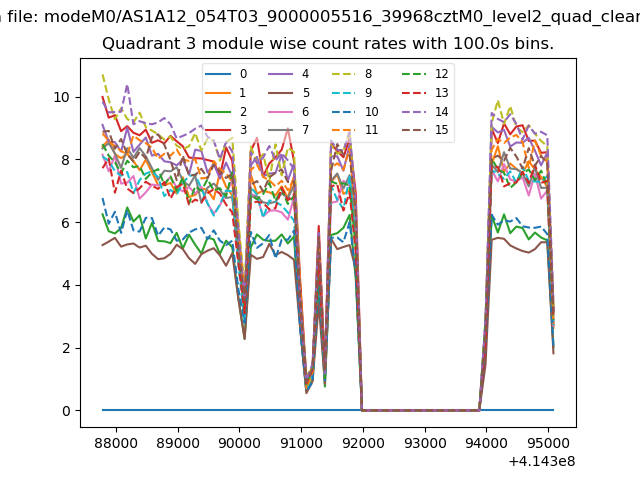
| Module-wise count rates for Quadrant A Data is divided into 100 sec bins |
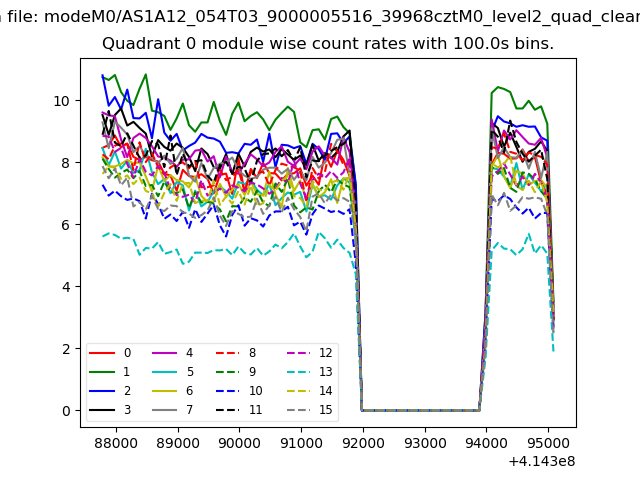 |
 |
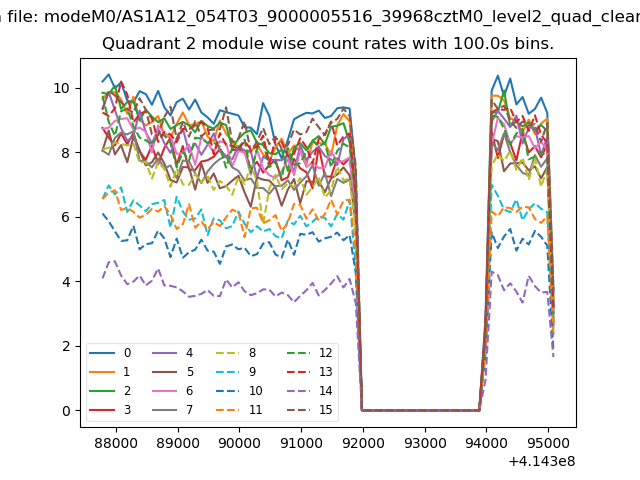
| Module-wise count rates for Quadrant B Data is divided into 100 sec bins |
 |
 |
| Module-wise count rates for Quadrant C Data is divided into 100 sec bins |
 |
 |
| Module-wise count rates for Quadrant D Data is divided into 100 sec bins |
 |
 |
| Parameter | Plot |
|---|---|
| CZT HV Monitor | 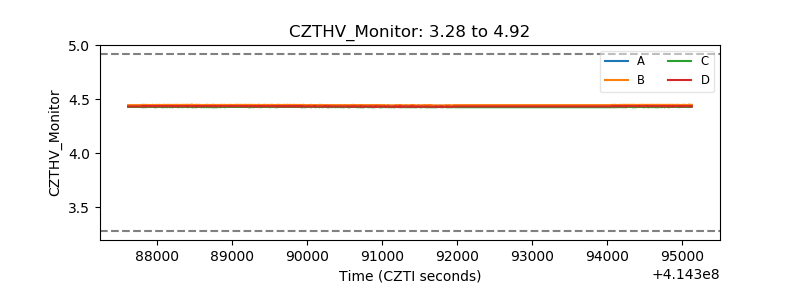 |
| D_VDD | 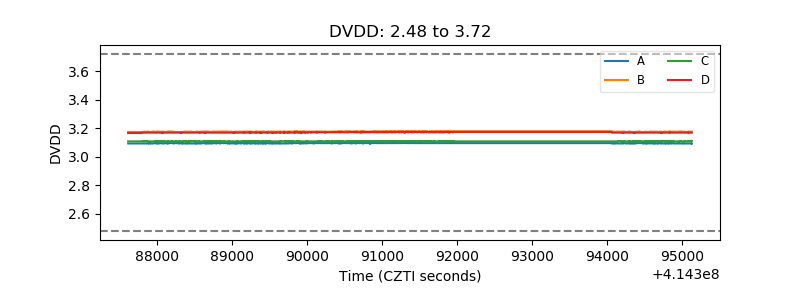 |
| Temperature 1 | 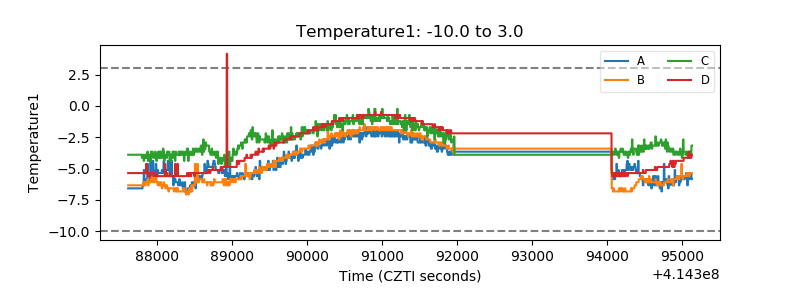 |
| Veto HV Monitor | 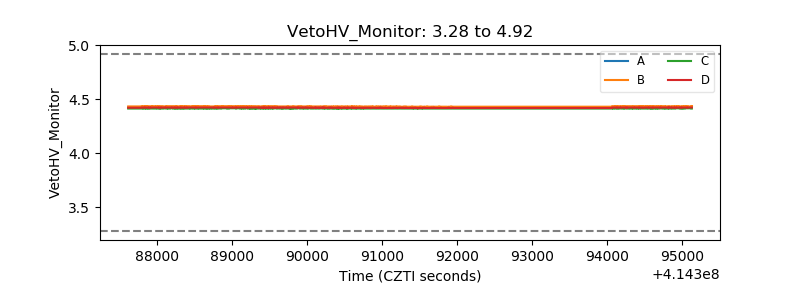 |
| Veto LLD | 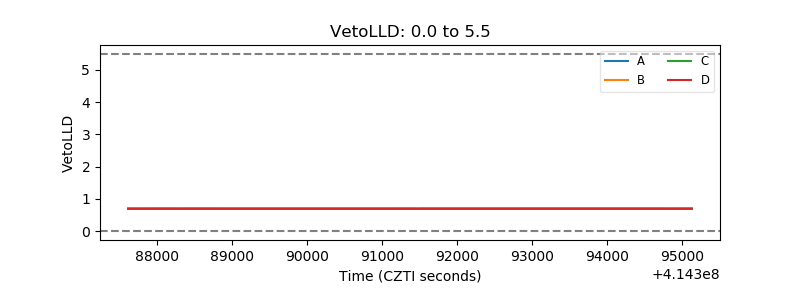 |
| Alpha Counter | 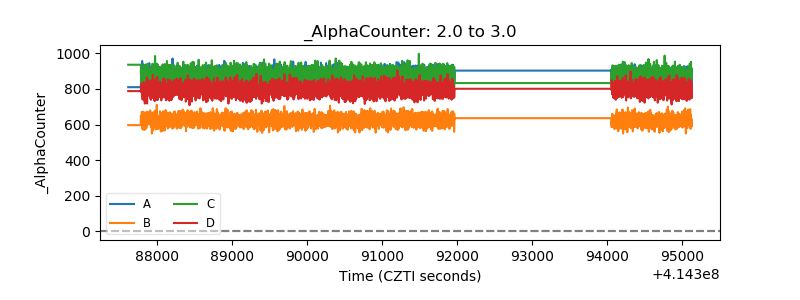 |
| _CPM_Rate | 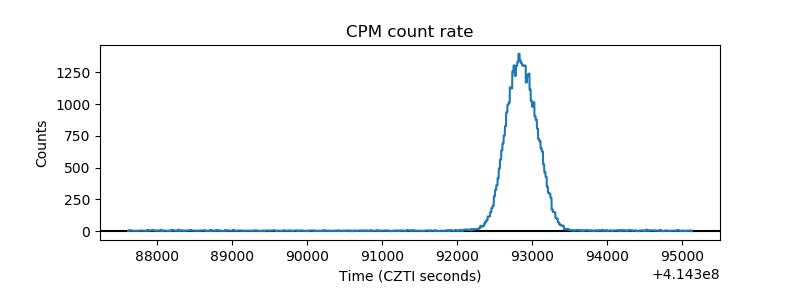 |
| CZT Counter | 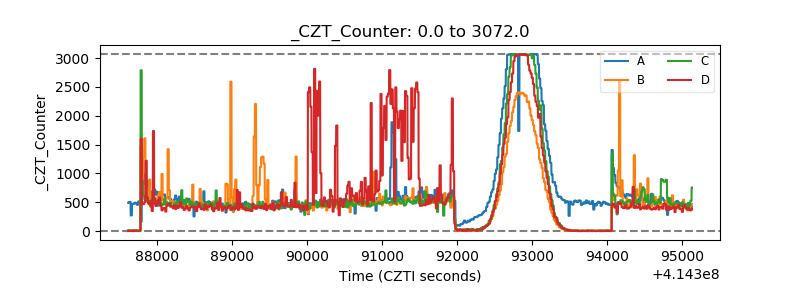 |
| +2.5 Volts monitor |  |
| +5 Volts monitor | 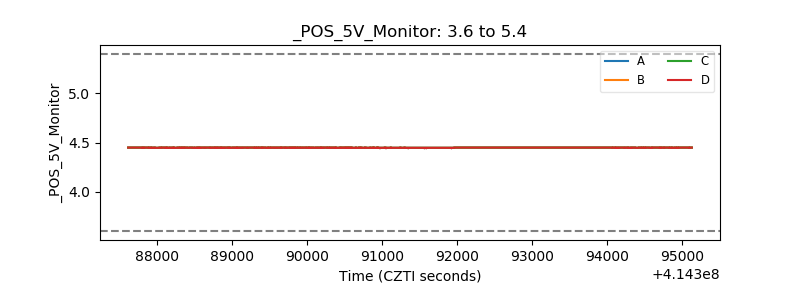 |
| _ROLL_ROT | 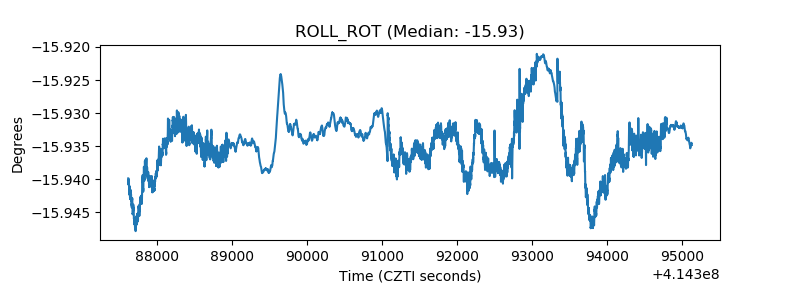 |
| _Roll_DEC | 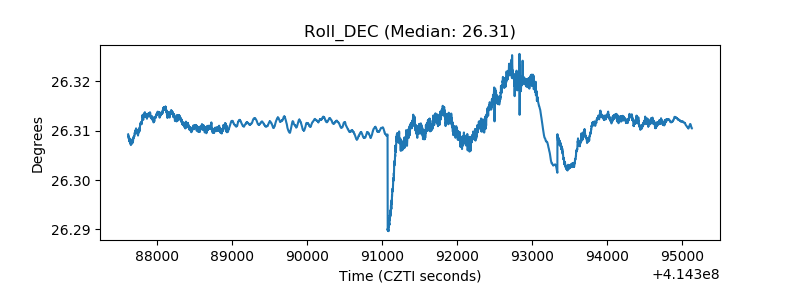 |
| _Roll_RA | 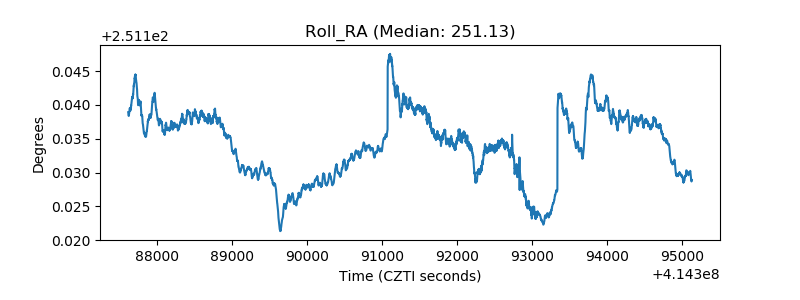 |
| Veto Counter | 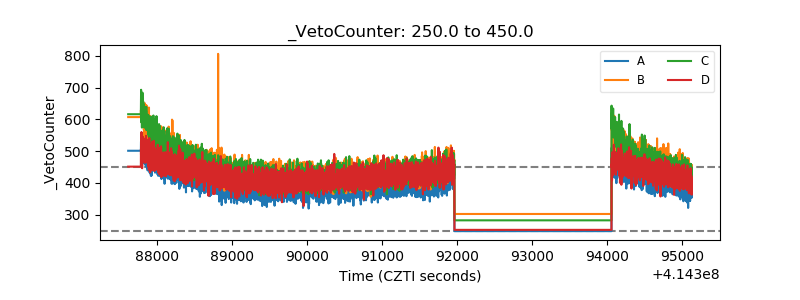 |