| Param | Original file | Final file |
|---|---|---|
| Filename | modeM0/AS1A12_054T03_9000005516_39969cztM0_level2.fits | modeM0/AS1A12_054T03_9000005516_39969cztM0_level2_quad_clean.evt |
| Size (bytes) | 327,453,120 | 89,161,920 |
| Size | 312.3 MB | 85.0 MB |
| Events in quadrant A | 2,975,854 | 603,849 |
| Events in quadrant B | 2,817,256 | 625,827 |
| Events in quadrant C | 2,559,774 | 595,090 |
| Events in quadrant D | 3,372,501 | 519,289 |
| Mode M9 | |||
|---|---|---|---|
| Quadrant | BADHDUFLAG | Total packets | Discarded packets |
| A | 0 | 33 | 0 |
| B | 0 | 33 | 0 |
| C | 0 | 33 | 0 |
| D | 0 | 34 | 0 |
| Mode SS | |||
|---|---|---|---|
| Quadrant | BADHDUFLAG | Total packets | Discarded packets |
| A | 0 | 102 | 0 |
| B | 0 | 102 | 0 |
| C | 0 | 102 | 0 |
| D | 0 | 102 | 0 |
| Mode M0 | |||
|---|---|---|---|
| Quadrant | BADHDUFLAG | Total packets | Discarded packets |
| A | 0 | 11938 | 3 |
| B | 0 | 11723 | 2 |
| C | 0 | 10607 | 2 |
| D | 0 | 13662 | 2 |
| Quadrant | Total seconds | Saturated seconds | Saturation percentage |
|---|---|---|---|
| A | 5081 | 67 | 1.318638% |
| B | 5081 | 67 | 1.318638% |
| C | 5081 | 11 | 0.216493% |
| D | 5081 | 280 | 5.510726% |
Noise dominated data is calculated using 1-second bins in cleaned event files. If a bin has >2000 counts, and if more than 50% of those come from <1% of pixels, then it is considered to be noise-dominated and hence unusable.
| Quadrant | # 1 sec bins | Bins with >0 counts | Bins with >2000 counts | High rate bins dominated by noise | Noise dominated (total time) | Noise dominated (detector-on time) | Marked lightcurve |
|---|---|---|---|---|---|---|---|
| A | 7204 | 5082 | 58 | 58 | 0.81% | 1.14% | 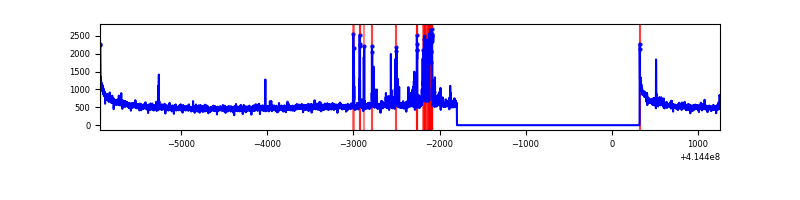 |
| B | 7204 | 5082 | 54 | 54 | 0.75% | 1.06% |  |
| C | 7204 | 5082 | 9 | 9 | 0.12% | 0.18% | 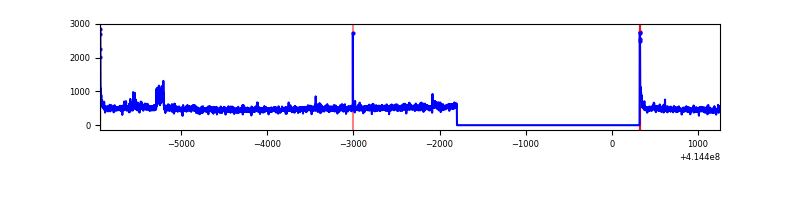 |
| D | 7204 | 5082 | 289 | 289 | 4.01% | 5.69% | 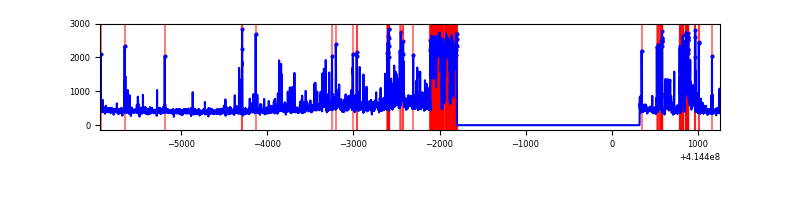 |
Top three noisy pixels from each quadrant. If the there are fewer than three noisy pixels in the level2.evt file, extra rows are filled as -1
| Pixel properties | Quadrant properties | ||||||
|---|---|---|---|---|---|---|---|
| Quadrant | DetID | PixID | Counts | Sigma | Mean | Median | Sigma |
| A | 10 | 83 | 450419 | 3860.53 | 578 | 567 | 116.5 |
| A | 15 | 223 | 137428 | 1174.51 | 578 | 567 | 116.5 |
| A | 13 | 248 | 128604 | 1098.79 | 578 | 567 | 116.5 |
| B | 4 | 171 | 241609 | 2199.74 | 574 | 558 | 109.6 |
| B | 4 | 200 | 129443 | 1176.16 | 574 | 558 | 109.6 |
| B | 5 | 255 | 122557 | 1113.32 | 574 | 558 | 109.6 |
| C | 15 | 214 | 213719 | 1627.26 | 564 | 568 | 131.0 |
| C | 9 | 54 | 92969 | 705.42 | 564 | 568 | 131.0 |
| C | 0 | 10 | 39791 | 299.44 | 564 | 568 | 131.0 |
| D | 5 | 32 | 505422 | 3817.06 | 547 | 533 | 132.3 |
| D | 12 | 227 | 451756 | 3411.34 | 547 | 533 | 132.3 |
| D | 1 | 47 | 167227 | 1260.24 | 547 | 533 | 132.3 |
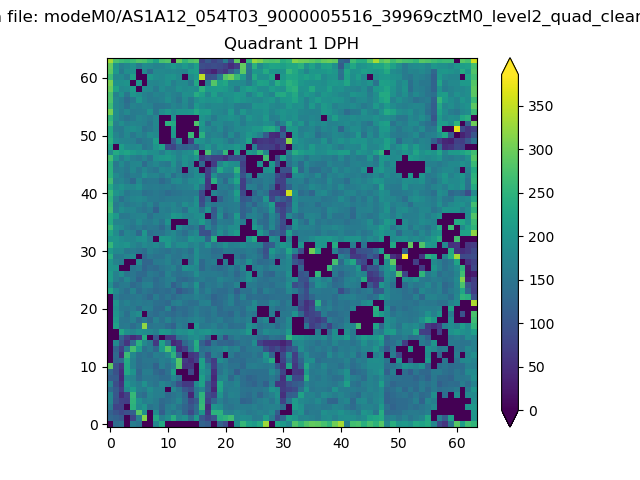
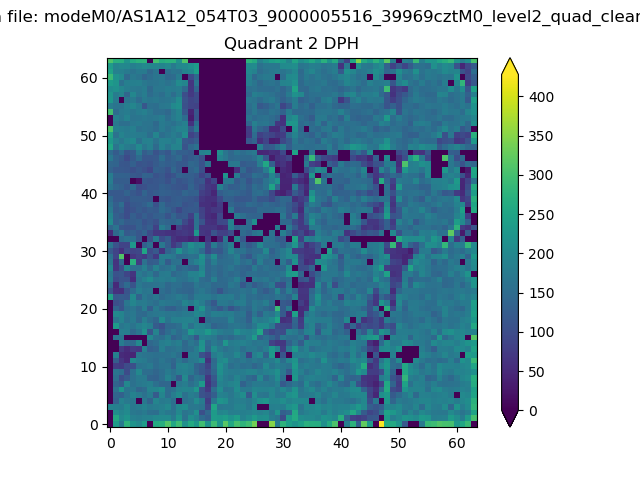
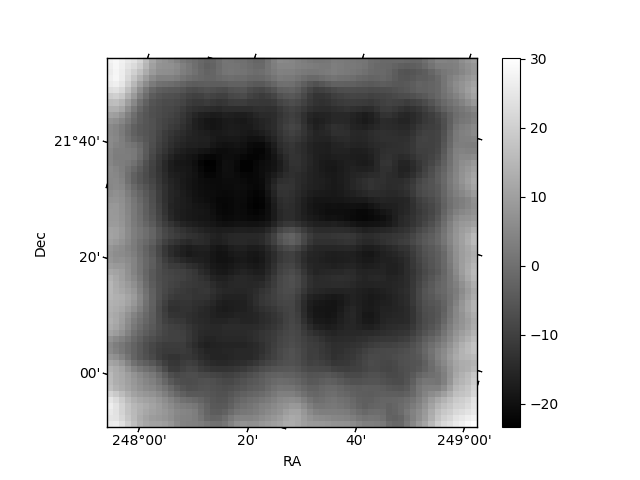
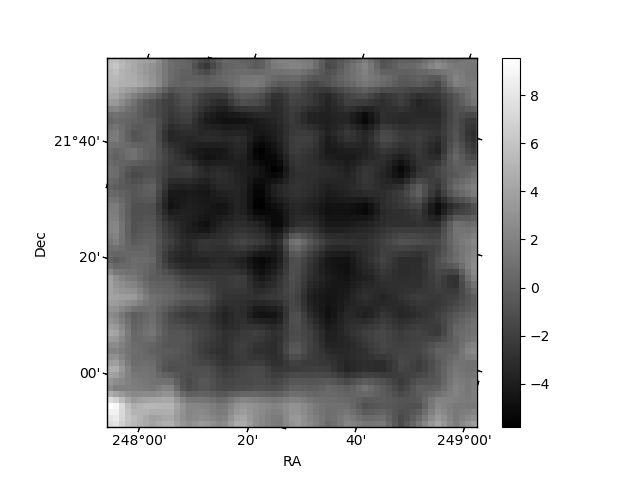
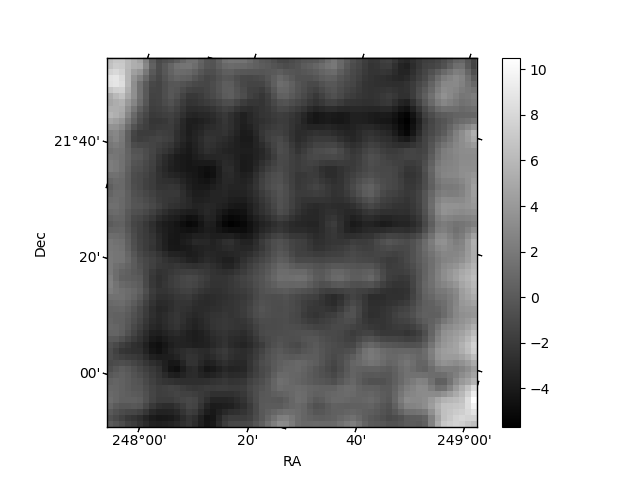
Histogram calculated using DETX and DETY for each event in the final _common_clean file
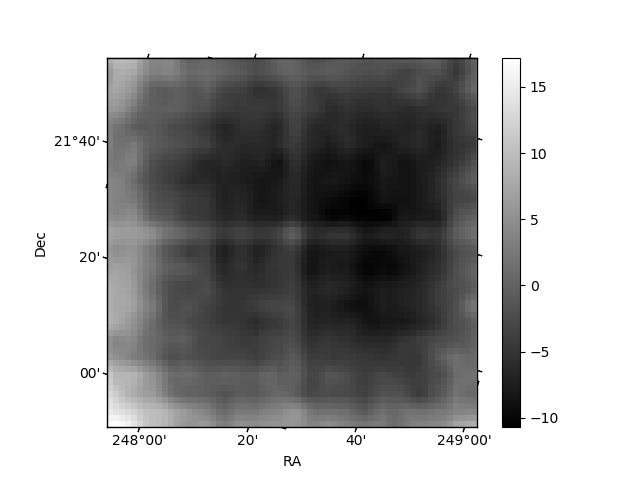
| Quadrant A | 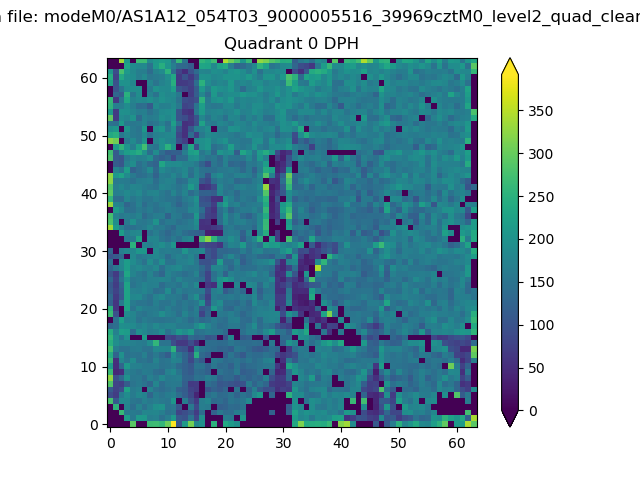 |
 |
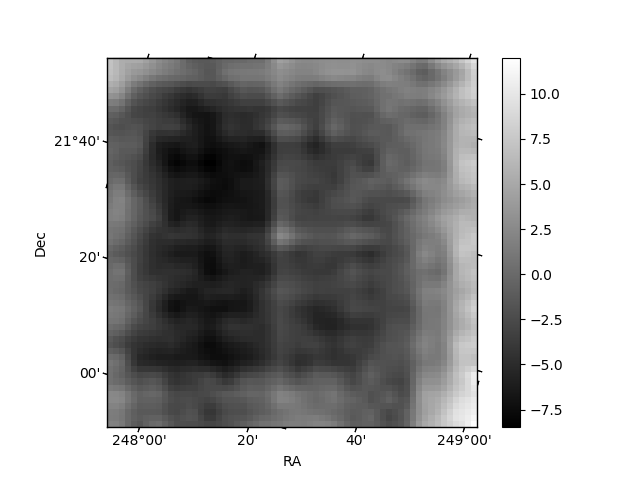
Quadrant B |
|---|---|---|---|
| Quadrant D | 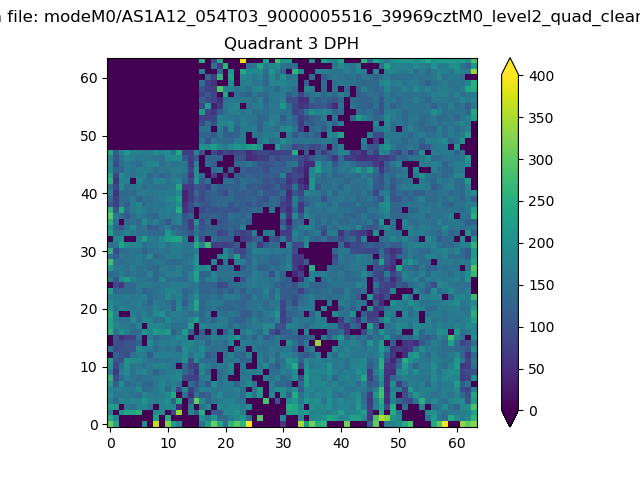 |
 |
Quadrant C |
| Plot type | Count rate plots | Images |
|---|---|---|
| Comparison with Poisson distribution Blue bars denote a histogram of data divided into 1 sec bins. Red curve is a Poisson curve with rate = median count rate of data. |
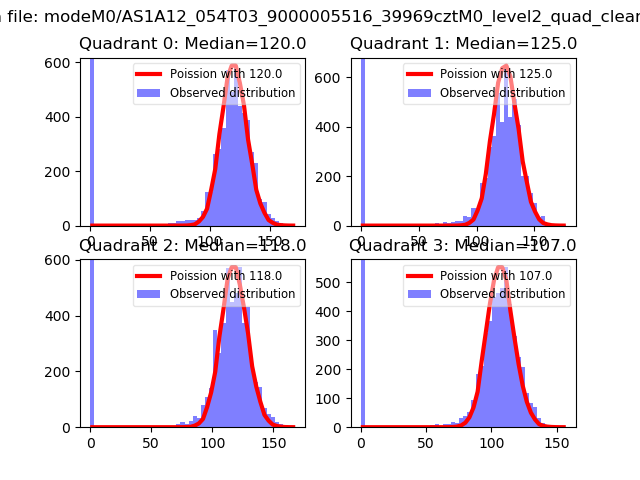 |
 |
| Quadrant-wise count rates Data is divided into 100 sec bins |
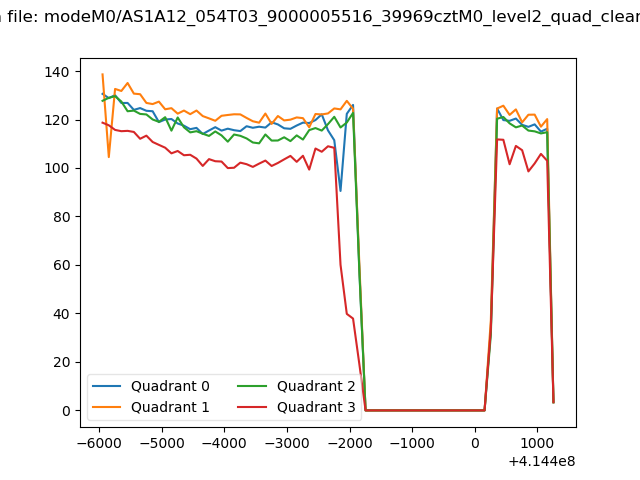 |
|
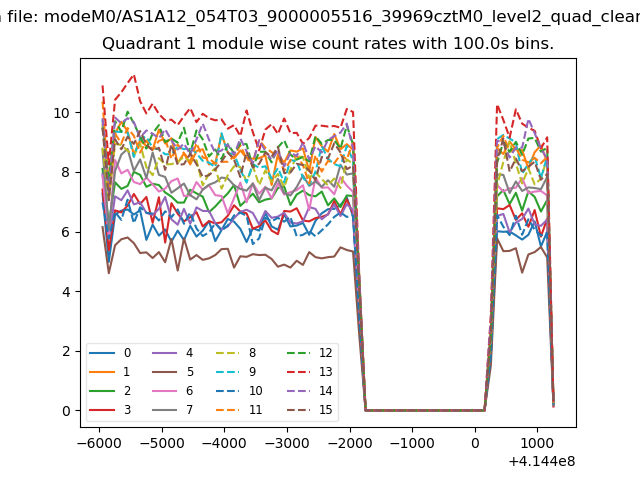
| Module-wise count rates for Quadrant A Data is divided into 100 sec bins |
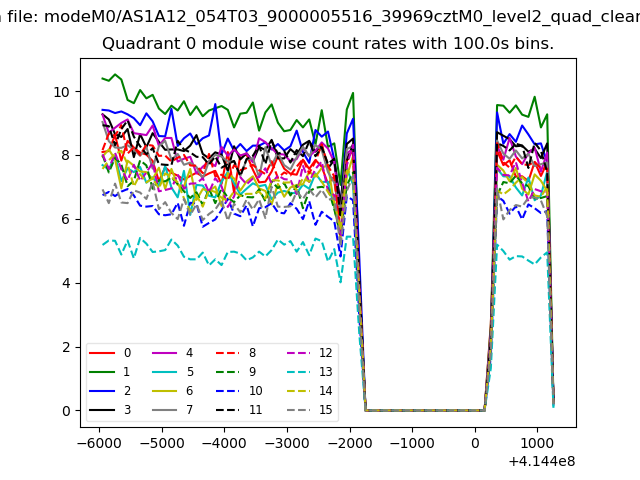 |
 |
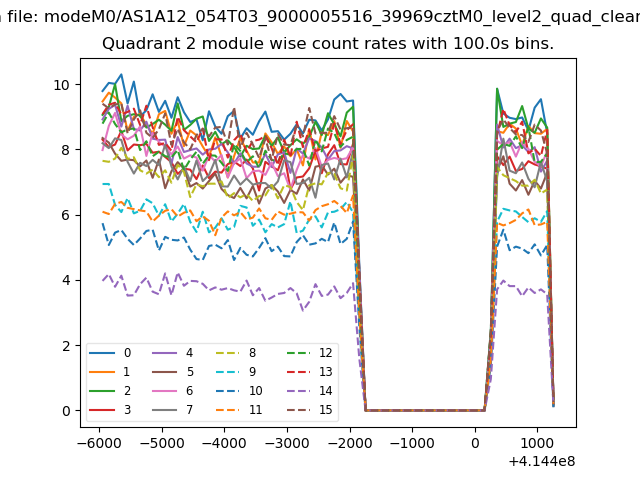
| Module-wise count rates for Quadrant B Data is divided into 100 sec bins |
 |
 |
| Module-wise count rates for Quadrant C Data is divided into 100 sec bins |
 |
 |
| Module-wise count rates for Quadrant D Data is divided into 100 sec bins |
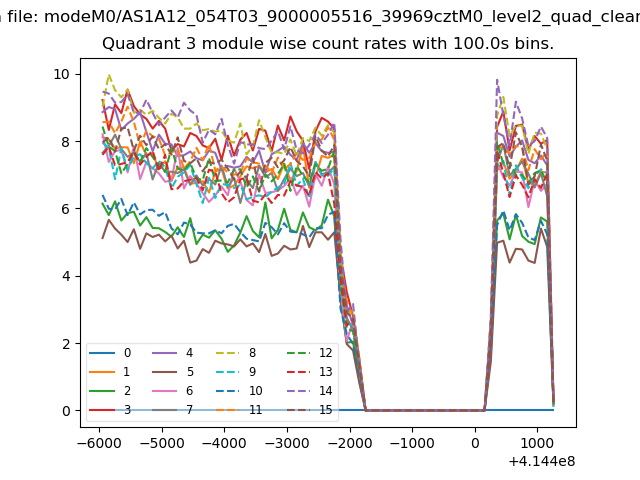 |
 |
| Parameter | Plot |
|---|---|
| CZT HV Monitor | 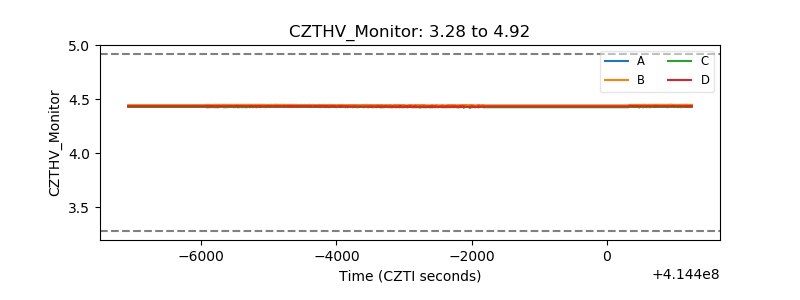 |
| D_VDD | 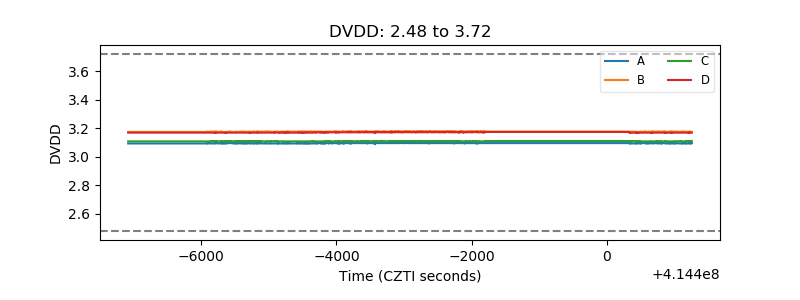 |
| Temperature 1 | 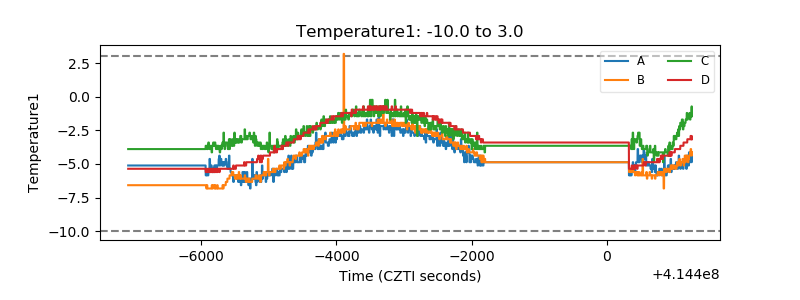 |
| Veto HV Monitor |  |
| Veto LLD | 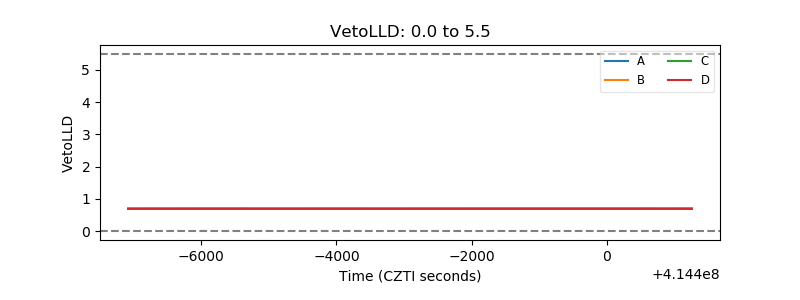 |
| Alpha Counter | 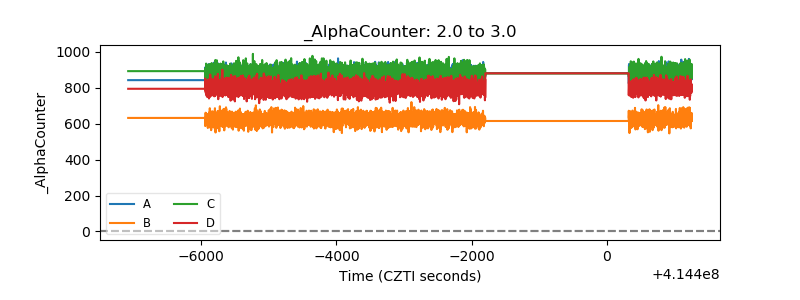 |
| _CPM_Rate | 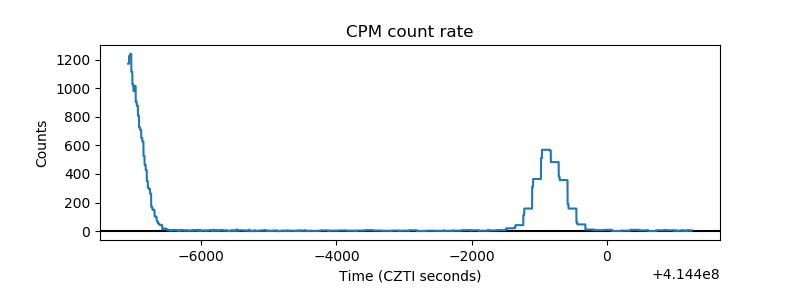 |
| CZT Counter | 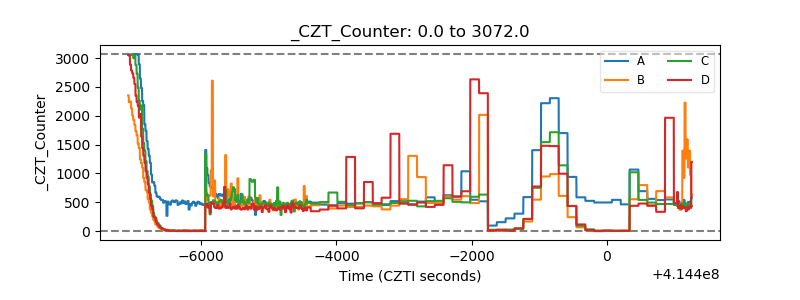 |
| +2.5 Volts monitor | 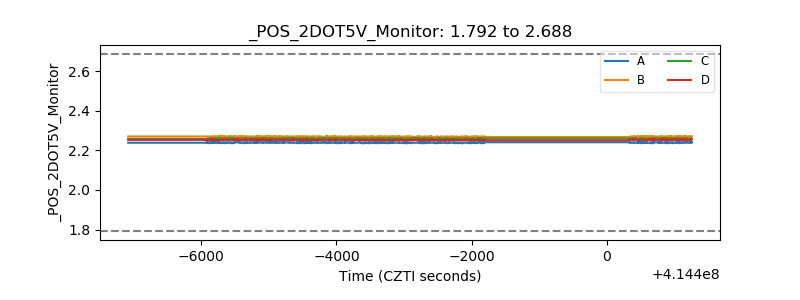 |
| +5 Volts monitor | 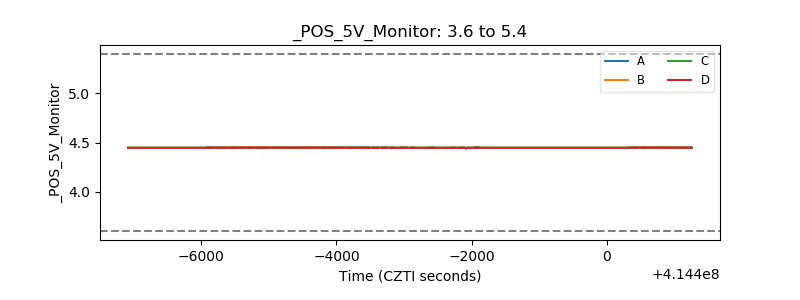 |
| _ROLL_ROT | 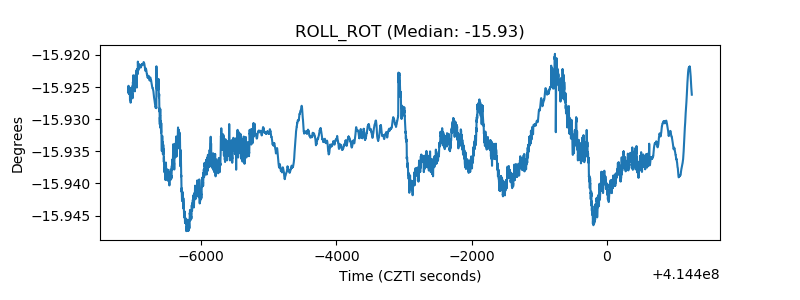 |
| _Roll_DEC | 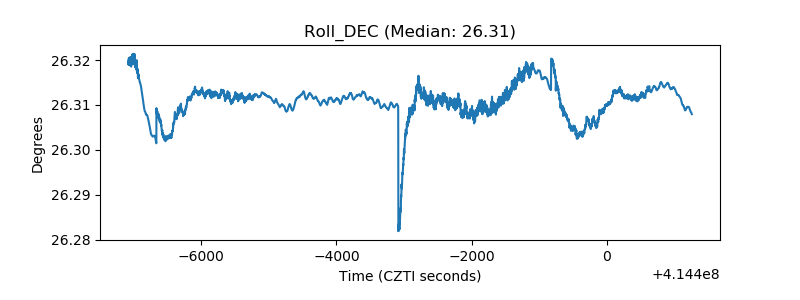 |
| _Roll_RA | 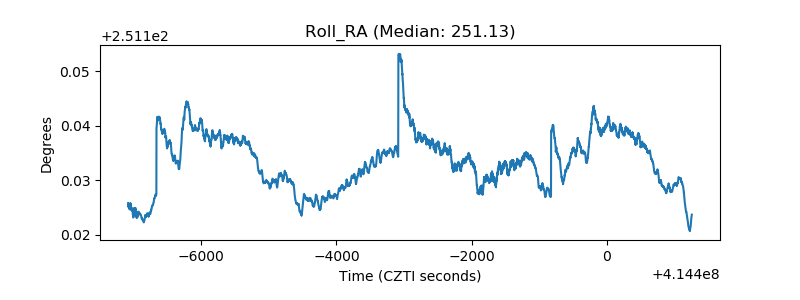 |
| Veto Counter | 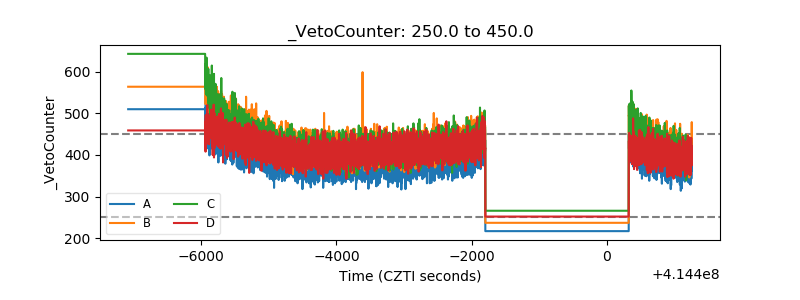 |