| Param | Original file | Final file |
|---|---|---|
| Filename | modeM0/AS1A12_054T03_9000005516_39970cztM0_level2.fits | modeM0/AS1A12_054T03_9000005516_39970cztM0_level2_quad_clean.evt |
| Size (bytes) | 444,502,080 | 79,945,920 |
| Size | 423.9 MB | 76.2 MB |
| Events in quadrant A | 2,745,669 | 576,059 |
| Events in quadrant B | 6,364,644 | 461,659 |
| Events in quadrant C | 2,447,347 | 562,461 |
| Events in quadrant D | 4,505,261 | 468,119 |
| Mode M9 | |||
|---|---|---|---|
| Quadrant | BADHDUFLAG | Total packets | Discarded packets |
| A | 0 | 21 | 0 |
| B | 0 | 21 | 0 |
| C | 0 | 21 | 0 |
| D | 0 | 22 | 0 |
| Mode SS | |||
|---|---|---|---|
| Quadrant | BADHDUFLAG | Total packets | Discarded packets |
| A | 0 | 102 | 0 |
| B | 0 | 102 | 0 |
| C | 0 | 102 | 0 |
| D | 0 | 102 | 0 |
| Mode M0 | |||
|---|---|---|---|
| Quadrant | BADHDUFLAG | Total packets | Discarded packets |
| A | 0 | 11035 | 3 |
| B | 0 | 22417 | 2 |
| C | 0 | 10321 | 2 |
| D | 0 | 16905 | 2 |
| Quadrant | Total seconds | Saturated seconds | Saturation percentage |
|---|---|---|---|
| A | 5028 | 24 | 0.477327% |
| B | 5028 | 1421 | 28.261734% |
| C | 5028 | 18 | 0.357995% |
| D | 5028 | 607 | 12.072395% |
Noise dominated data is calculated using 1-second bins in cleaned event files. If a bin has >2000 counts, and if more than 50% of those come from <1% of pixels, then it is considered to be noise-dominated and hence unusable.
| Quadrant | # 1 sec bins | Bins with >0 counts | Bins with >2000 counts | High rate bins dominated by noise | Noise dominated (total time) | Noise dominated (detector-on time) | Marked lightcurve |
|---|---|---|---|---|---|---|---|
| A | 7120 | 5029 | 18 | 18 | 0.25% | 0.36% | 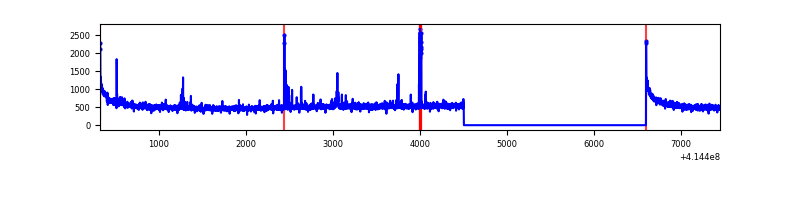 |
| B | 7120 | 5029 | 1294 | 1294 | 18.17% | 25.73% | 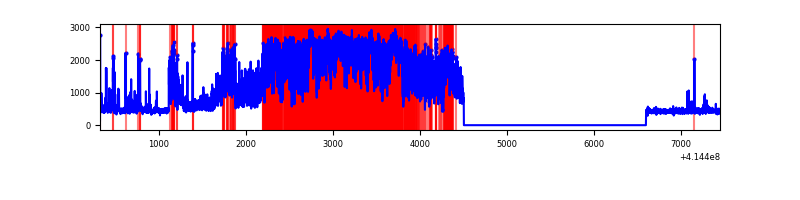 |
| C | 7120 | 5029 | 15 | 15 | 0.21% | 0.30% | 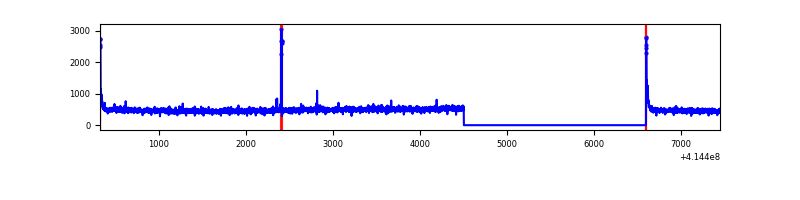 |
| D | 7119 | 5028 | 622 | 622 | 8.74% | 12.37% | 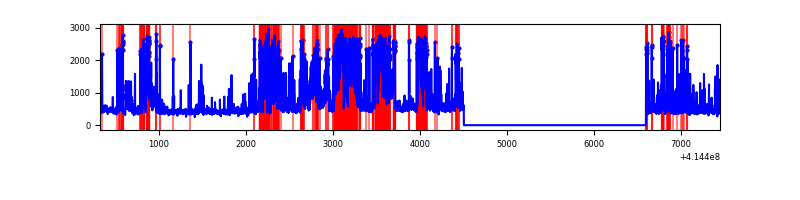 |
Top three noisy pixels from each quadrant. If the there are fewer than three noisy pixels in the level2.evt file, extra rows are filled as -1
| Pixel properties | Quadrant properties | ||||||
|---|---|---|---|---|---|---|---|
| Quadrant | DetID | PixID | Counts | Sigma | Mean | Median | Sigma |
| A | 10 | 83 | 466131 | 4046.42 | 564 | 552 | 115.1 |
| A | 13 | 248 | 56193 | 483.58 | 564 | 552 | 115.1 |
| A | 15 | 223 | 31674 | 270.49 | 564 | 552 | 115.1 |
| B | 4 | 200 | 3974218 | 40016.93 | 510 | 497 | 99.3 |
| B | 4 | 171 | 283110 | 2846.02 | 510 | 497 | 99.3 |
| B | 0 | 230 | 35565 | 353.15 | 510 | 497 | 99.3 |
| C | 15 | 214 | 217011 | 1691.74 | 549 | 553 | 127.9 |
| C | 0 | 10 | 53223 | 411.65 | 549 | 553 | 127.9 |
| C | 10 | 20 | 19307 | 146.57 | 549 | 553 | 127.9 |
| D | 2 | 250 | 946472 | 7292.22 | 528 | 513 | 129.7 |
| D | 12 | 227 | 703771 | 5421.29 | 528 | 513 | 129.7 |
| D | 1 | 47 | 307131 | 2363.66 | 528 | 513 | 129.7 |
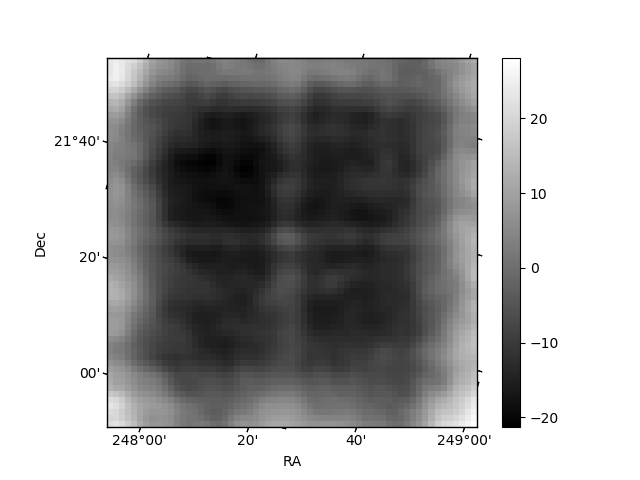
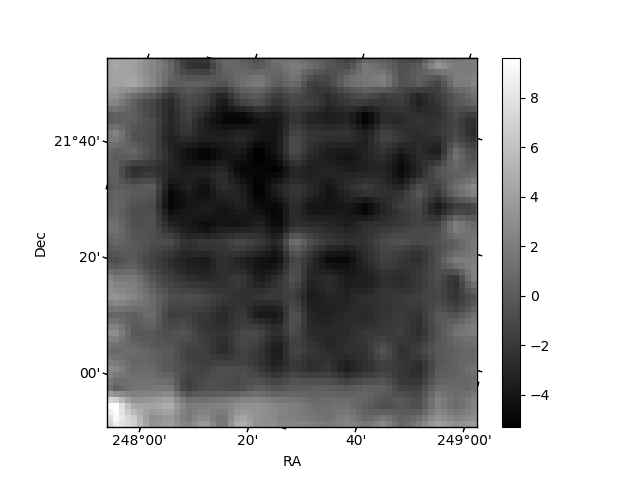
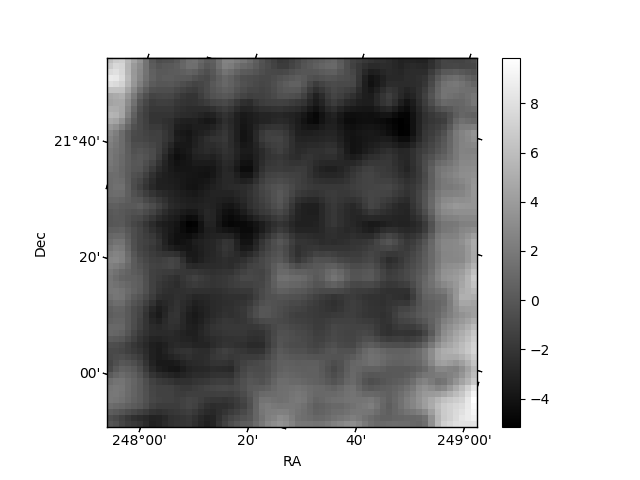
Histogram calculated using DETX and DETY for each event in the final _common_clean file
| Quadrant A | 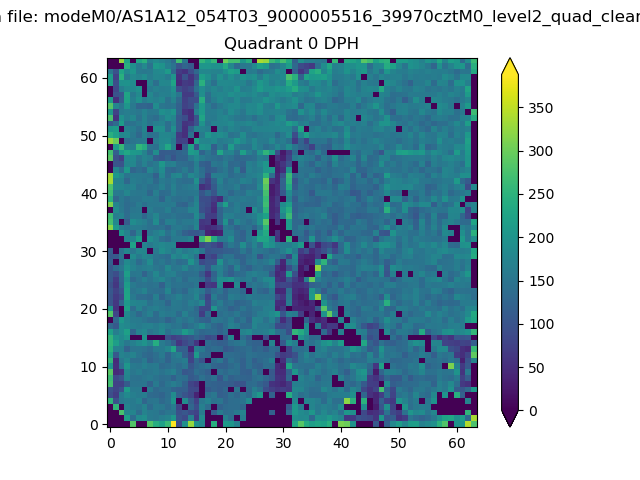 |
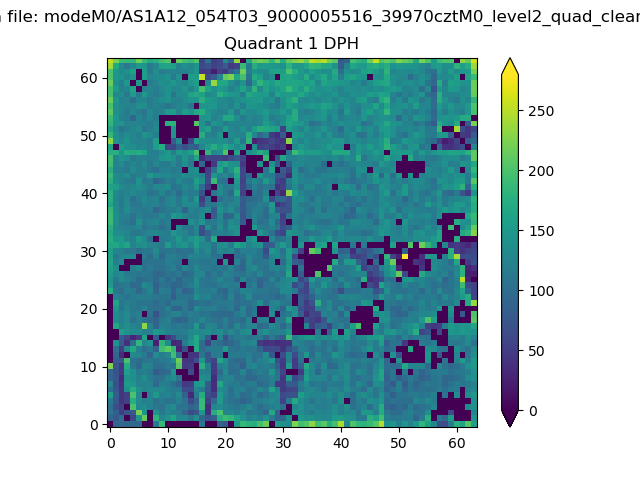 |
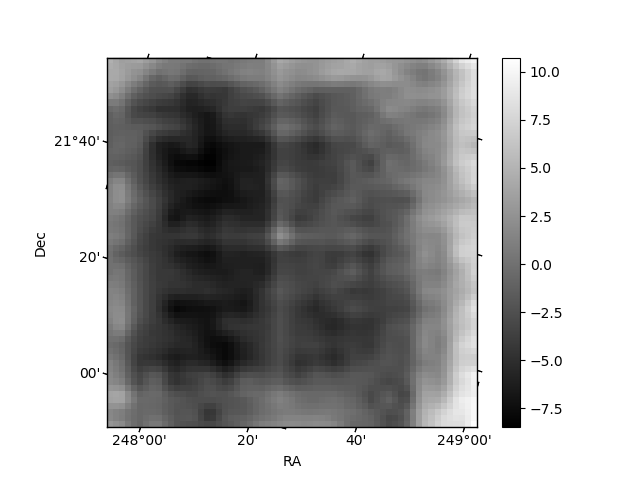
Quadrant B |
|---|---|---|---|
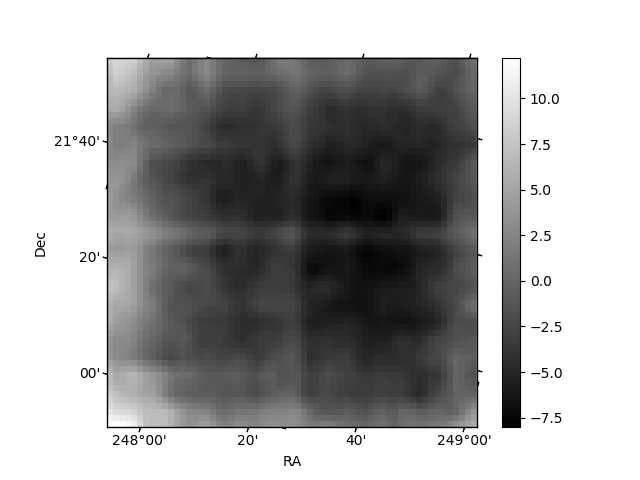
| Quadrant D | 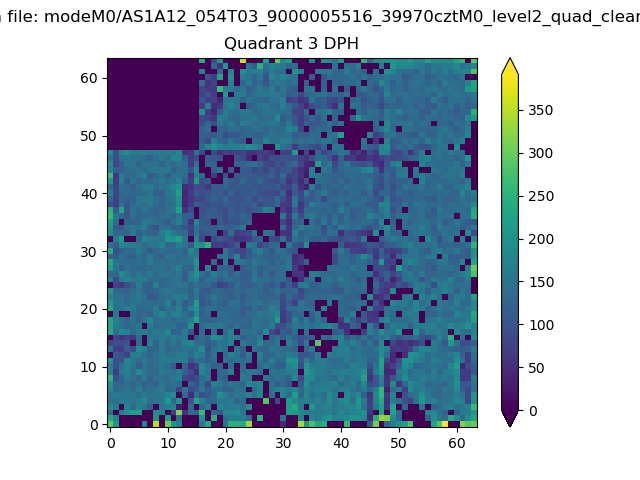 |
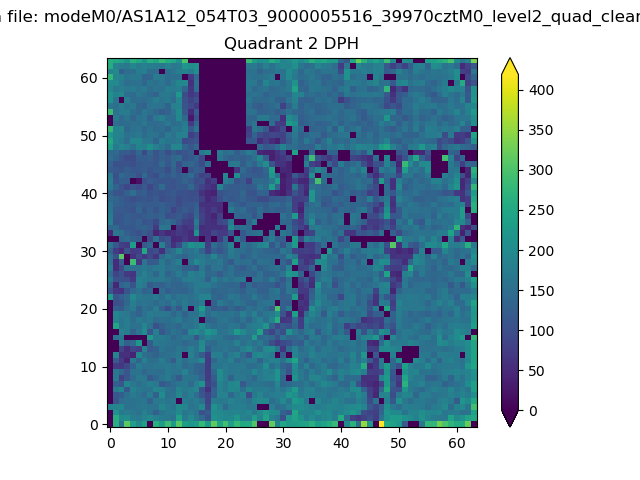 |
Quadrant C |
| Plot type | Count rate plots | Images |
|---|---|---|
| Comparison with Poisson distribution Blue bars denote a histogram of data divided into 1 sec bins. Red curve is a Poisson curve with rate = median count rate of data. |
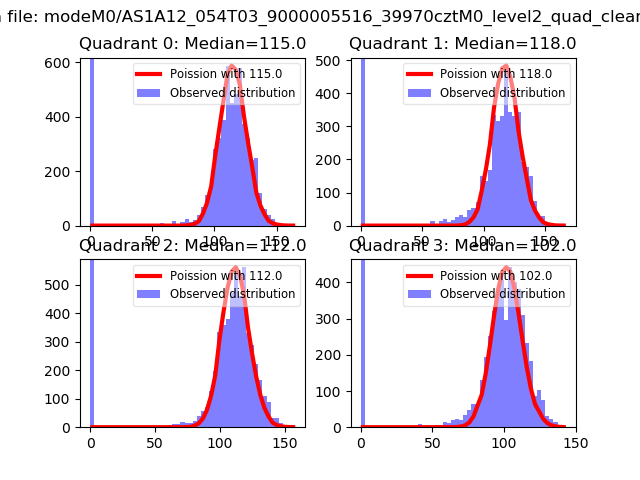 |
 |
| Quadrant-wise count rates Data is divided into 100 sec bins |
 |
|
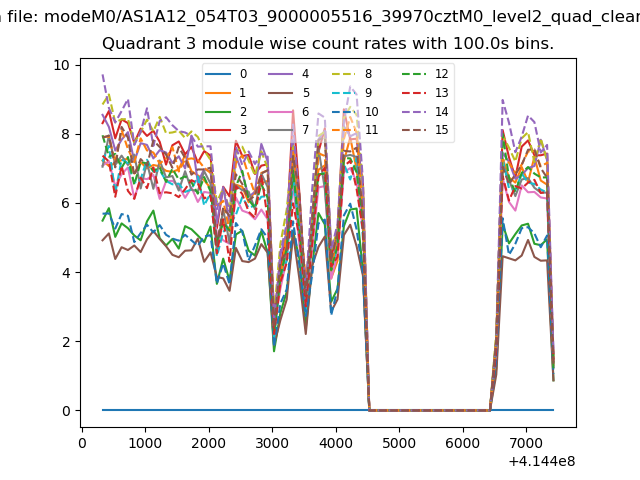
| Module-wise count rates for Quadrant A Data is divided into 100 sec bins |
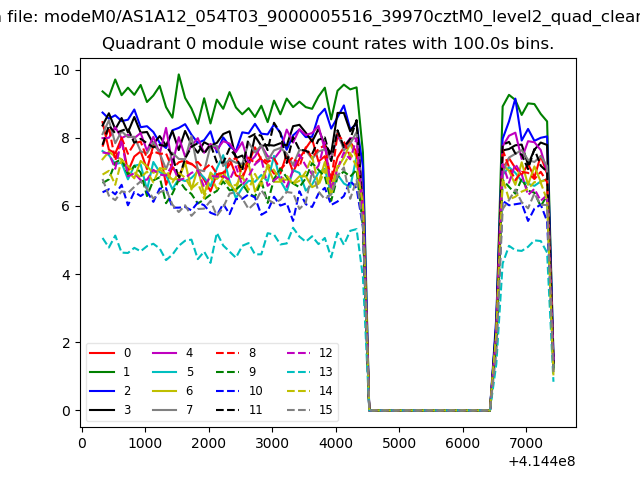 |
 |
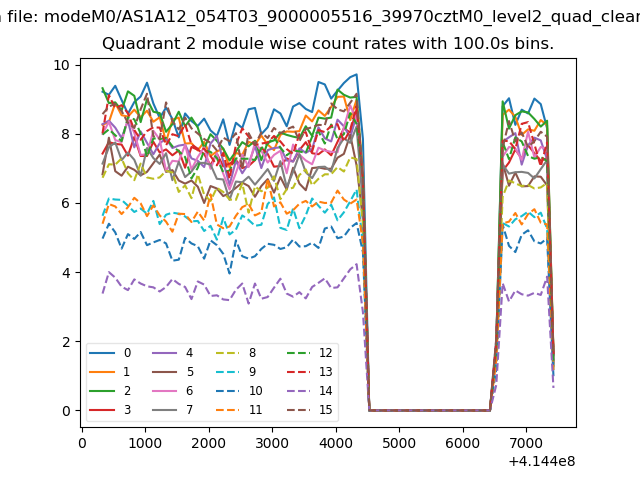
| Module-wise count rates for Quadrant B Data is divided into 100 sec bins |
 |
 |
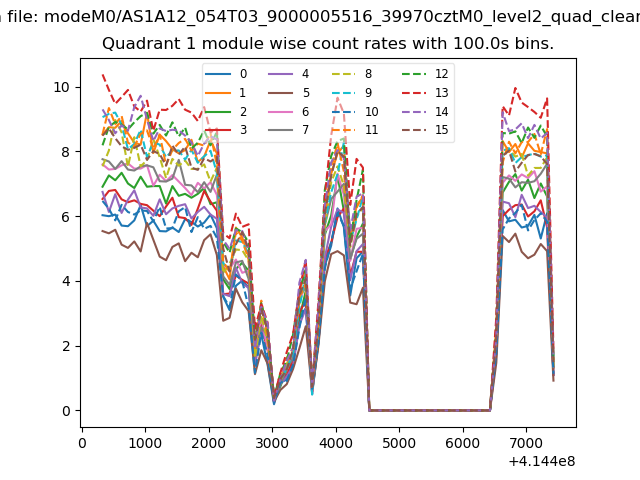
| Module-wise count rates for Quadrant C Data is divided into 100 sec bins |
 |
 |
| Module-wise count rates for Quadrant D Data is divided into 100 sec bins |
 |
 |
| Parameter | Plot |
|---|---|
| CZT HV Monitor | 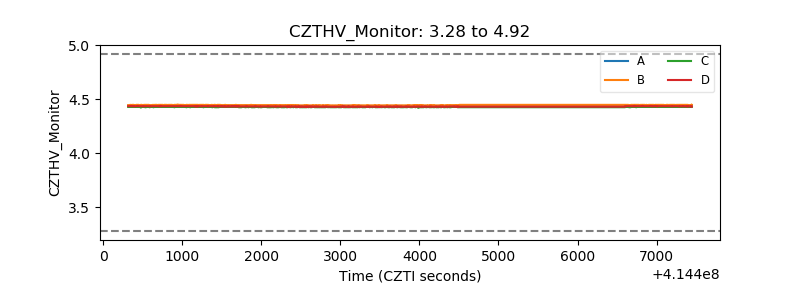 |
| D_VDD | 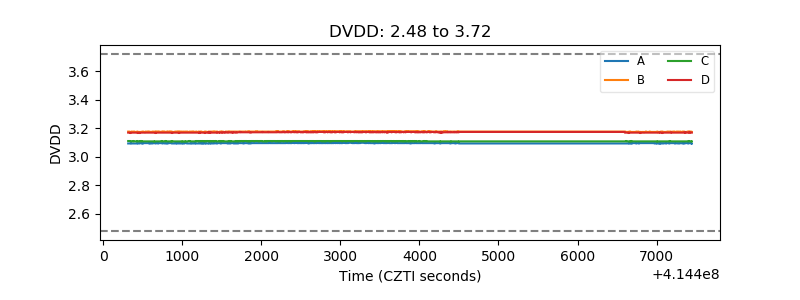 |
| Temperature 1 | 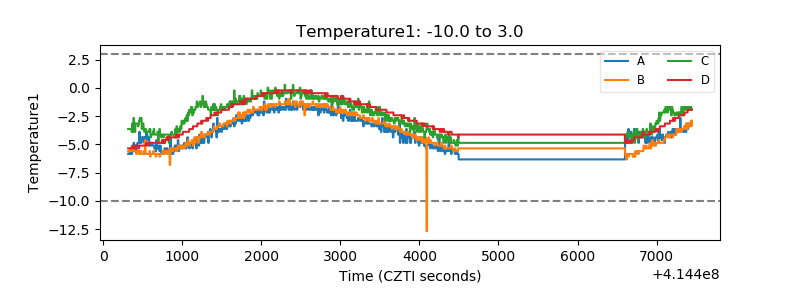 |
| Veto HV Monitor | 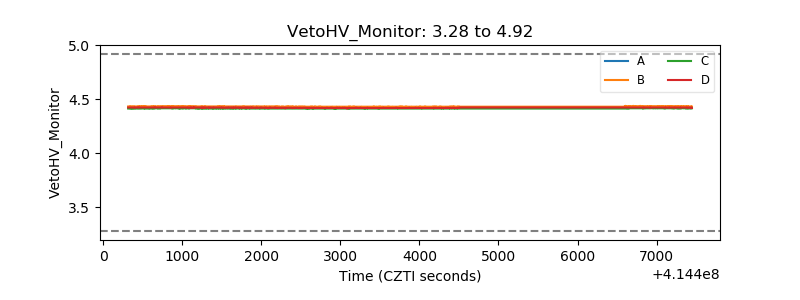 |
| Veto LLD | 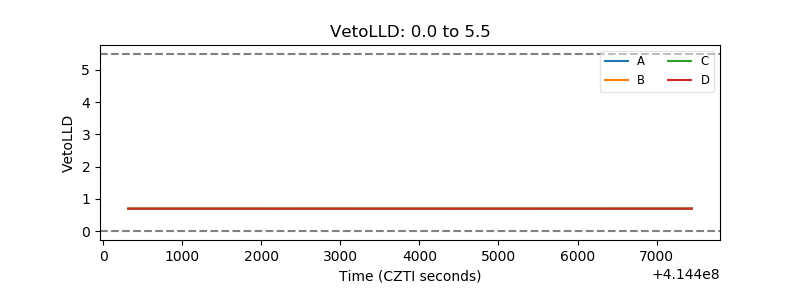 |
| Alpha Counter | 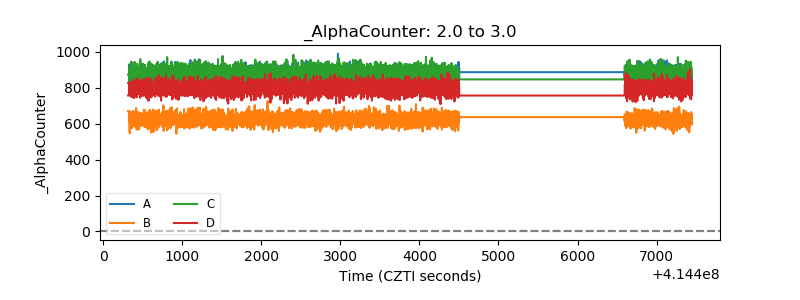 |
| _CPM_Rate | 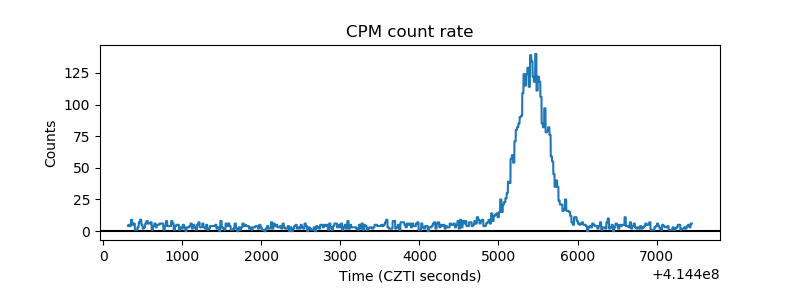 |
| CZT Counter | 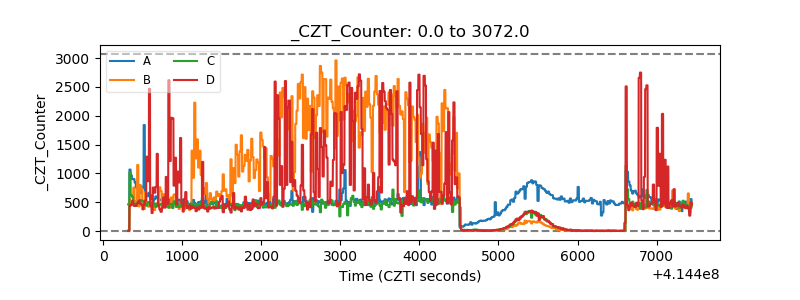 |
| +2.5 Volts monitor | 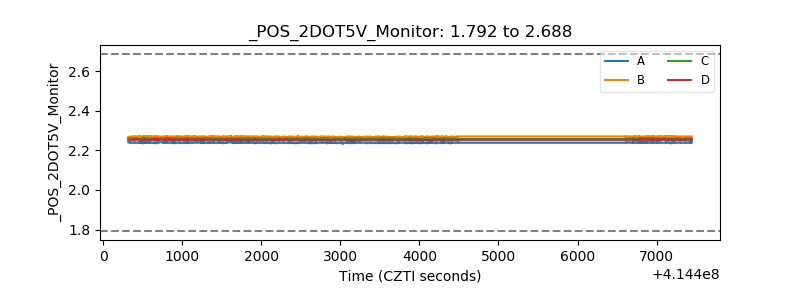 |
| +5 Volts monitor |  |
| _ROLL_ROT | 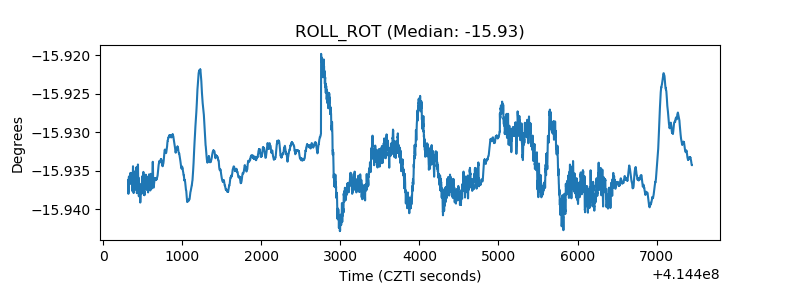 |
| _Roll_DEC | 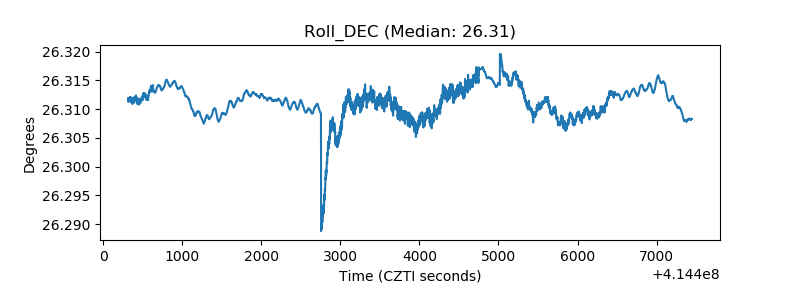 |
| _Roll_RA | 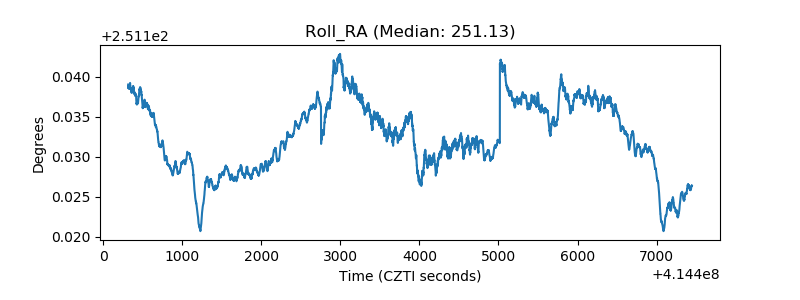 |
| Veto Counter | 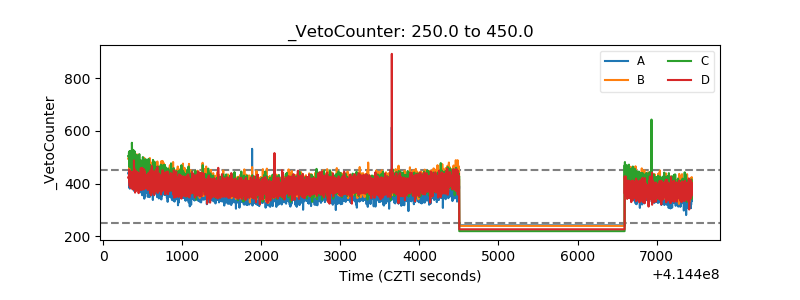 |