| Param | Original file | Final file |
|---|---|---|
| Filename | modeM0/AS1A12_054T03_9000005516_39971cztM0_level2.fits | modeM0/AS1A12_054T03_9000005516_39971cztM0_level2_quad_clean.evt |
| Size (bytes) | 373,731,840 | 83,396,160 |
| Size | 356.4 MB | 79.5 MB |
| Events in quadrant A | 2,752,871 | 574,940 |
| Events in quadrant B | 3,006,960 | 580,661 |
| Events in quadrant C | 2,506,884 | 561,802 |
| Events in quadrant D | 5,164,751 | 445,285 |
| Mode M9 | |||
|---|---|---|---|
| Quadrant | BADHDUFLAG | Total packets | Discarded packets |
| A | 0 | 29 | 0 |
| B | 0 | 29 | 0 |
| C | 0 | 29 | 0 |
| D | 0 | 30 | 0 |
| Mode SS | |||
|---|---|---|---|
| Quadrant | BADHDUFLAG | Total packets | Discarded packets |
| A | 0 | 106 | 0 |
| B | 0 | 106 | 0 |
| C | 0 | 106 | 0 |
| D | 0 | 106 | 0 |
| Mode M0 | |||
|---|---|---|---|
| Quadrant | BADHDUFLAG | Total packets | Discarded packets |
| A | 0 | 11146 | 3 |
| B | 0 | 12403 | 2 |
| C | 0 | 10641 | 2 |
| D | 0 | 18888 | 2 |
| Quadrant | Total seconds | Saturated seconds | Saturation percentage |
|---|---|---|---|
| A | 5172 | 11 | 0.212684% |
| B | 5172 | 155 | 2.996906% |
| C | 5172 | 14 | 0.270688% |
| D | 5172 | 841 | 16.260634% |
Noise dominated data is calculated using 1-second bins in cleaned event files. If a bin has >2000 counts, and if more than 50% of those come from <1% of pixels, then it is considered to be noise-dominated and hence unusable.
| Quadrant | # 1 sec bins | Bins with >0 counts | Bins with >2000 counts | High rate bins dominated by noise | Noise dominated (total time) | Noise dominated (detector-on time) | Marked lightcurve |
|---|---|---|---|---|---|---|---|
| A | 7025 | 5173 | 11 | 11 | 0.16% | 0.21% | 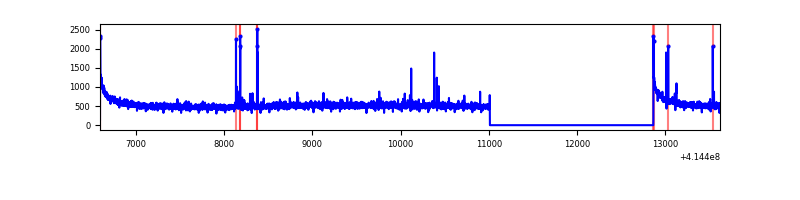 |
| B | 7025 | 5173 | 118 | 118 | 1.68% | 2.28% | 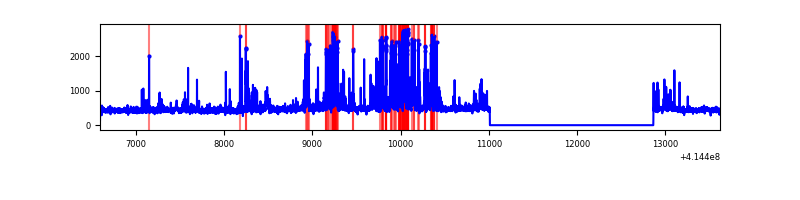 |
| C | 7025 | 5173 | 15 | 15 | 0.21% | 0.29% | 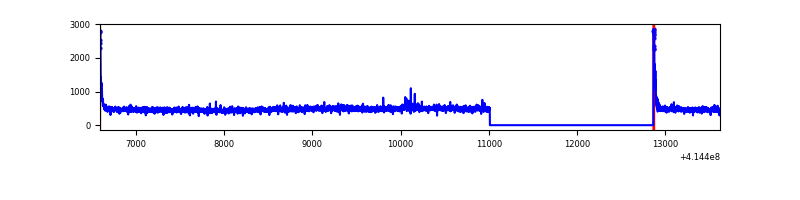 |
| D | 7025 | 5173 | 856 | 856 | 12.19% | 16.55% | 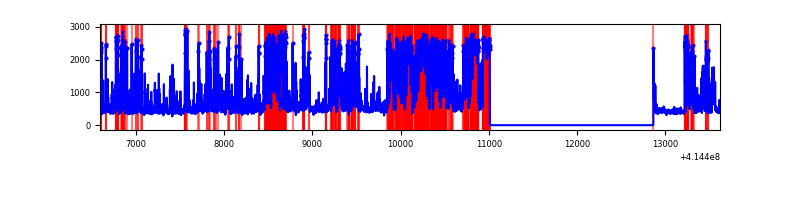 |
Top three noisy pixels from each quadrant. If the there are fewer than three noisy pixels in the level2.evt file, extra rows are filled as -1
| Pixel properties | Quadrant properties | ||||||
|---|---|---|---|---|---|---|---|
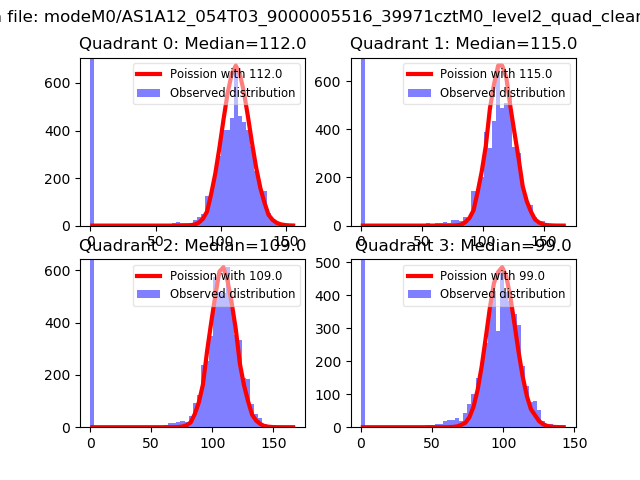
| Quadrant | DetID | PixID | Counts | Sigma | Mean | Median | Sigma |
| A | 10 | 83 | 477224 | 4031.78 | 573 | 562 | 118.2 |
| A | 13 | 248 | 31806 | 264.27 | 573 | 562 | 118.2 |
| A | 2 | 79 | 17846 | 146.19 | 573 | 562 | 118.2 |
| B | 5 | 32 | 540525 | 4873.68 | 565 | 550 | 110.8 |
| B | 4 | 171 | 141969 | 1276.41 | 565 | 550 | 110.8 |
| B | 5 | 255 | 27351 | 241.9 | 565 | 550 | 110.8 |
| C | 15 | 214 | 220485 | 1661.7 | 559 | 562 | 132.3 |
| C | 0 | 10 | 76604 | 574.56 | 559 | 562 | 132.3 |
| C | 3 | 233 | 13745 | 99.61 | 559 | 562 | 132.3 |
| D | 2 | 249 | 908057 | 7041.3 | 523 | 509 | 128.9 |
| D | 12 | 227 | 717973 | 5566.52 | 523 | 509 | 128.9 |
| D | 5 | 32 | 680268 | 5273.98 | 523 | 509 | 128.9 |
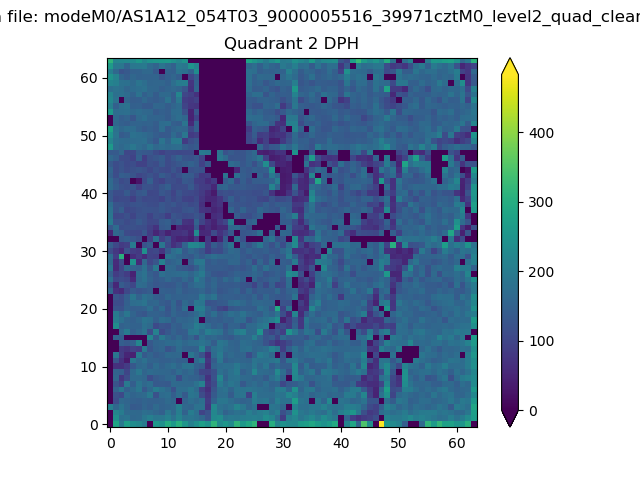
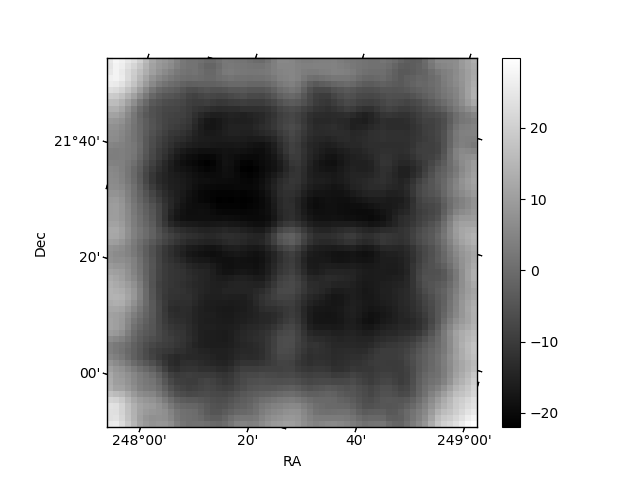
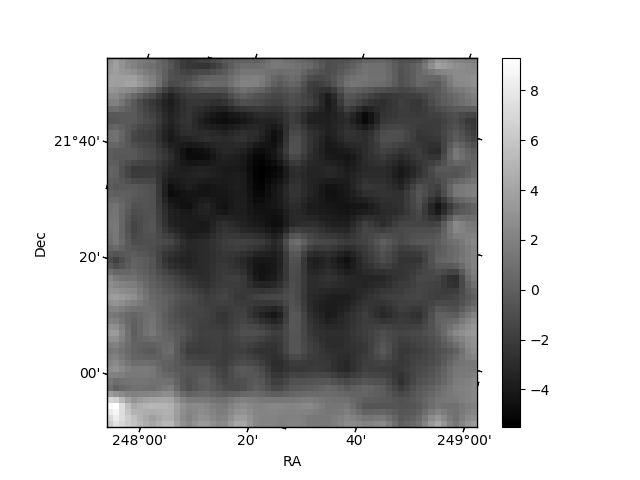
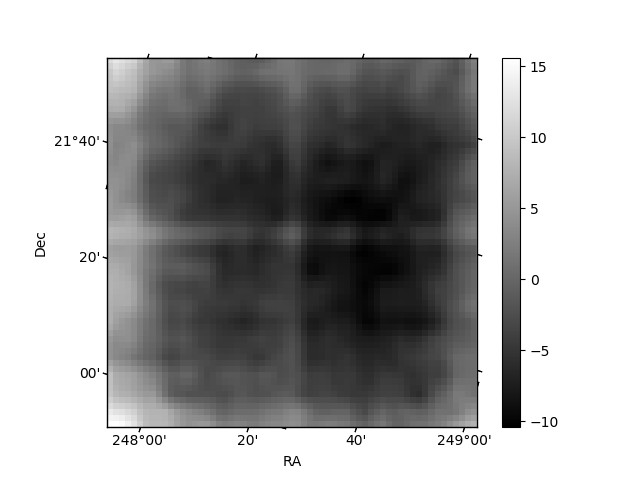
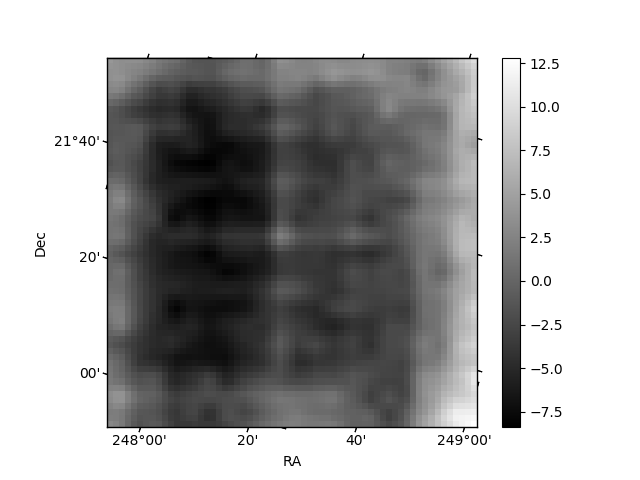
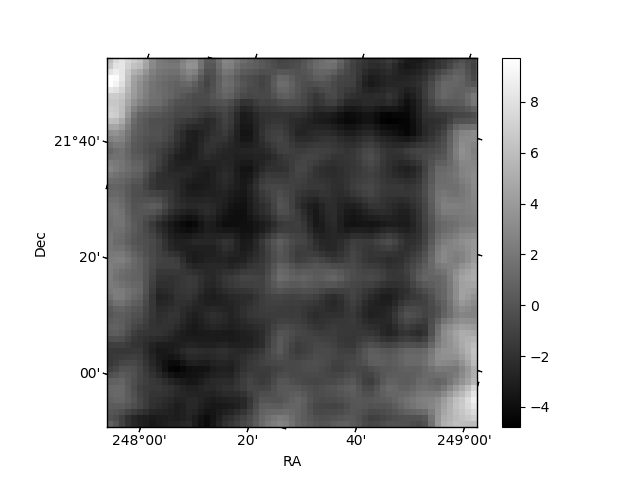
Histogram calculated using DETX and DETY for each event in the final _common_clean file
| Quadrant A | 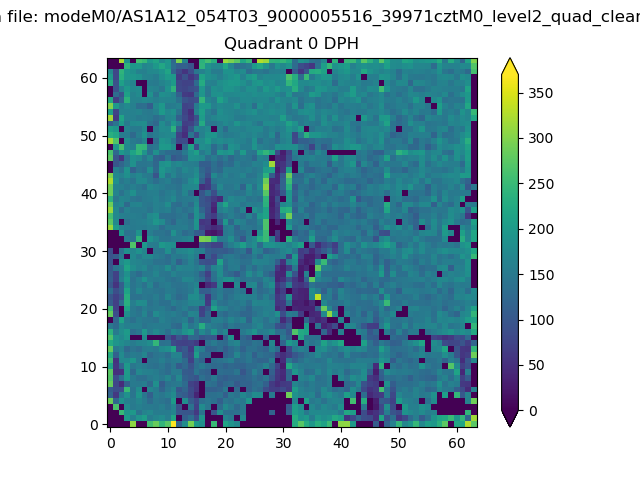 |
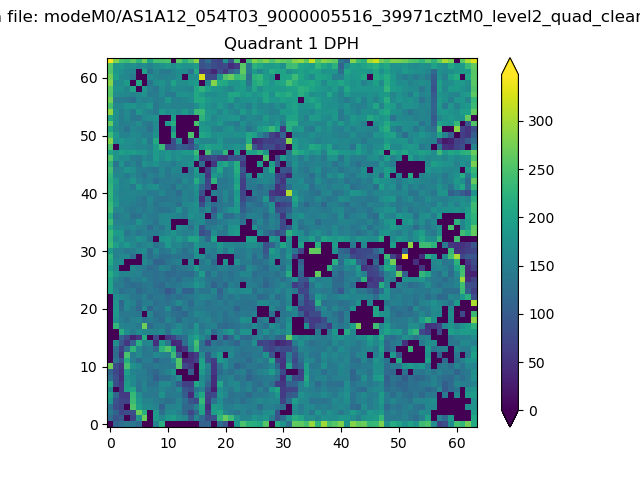 |
Quadrant B |
|---|---|---|---|
| Quadrant D | 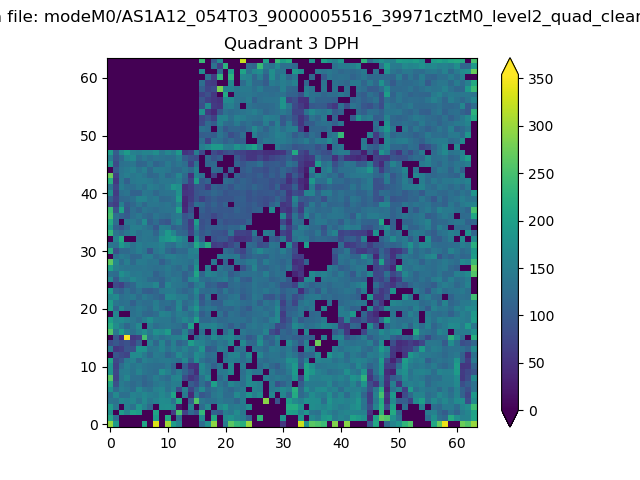 |
 |
Quadrant C |
| Plot type | Count rate plots | Images |
|---|---|---|
| Comparison with Poisson distribution Blue bars denote a histogram of data divided into 1 sec bins. Red curve is a Poisson curve with rate = median count rate of data. |
 |
 |
| Quadrant-wise count rates Data is divided into 100 sec bins |
 |
|
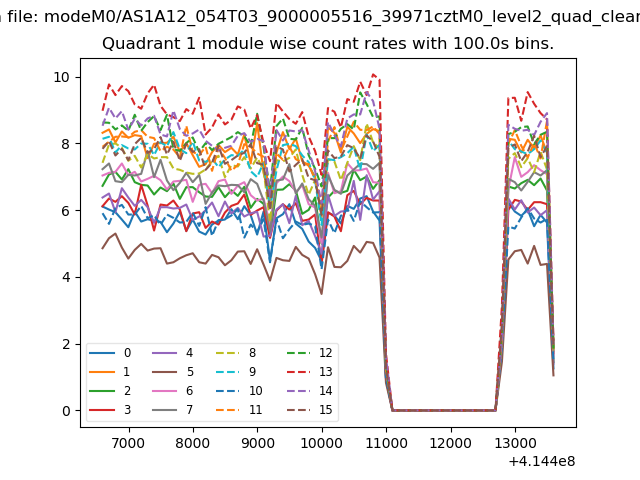
| Module-wise count rates for Quadrant A Data is divided into 100 sec bins |
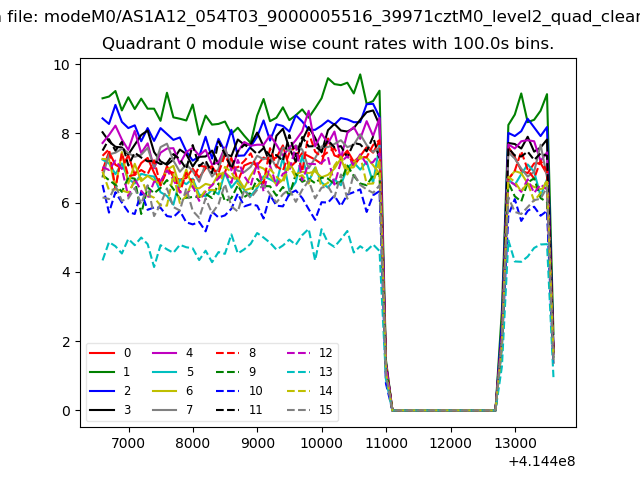 |
 |
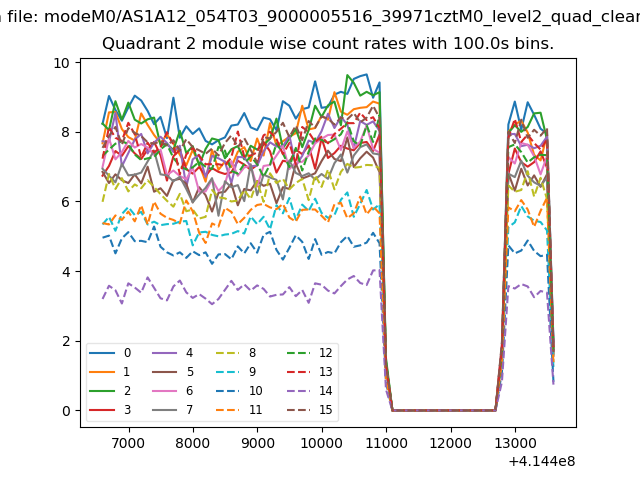
| Module-wise count rates for Quadrant B Data is divided into 100 sec bins |
 |
 |
| Module-wise count rates for Quadrant C Data is divided into 100 sec bins |
 |
 |
| Module-wise count rates for Quadrant D Data is divided into 100 sec bins |
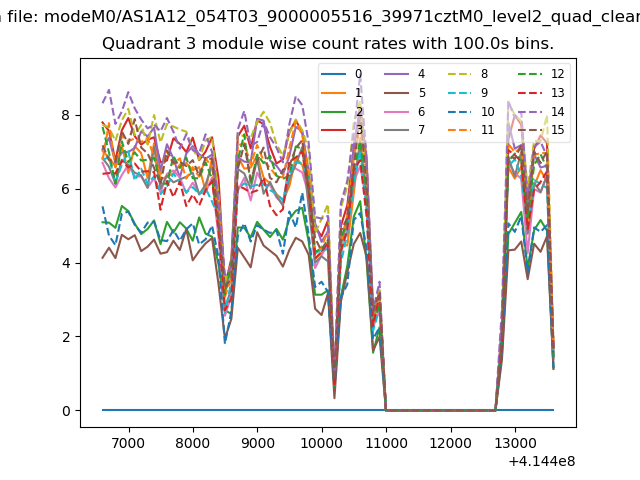 |
 |
| Parameter | Plot |
|---|---|
| CZT HV Monitor | 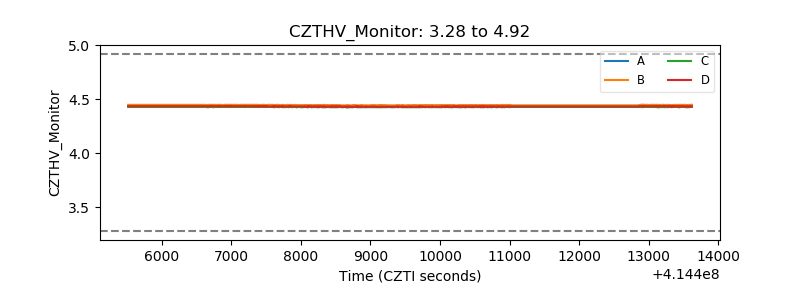 |
| D_VDD | 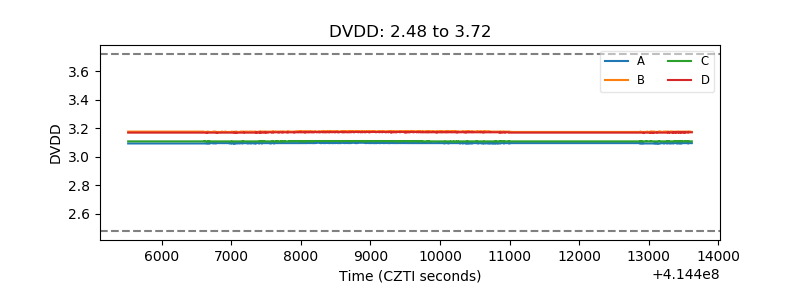 |
| Temperature 1 | 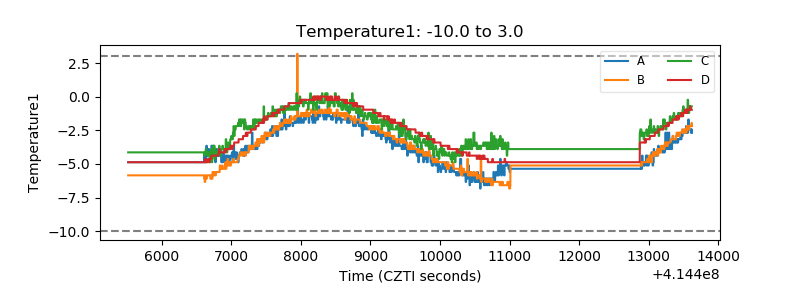 |
| Veto HV Monitor | 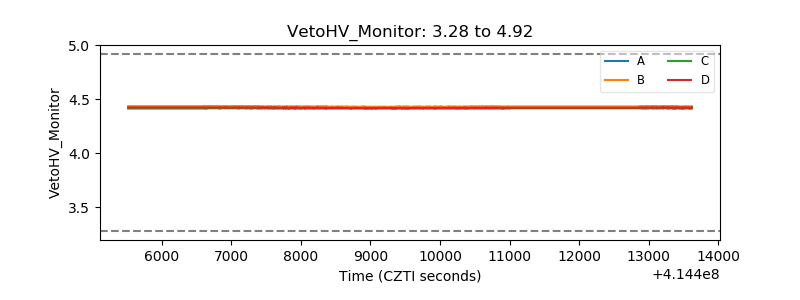 |
| Veto LLD | 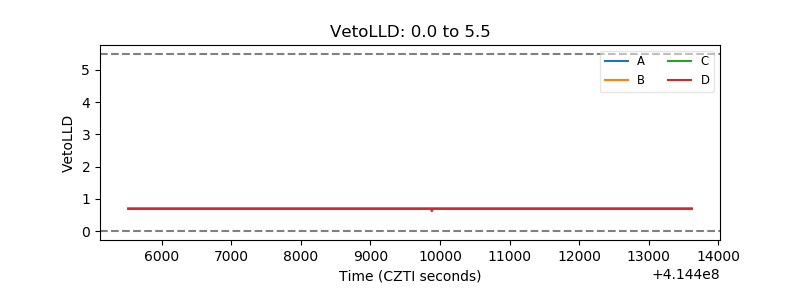 |
| Alpha Counter | 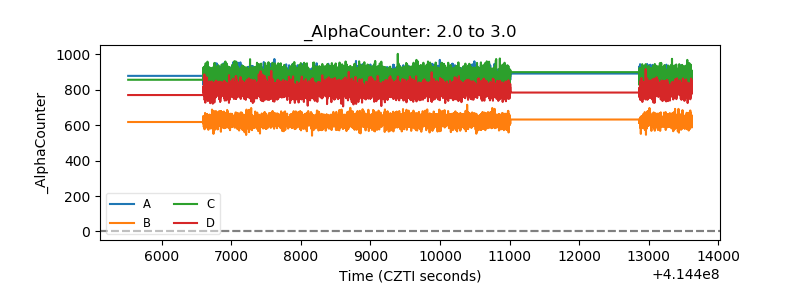 |
| _CPM_Rate | 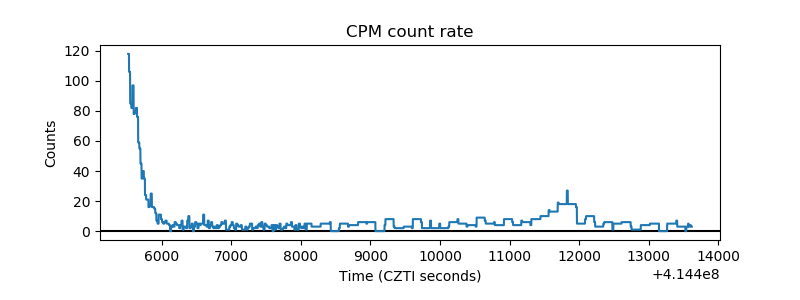 |
| CZT Counter | 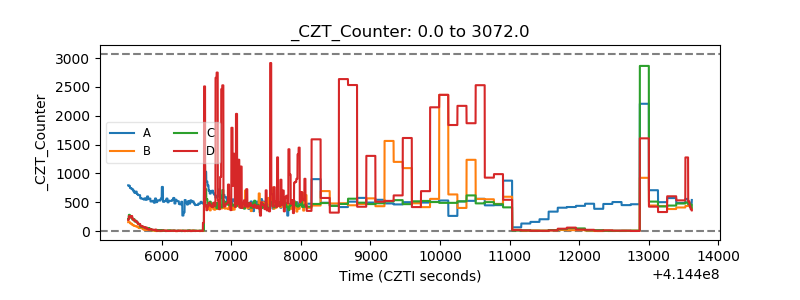 |
| +2.5 Volts monitor | 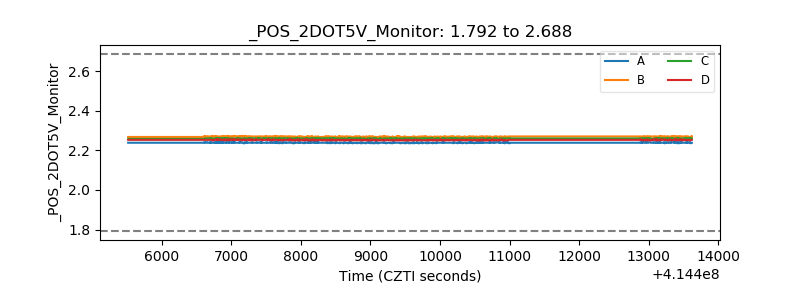 |
| +5 Volts monitor | 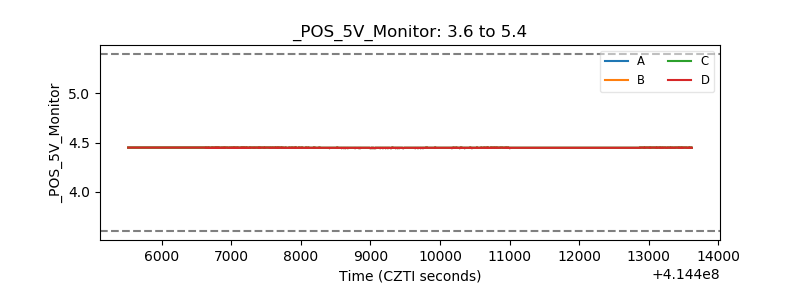 |
| _ROLL_ROT | 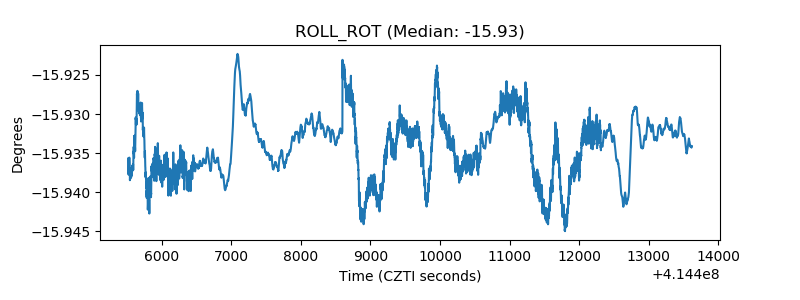 |
| _Roll_DEC | 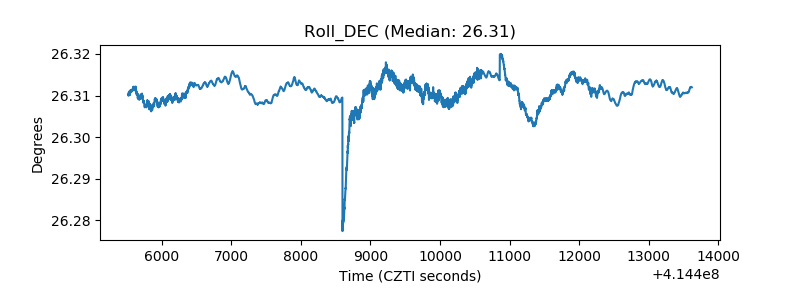 |
| _Roll_RA | 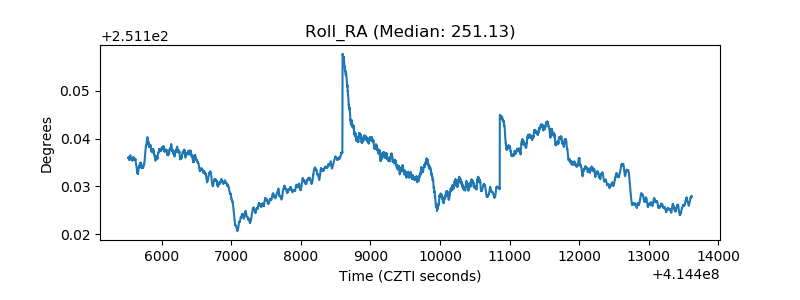 |
| Veto Counter | 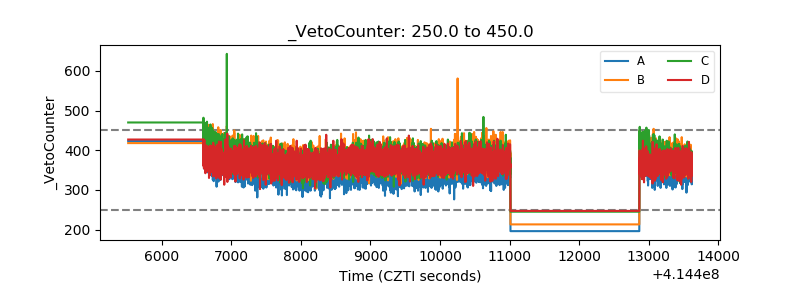 |