| Param | Original file | Final file |
|---|---|---|
| Filename | modeM0/AS1A12_054T03_9000005516_39972cztM0_level2.fits | modeM0/AS1A12_054T03_9000005516_39972cztM0_level2_quad_clean.evt |
| Size (bytes) | 418,080,960 | 89,173,440 |
| Size | 398.7 MB | 85.0 MB |
| Events in quadrant A | 3,005,105 | 613,251 |
| Events in quadrant B | 3,845,247 | 595,050 |
| Events in quadrant C | 3,543,215 | 596,439 |
| Events in quadrant D | 4,645,927 | 503,092 |
| Mode M9 | |||
|---|---|---|---|
| Quadrant | BADHDUFLAG | Total packets | Discarded packets |
| A | 0 | 18 | 0 |
| B | 0 | 18 | 0 |
| C | 0 | 18 | 0 |
| D | 0 | 19 | 0 |
| Mode SS | |||
|---|---|---|---|
| Quadrant | BADHDUFLAG | Total packets | Discarded packets |
| A | 0 | 112 | 0 |
| B | 0 | 112 | 0 |
| C | 0 | 112 | 0 |
| D | 0 | 112 | 0 |
| Mode M0 | |||
|---|---|---|---|
| Quadrant | BADHDUFLAG | Total packets | Discarded packets |
| A | 0 | 12172 | 3 |
| B | 0 | 15142 | 2 |
| C | 0 | 14070 | 2 |
| D | 0 | 17738 | 2 |
| Quadrant | Total seconds | Saturated seconds | Saturation percentage |
|---|---|---|---|
| A | 5614 | 12 | 0.213751% |
| B | 5614 | 387 | 6.893481% |
| C | 5614 | 71 | 1.264695% |
| D | 5614 | 578 | 10.295689% |
Noise dominated data is calculated using 1-second bins in cleaned event files. If a bin has >2000 counts, and if more than 50% of those come from <1% of pixels, then it is considered to be noise-dominated and hence unusable.
| Quadrant | # 1 sec bins | Bins with >0 counts | Bins with >2000 counts | High rate bins dominated by noise | Noise dominated (total time) | Noise dominated (detector-on time) | Marked lightcurve |
|---|---|---|---|---|---|---|---|
| A | 7135 | 5614 | 9 | 9 | 0.13% | 0.16% | 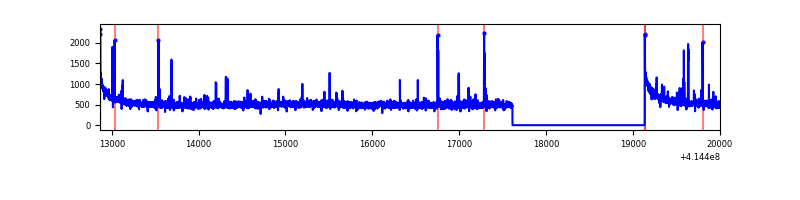 |
| B | 7136 | 5615 | 317 | 317 | 4.44% | 5.65% | 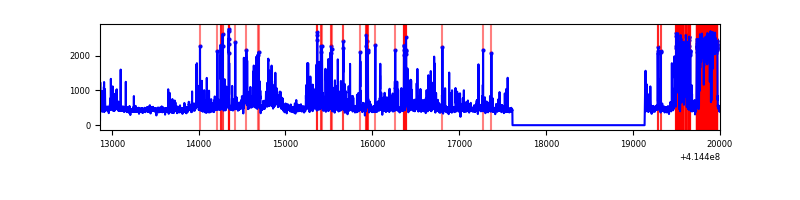 |
| C | 7136 | 5614 | 46 | 46 | 0.64% | 0.82% | 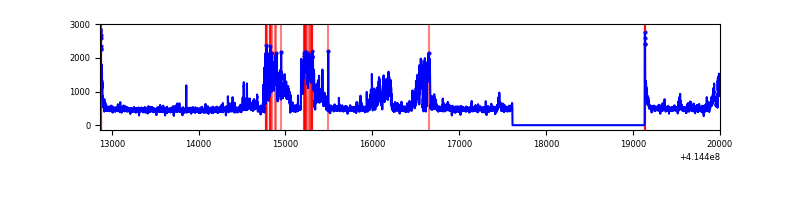 |
| D | 7136 | 5615 | 568 | 568 | 7.96% | 10.12% | 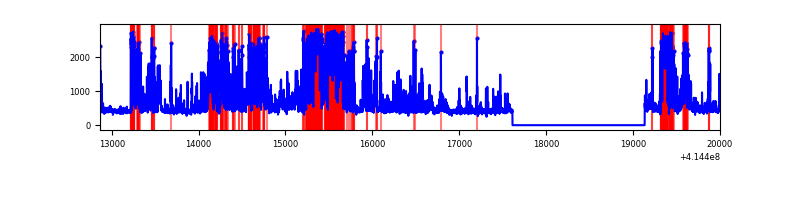 |
Top three noisy pixels from each quadrant. If the there are fewer than three noisy pixels in the level2.evt file, extra rows are filled as -1
| Pixel properties | Quadrant properties | ||||||
|---|---|---|---|---|---|---|---|
| Quadrant | DetID | PixID | Counts | Sigma | Mean | Median | Sigma |
| A | 10 | 83 | 493254 | 3880.46 | 618 | 605 | 127.0 |
| A | 2 | 79 | 44905 | 348.94 | 618 | 605 | 127.0 |
| A | 6 | 10 | 35440 | 274.39 | 618 | 605 | 127.0 |
| B | 4 | 171 | 1193231 | 10348.35 | 594 | 578 | 115.3 |
| B | 4 | 170 | 108324 | 934.88 | 594 | 578 | 115.3 |
| B | 5 | 255 | 79903 | 688.28 | 594 | 578 | 115.3 |
| C | 9 | 54 | 827457 | 5905.34 | 600 | 604 | 140.0 |
| C | 15 | 214 | 237288 | 1690.39 | 600 | 604 | 140.0 |
| C | 0 | 10 | 76192 | 539.85 | 600 | 604 | 140.0 |
| D | 2 | 250 | 1271120 | 8808.98 | 577 | 560 | 144.2 |
| D | 2 | 249 | 537659 | 3723.79 | 577 | 560 | 144.2 |
| D | 1 | 47 | 302523 | 2093.55 | 577 | 560 | 144.2 |
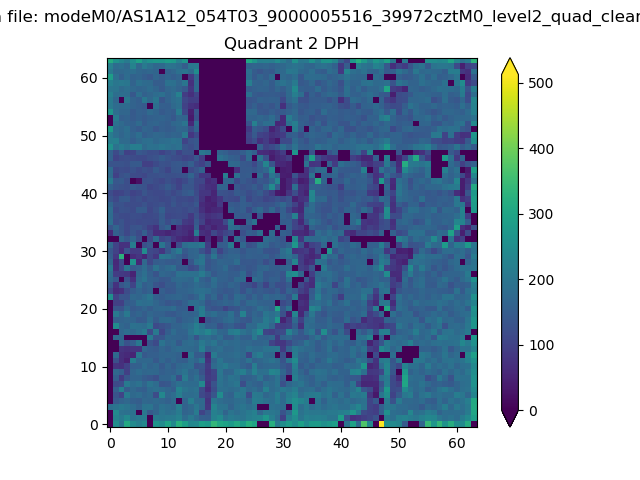
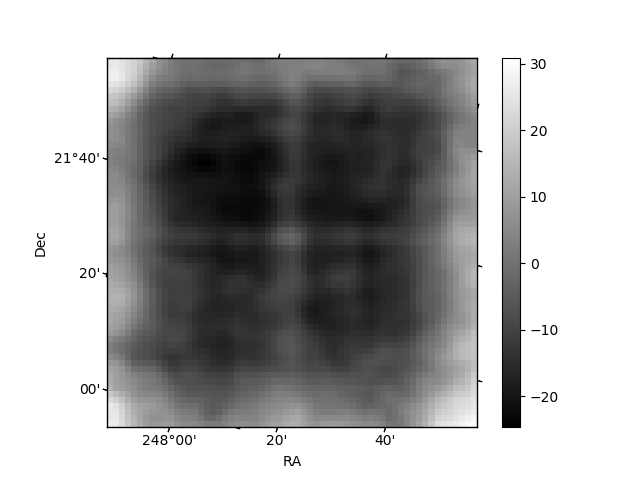
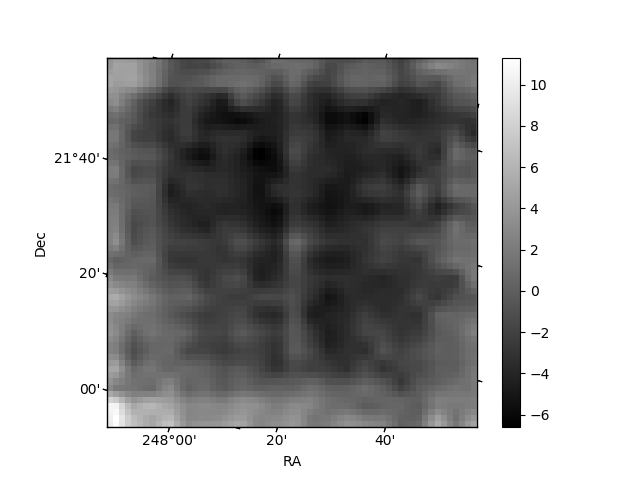
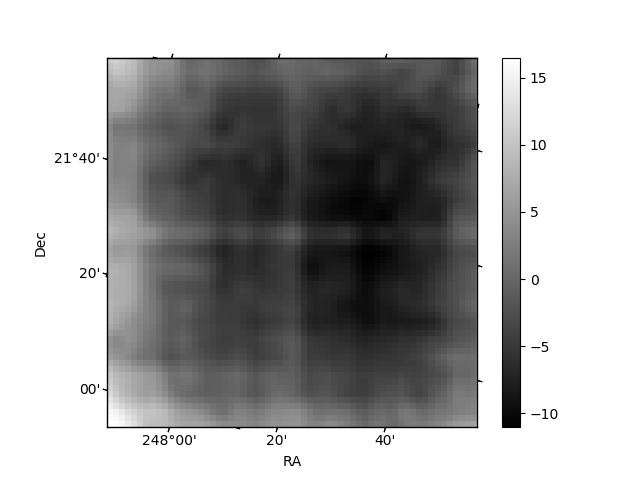
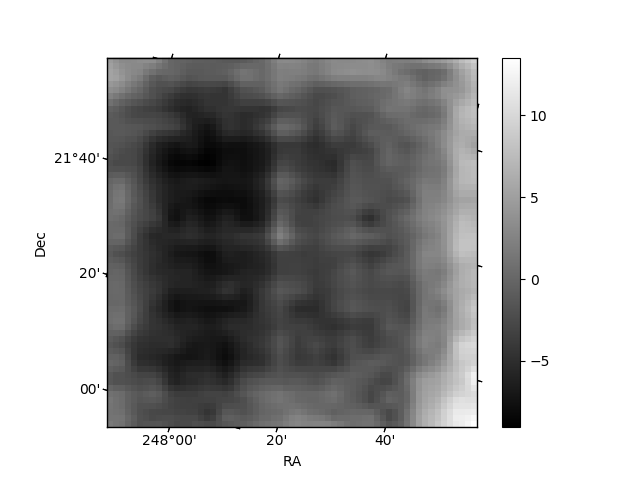
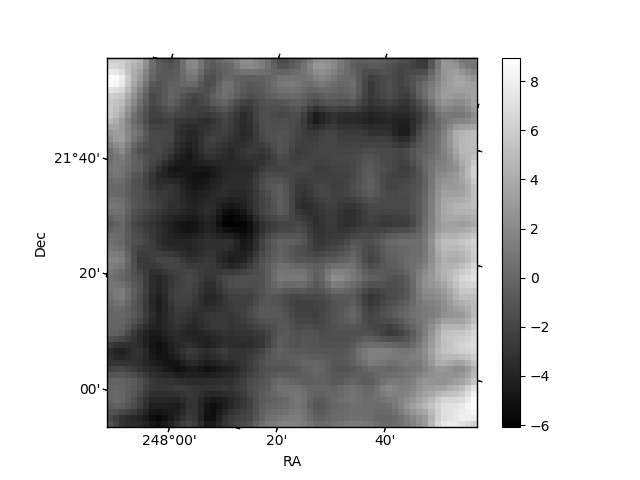
Histogram calculated using DETX and DETY for each event in the final _common_clean file
| Quadrant A | 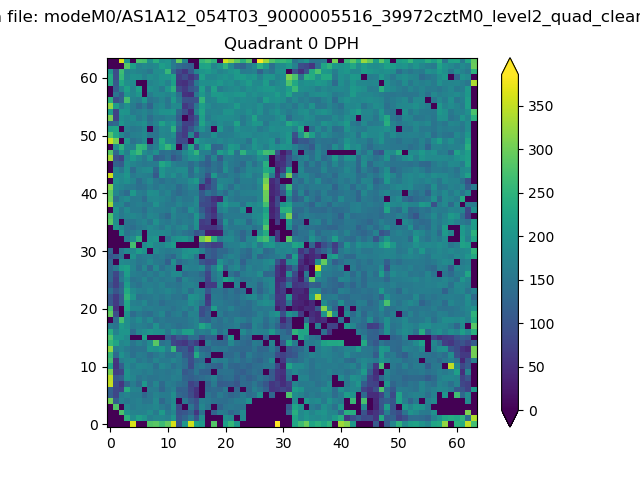 |
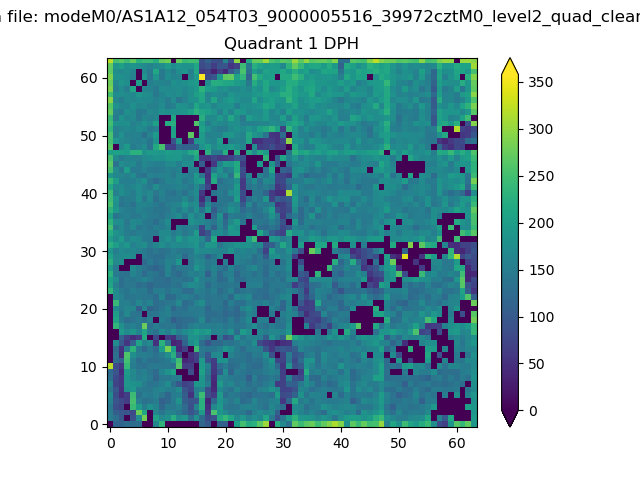 |
Quadrant B |
|---|---|---|---|
| Quadrant D | 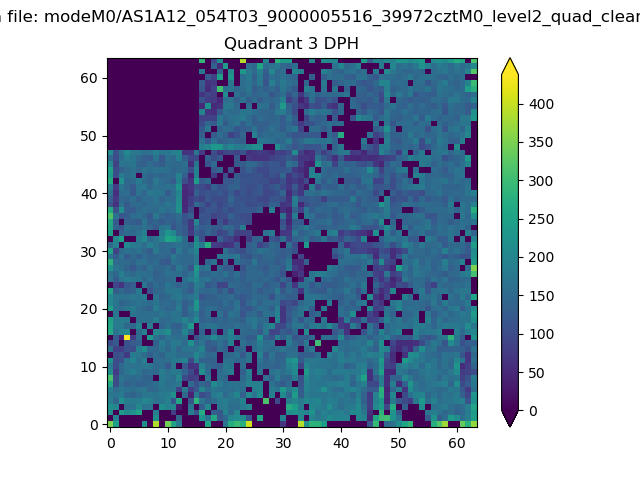 |
 |
Quadrant C |
| Plot type | Count rate plots | Images |
|---|---|---|
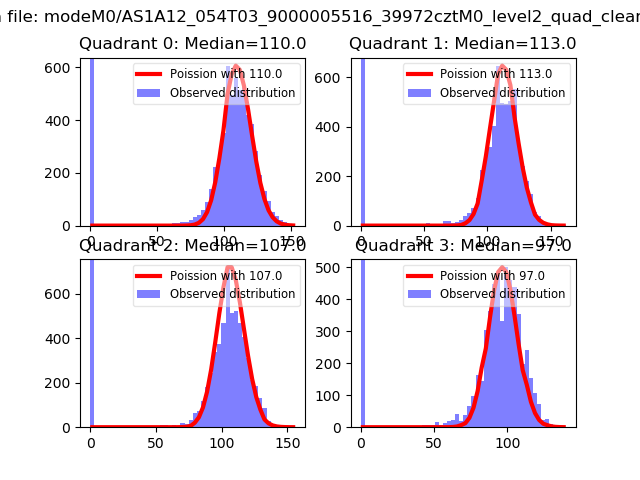
| Comparison with Poisson distribution Blue bars denote a histogram of data divided into 1 sec bins. Red curve is a Poisson curve with rate = median count rate of data. |
 |
 |
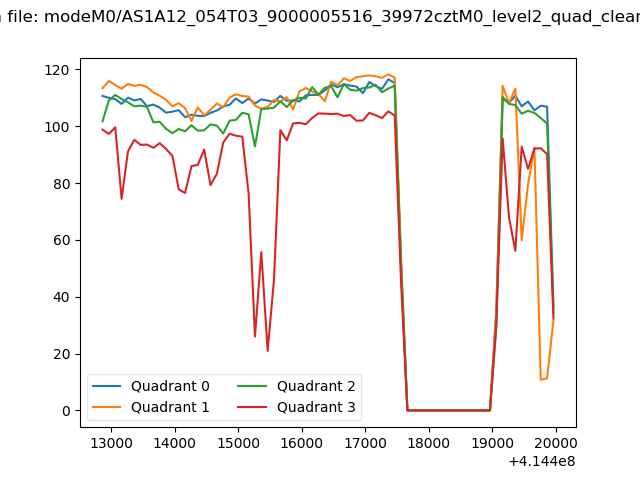
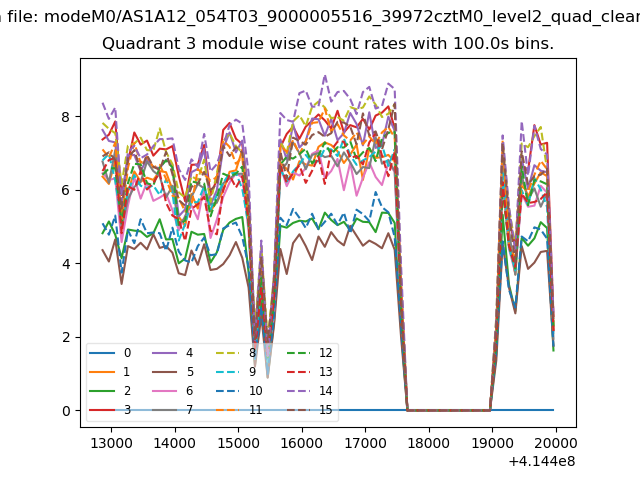
| Quadrant-wise count rates Data is divided into 100 sec bins |
 |
|
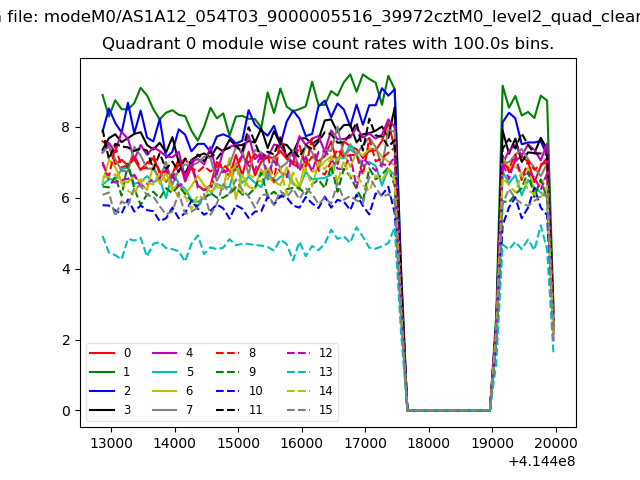
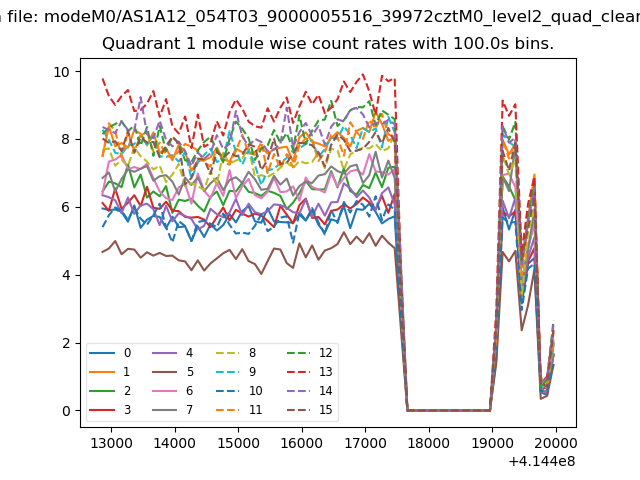
| Module-wise count rates for Quadrant A Data is divided into 100 sec bins |
 |
 |
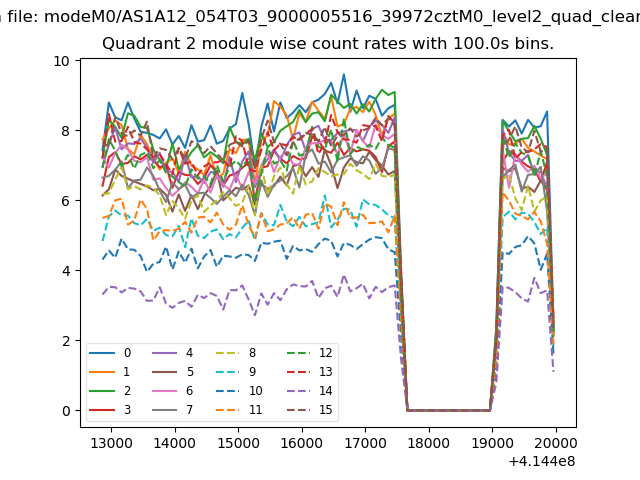
| Module-wise count rates for Quadrant B Data is divided into 100 sec bins |
 |
 |
| Module-wise count rates for Quadrant C Data is divided into 100 sec bins |
 |
 |
| Module-wise count rates for Quadrant D Data is divided into 100 sec bins |
 |
 |
| Parameter | Plot |
|---|---|
| CZT HV Monitor | 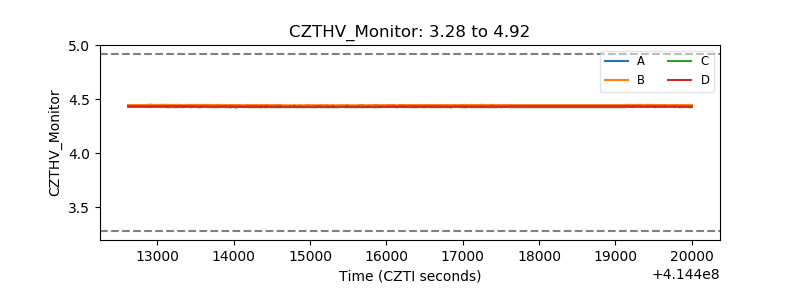 |
| D_VDD | 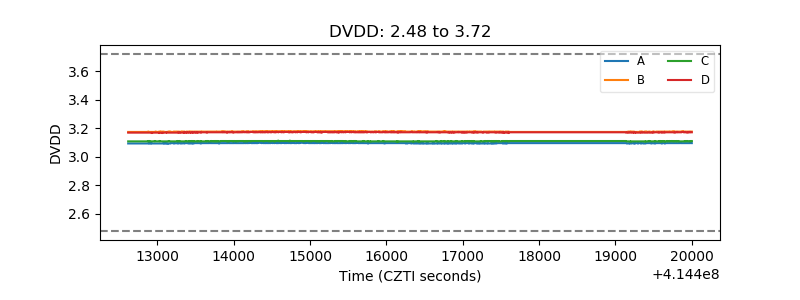 |
| Temperature 1 | 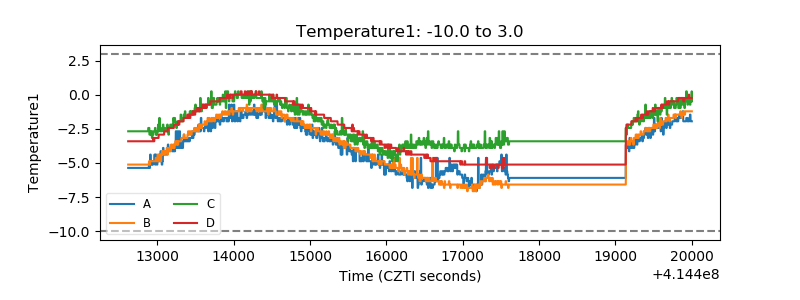 |
| Veto HV Monitor |  |
| Veto LLD | 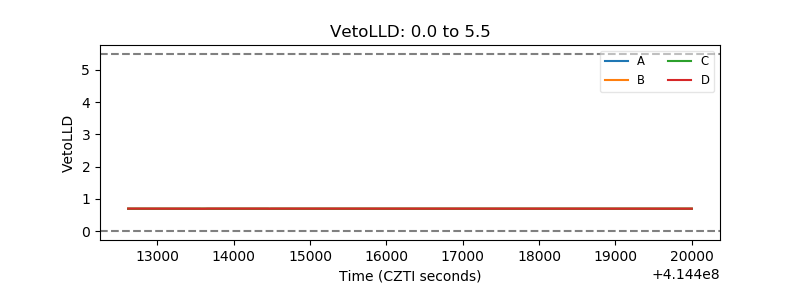 |
| Alpha Counter | 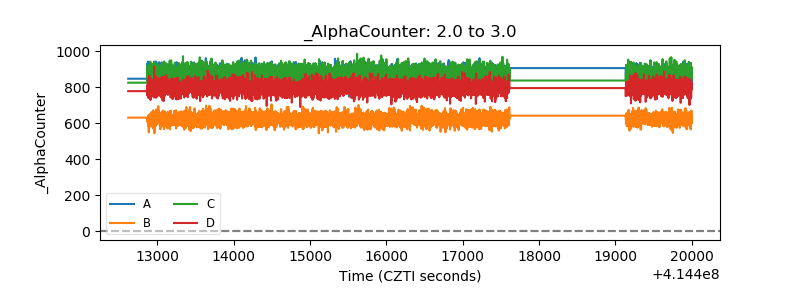 |
| _CPM_Rate | 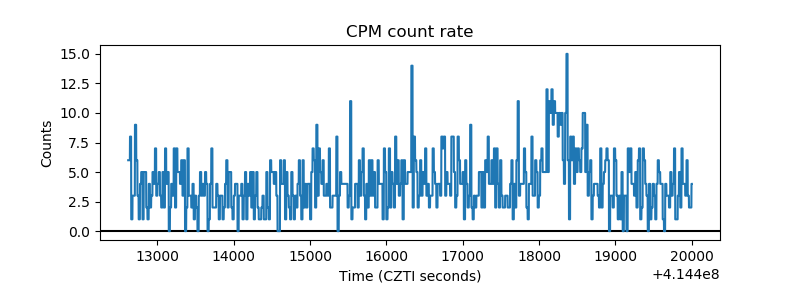 |
| CZT Counter | 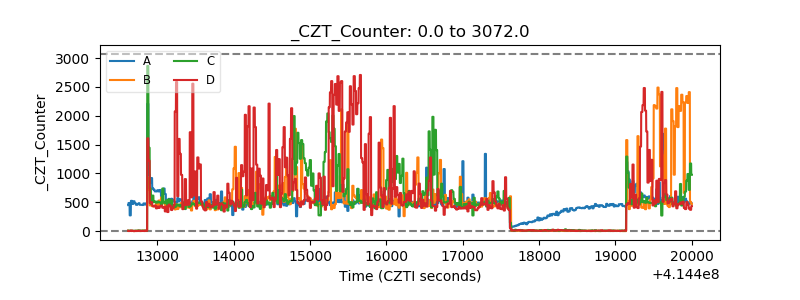 |
| +2.5 Volts monitor | 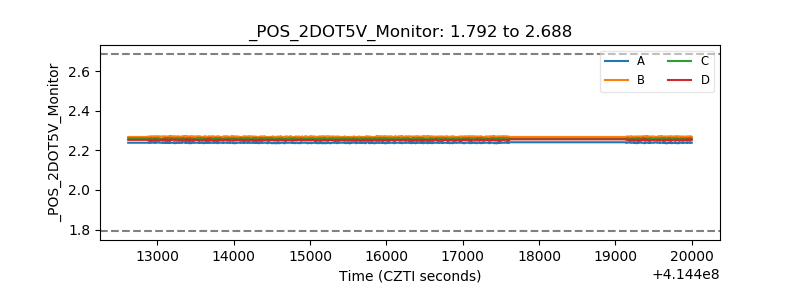 |
| +5 Volts monitor | 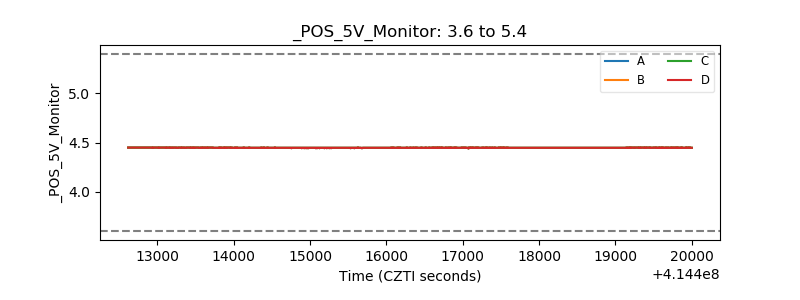 |
| _ROLL_ROT | 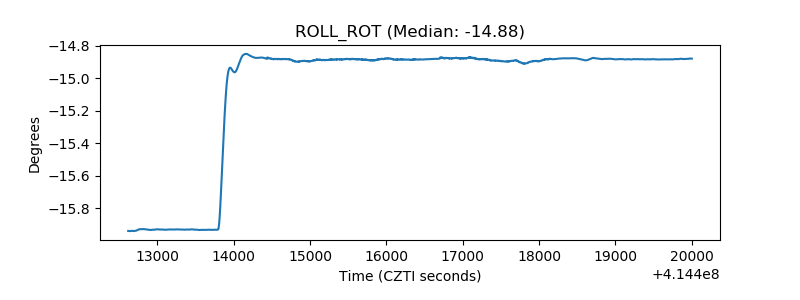 |
| _Roll_DEC | 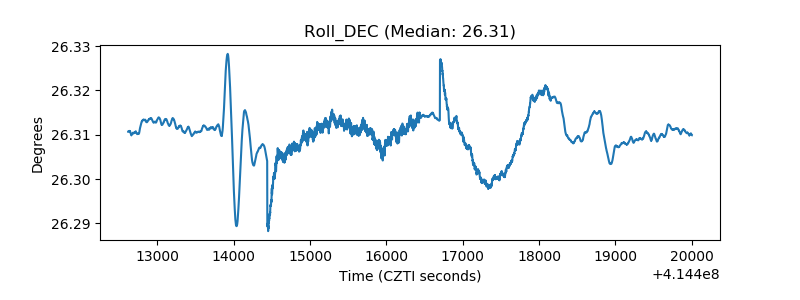 |
| _Roll_RA | 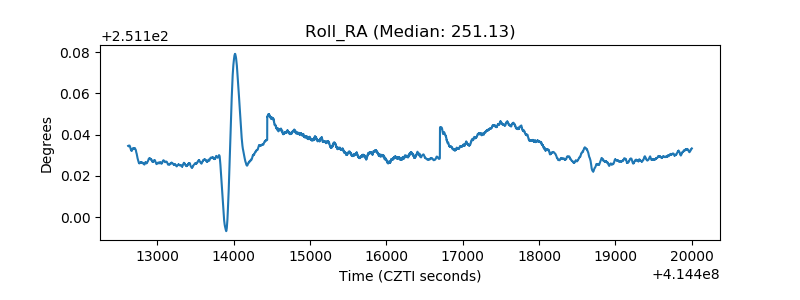 |
| Veto Counter | 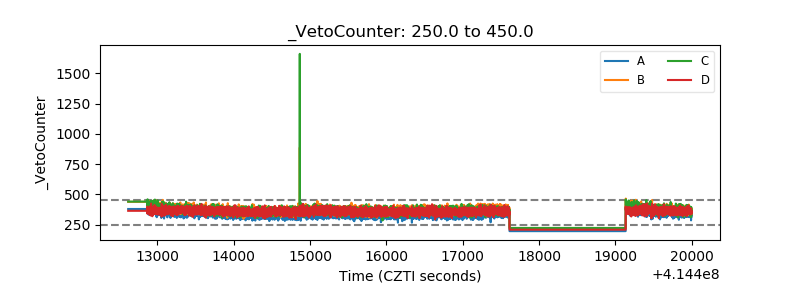 |