| Param | Original file | Final file |
|---|---|---|
| Filename | modeM0/AS1A12_054T03_9000005516_39973cztM0_level2.fits | modeM0/AS1A12_054T03_9000005516_39973cztM0_level2_quad_clean.evt |
| Size (bytes) | 394,410,240 | 93,444,480 |
| Size | 376.1 MB | 89.1 MB |
| Events in quadrant A | 3,308,861 | 638,809 |
| Events in quadrant B | 3,849,709 | 615,334 |
| Events in quadrant C | 2,970,249 | 620,105 |
| Events in quadrant D | 4,012,869 | 543,821 |
| Mode M9 | |||
|---|---|---|---|
| Quadrant | BADHDUFLAG | Total packets | Discarded packets |
| A | 0 | 20 | 0 |
| B | 0 | 20 | 0 |
| C | 0 | 20 | 0 |
| D | 0 | 21 | 0 |
| Mode SS | |||
|---|---|---|---|
| Quadrant | BADHDUFLAG | Total packets | Discarded packets |
| A | 0 | 120 | 0 |
| B | 0 | 120 | 0 |
| C | 0 | 120 | 0 |
| D | 0 | 120 | 0 |
| Mode M0 | |||
|---|---|---|---|
| Quadrant | BADHDUFLAG | Total packets | Discarded packets |
| A | 0 | 13346 | 3 |
| B | 0 | 15383 | 2 |
| C | 0 | 12477 | 2 |
| D | 0 | 16001 | 2 |
| Quadrant | Total seconds | Saturated seconds | Saturation percentage |
|---|---|---|---|
| A | 5885 | 24 | 0.407816% |
| B | 5885 | 378 | 6.423110% |
| C | 5885 | 12 | 0.203908% |
| D | 5885 | 403 | 6.847918% |
Noise dominated data is calculated using 1-second bins in cleaned event files. If a bin has >2000 counts, and if more than 50% of those come from <1% of pixels, then it is considered to be noise-dominated and hence unusable.
| Quadrant | # 1 sec bins | Bins with >0 counts | Bins with >2000 counts | High rate bins dominated by noise | Noise dominated (total time) | Noise dominated (detector-on time) | Marked lightcurve |
|---|---|---|---|---|---|---|---|
| A | 7196 | 5884 | 16 | 16 | 0.22% | 0.27% | 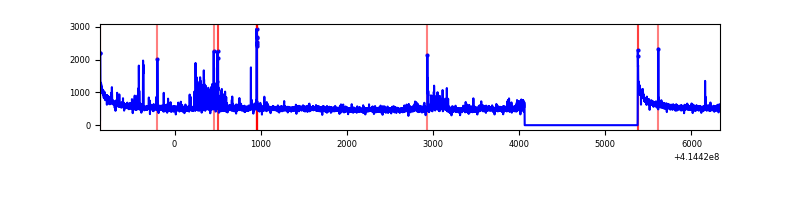 |
| B | 7196 | 5884 | 323 | 323 | 4.49% | 5.49% | 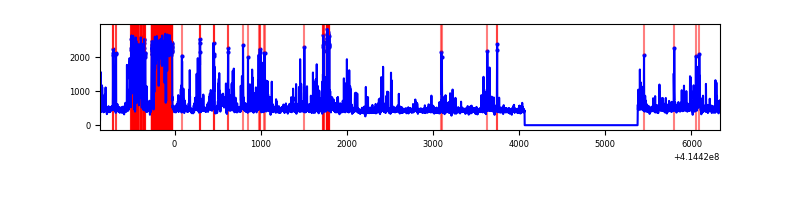 |
| C | 7196 | 5884 | 12 | 12 | 0.17% | 0.20% | 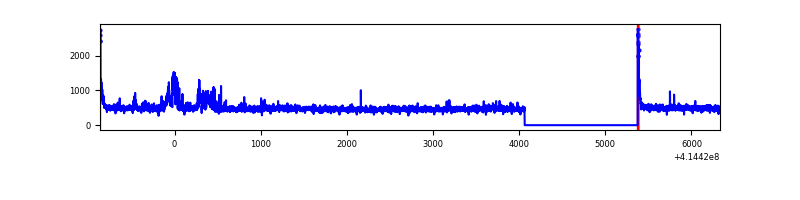 |
| D | 7196 | 5884 | 382 | 382 | 5.31% | 6.49% | 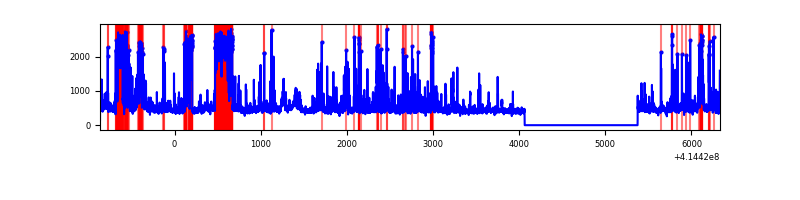 |
Top three noisy pixels from each quadrant. If the there are fewer than three noisy pixels in the level2.evt file, extra rows are filled as -1
| Pixel properties | Quadrant properties | ||||||
|---|---|---|---|---|---|---|---|
| Quadrant | DetID | PixID | Counts | Sigma | Mean | Median | Sigma |
| A | 10 | 83 | 510803 | 3835.21 | 646 | 634 | 133.0 |
| A | 6 | 10 | 263411 | 1975.43 | 646 | 634 | 133.0 |
| A | 2 | 79 | 10376 | 73.24 | 646 | 634 | 133.0 |
| B | 4 | 171 | 1227956 | 10135.3 | 621 | 603 | 121.1 |
| B | 5 | 255 | 54475 | 444.87 | 621 | 603 | 121.1 |
| B | 0 | 230 | 46461 | 378.69 | 621 | 603 | 121.1 |
| C | 15 | 214 | 246417 | 1657.69 | 630 | 634 | 148.3 |
| C | 9 | 54 | 166287 | 1117.25 | 630 | 634 | 148.3 |
| C | 0 | 10 | 65982 | 440.74 | 630 | 634 | 148.3 |
| D | 2 | 250 | 960082 | 6328.89 | 612 | 592 | 151.6 |
| D | 2 | 249 | 311398 | 2050.11 | 612 | 592 | 151.6 |
| D | 1 | 47 | 111430 | 731.1 | 612 | 592 | 151.6 |
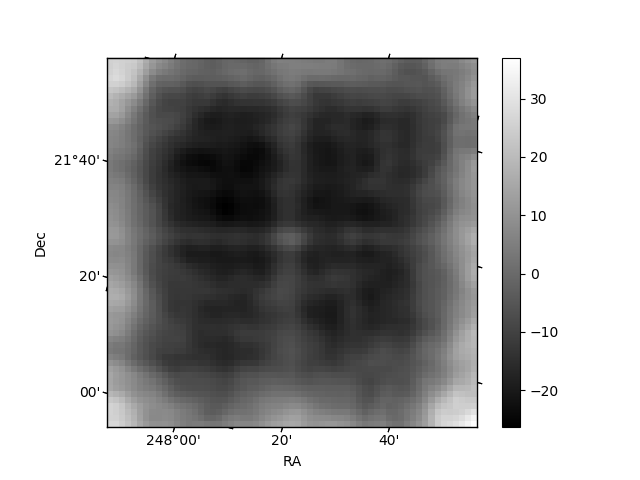
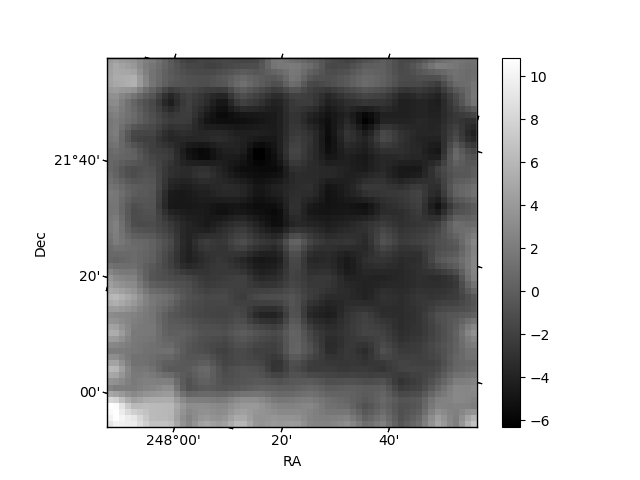
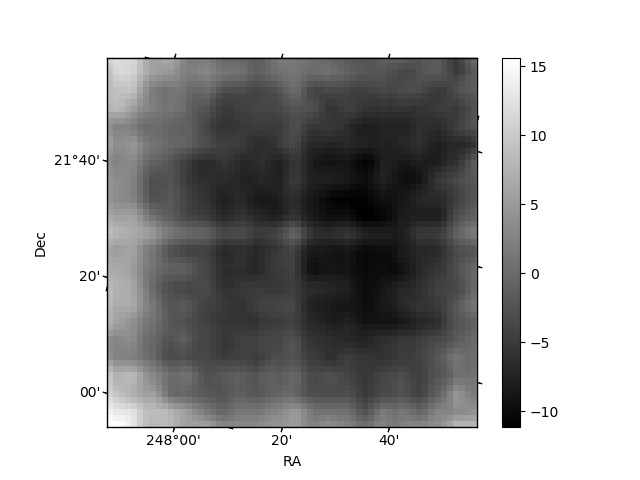
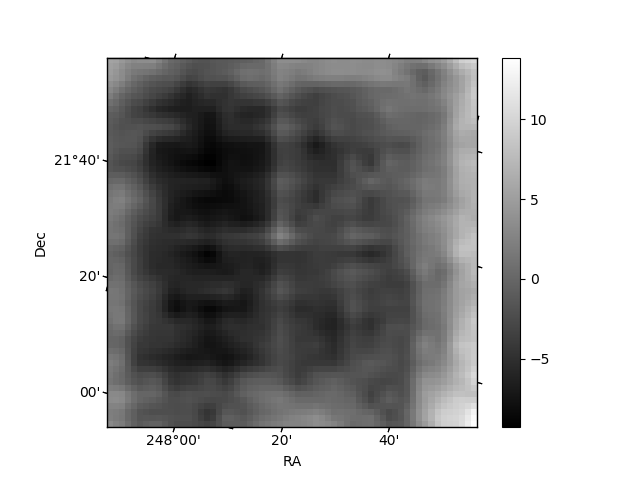
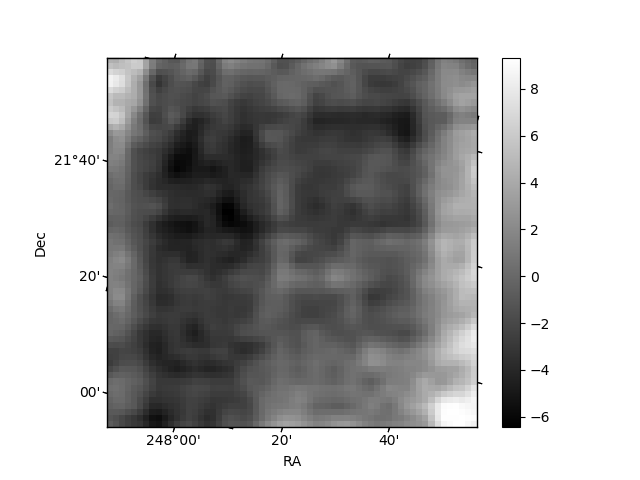
Histogram calculated using DETX and DETY for each event in the final _common_clean file
| Quadrant A | 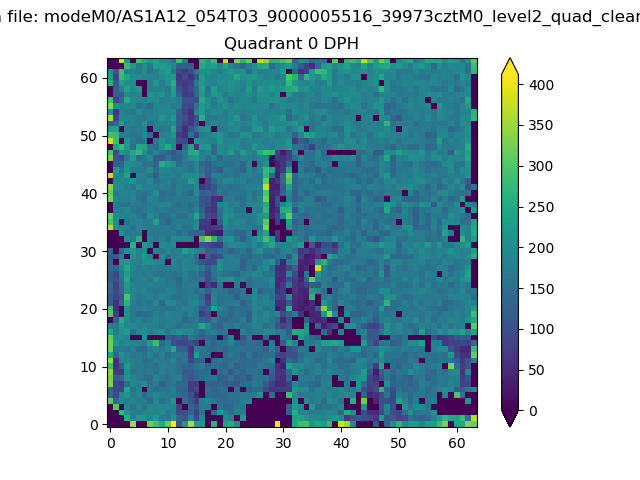 |
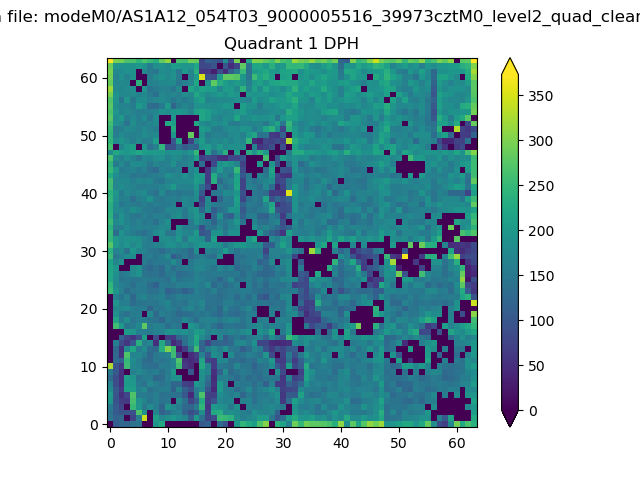 |
Quadrant B |
|---|---|---|---|
| Quadrant D | 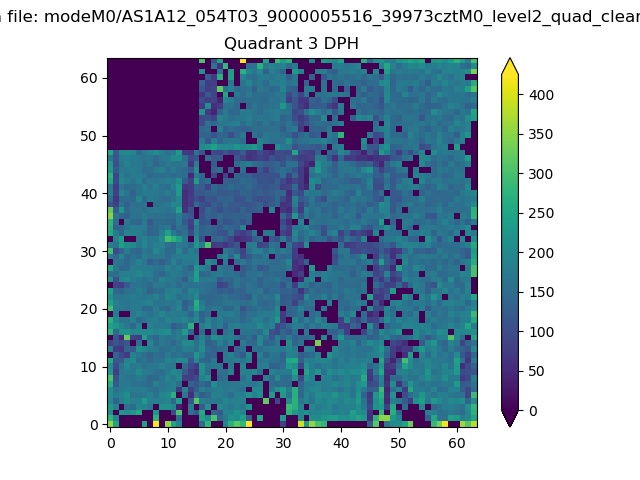 |
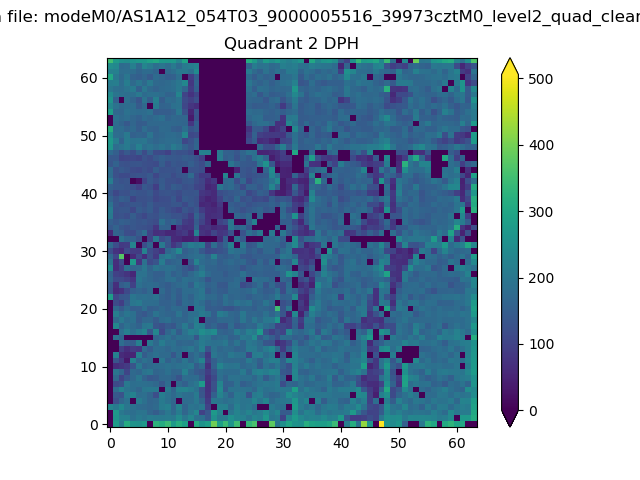 |
Quadrant C |
| Plot type | Count rate plots | Images |
|---|---|---|
| Comparison with Poisson distribution Blue bars denote a histogram of data divided into 1 sec bins. Red curve is a Poisson curve with rate = median count rate of data. |
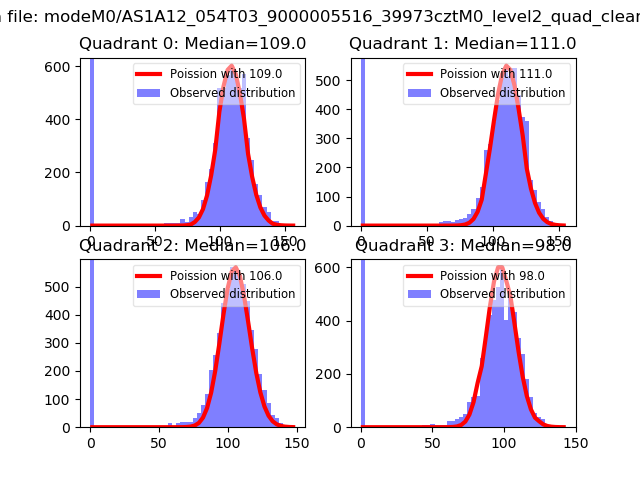 |
 |
| Quadrant-wise count rates Data is divided into 100 sec bins |
 |
|
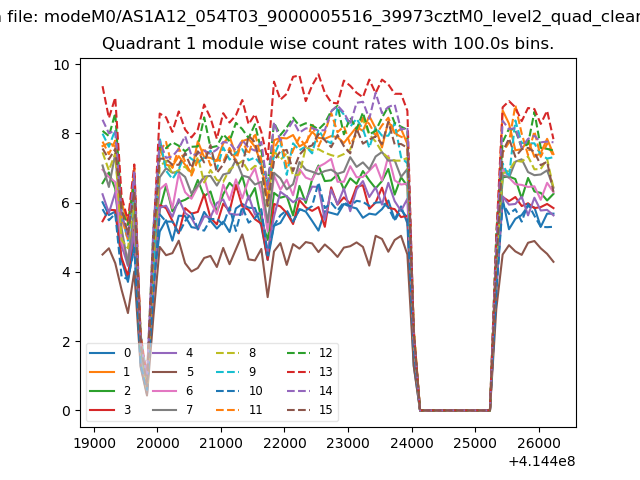
| Module-wise count rates for Quadrant A Data is divided into 100 sec bins |
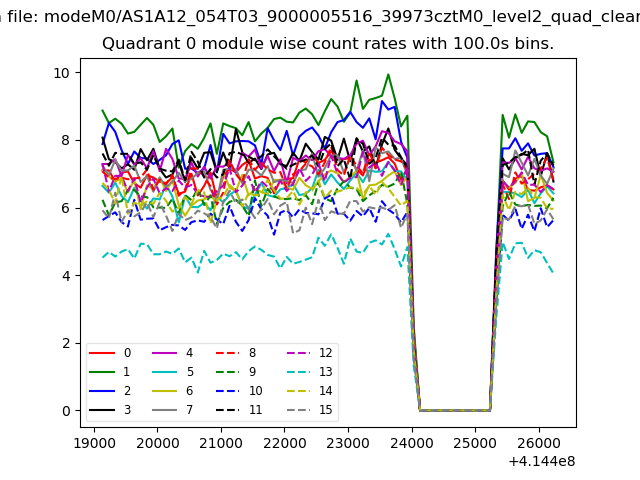 |
 |
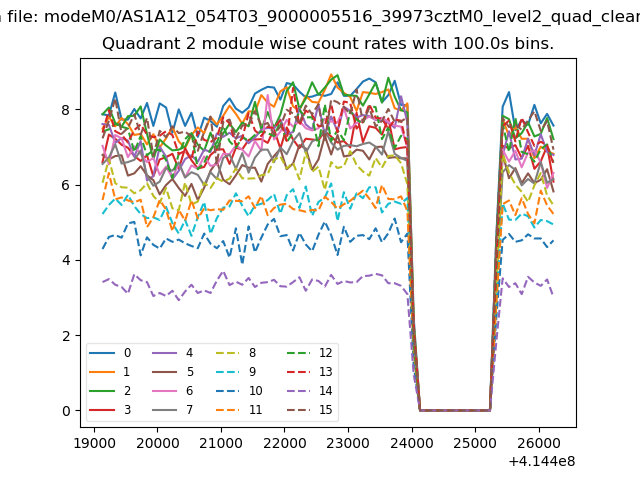
| Module-wise count rates for Quadrant B Data is divided into 100 sec bins |
 |
 |
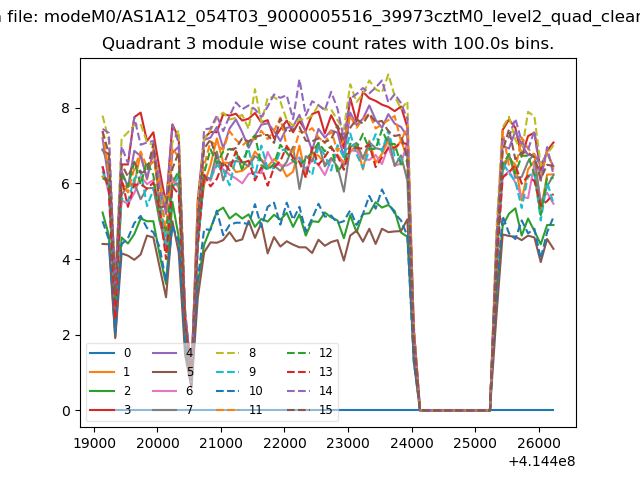
| Module-wise count rates for Quadrant C Data is divided into 100 sec bins |
 |
 |
| Module-wise count rates for Quadrant D Data is divided into 100 sec bins |
 |
 |
| Parameter | Plot |
|---|---|
| CZT HV Monitor |  |
| D_VDD | 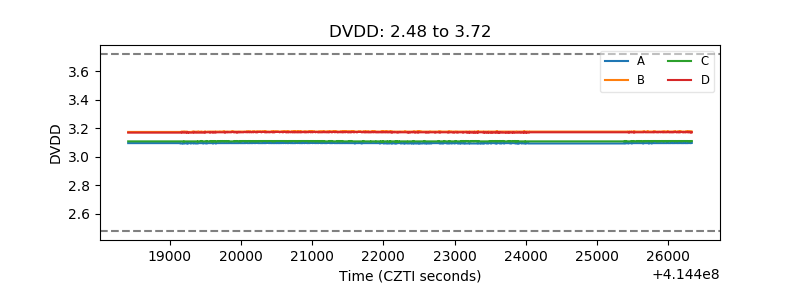 |
| Temperature 1 | 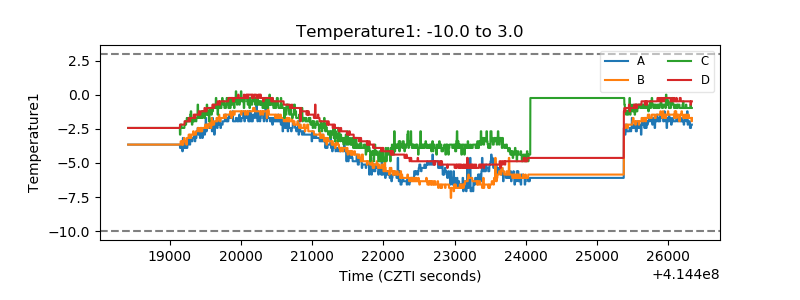 |
| Veto HV Monitor | 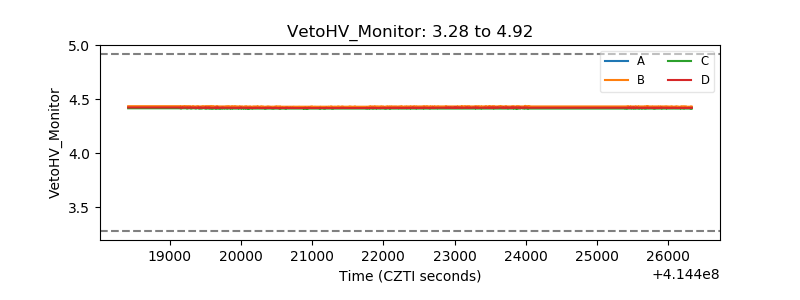 |
| Veto LLD | 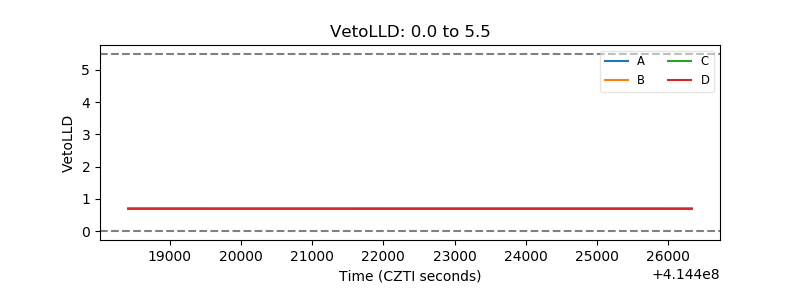 |
| Alpha Counter | 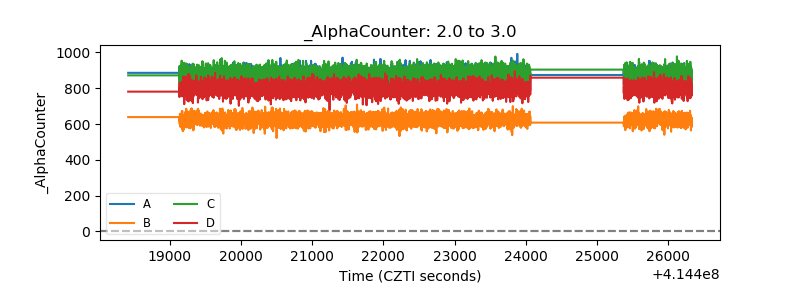 |
| _CPM_Rate |  |
| CZT Counter | 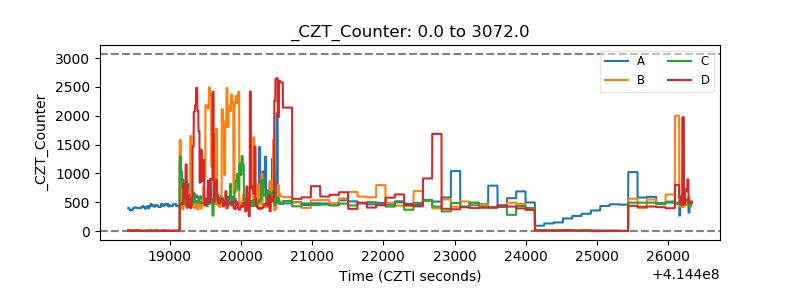 |
| +2.5 Volts monitor | 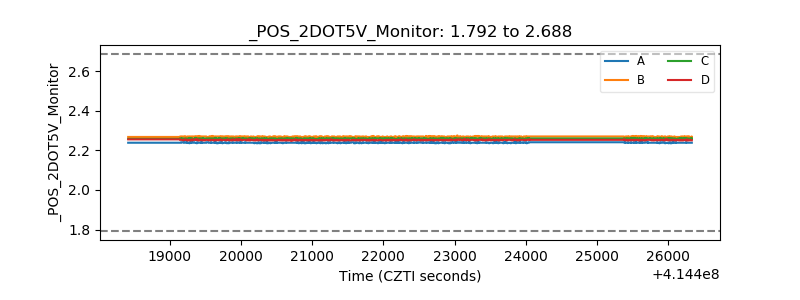 |
| +5 Volts monitor | 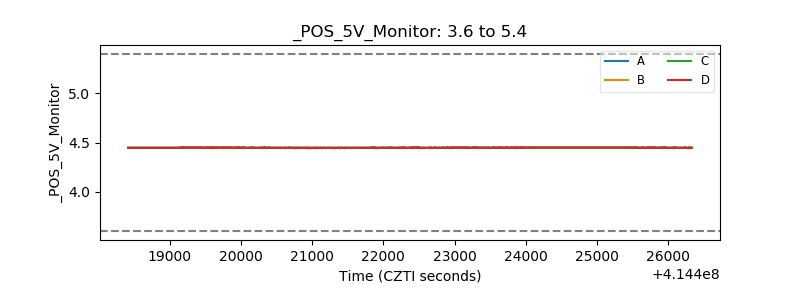 |
| _ROLL_ROT | 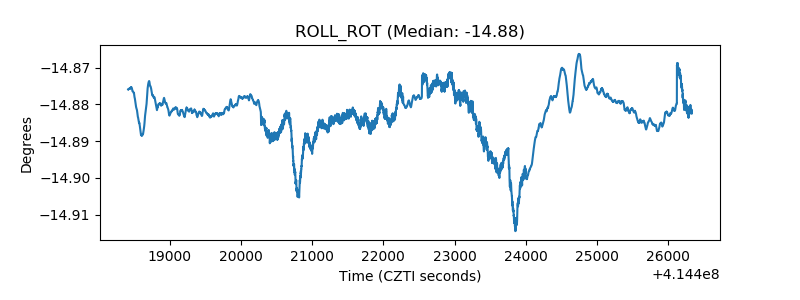 |
| _Roll_DEC | 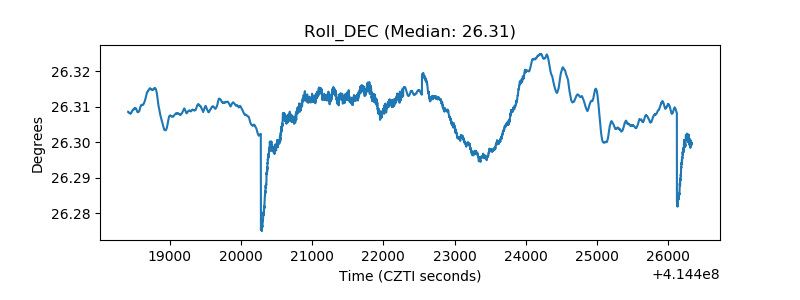 |
| _Roll_RA | 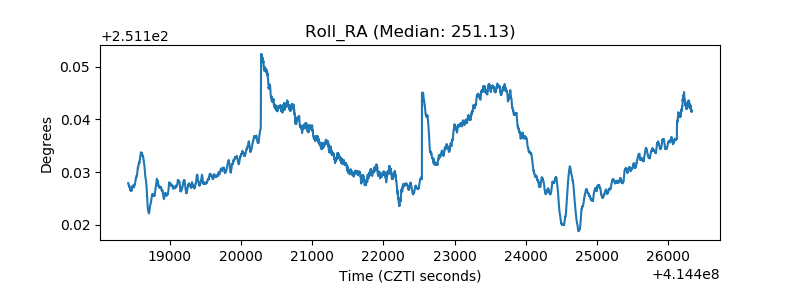 |
| Veto Counter | 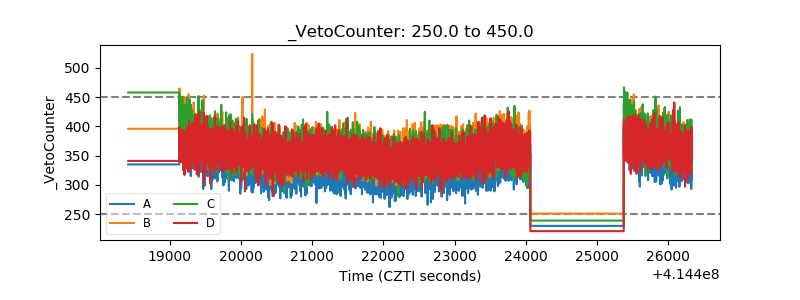 |