| Param | Original file | Final file |
|---|---|---|
| Filename | modeM0/AS1A12_054T03_9000005516_39974cztM0_level2.fits | modeM0/AS1A12_054T03_9000005516_39974cztM0_level2_quad_clean.evt |
| Size (bytes) | 384,560,640 | 95,434,560 |
| Size | 366.7 MB | 91.0 MB |
| Events in quadrant A | 3,229,230 | 642,931 |
| Events in quadrant B | 3,299,617 | 652,341 |
| Events in quadrant C | 3,004,901 | 629,981 |
| Events in quadrant D | 4,236,937 | 547,372 |
| Mode M9 | |||
|---|---|---|---|
| Quadrant | BADHDUFLAG | Total packets | Discarded packets |
| A | 0 | 15 | 0 |
| B | 0 | 15 | 0 |
| C | 0 | 15 | 0 |
| D | 0 | 16 | 0 |
| Mode SS | |||
|---|---|---|---|
| Quadrant | BADHDUFLAG | Total packets | Discarded packets |
| A | 0 | 122 | 0 |
| B | 0 | 122 | 0 |
| C | 0 | 122 | 0 |
| D | 0 | 122 | 0 |
| Mode M0 | |||
|---|---|---|---|
| Quadrant | BADHDUFLAG | Total packets | Discarded packets |
| A | 0 | 13126 | 3 |
| B | 0 | 13825 | 2 |
| C | 0 | 12577 | 2 |
| D | 0 | 16796 | 2 |
| Quadrant | Total seconds | Saturated seconds | Saturation percentage |
|---|---|---|---|
| A | 5968 | 34 | 0.569705% |
| B | 5968 | 122 | 2.044236% |
| C | 5968 | 19 | 0.318365% |
| D | 5968 | 453 | 7.590483% |
Noise dominated data is calculated using 1-second bins in cleaned event files. If a bin has >2000 counts, and if more than 50% of those come from <1% of pixels, then it is considered to be noise-dominated and hence unusable.
| Quadrant | # 1 sec bins | Bins with >0 counts | Bins with >2000 counts | High rate bins dominated by noise | Noise dominated (total time) | Noise dominated (detector-on time) | Marked lightcurve |
|---|---|---|---|---|---|---|---|
| A | 7250 | 5968 | 18 | 18 | 0.25% | 0.30% | 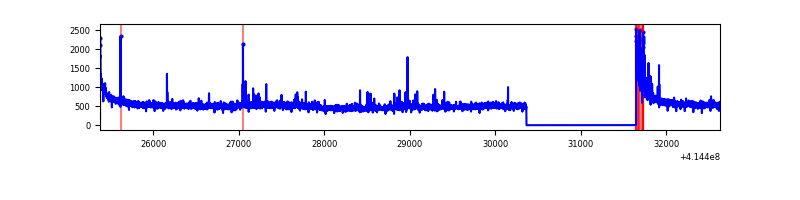 |
| B | 7250 | 5967 | 85 | 85 | 1.17% | 1.42% | 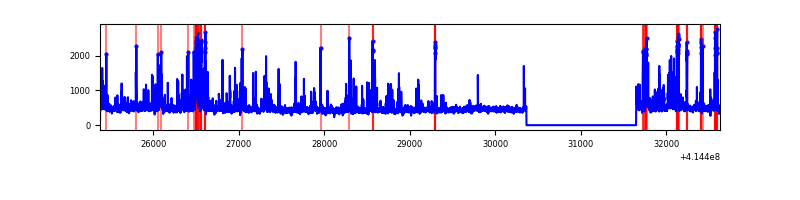 |
| C | 7250 | 5967 | 15 | 15 | 0.21% | 0.25% | 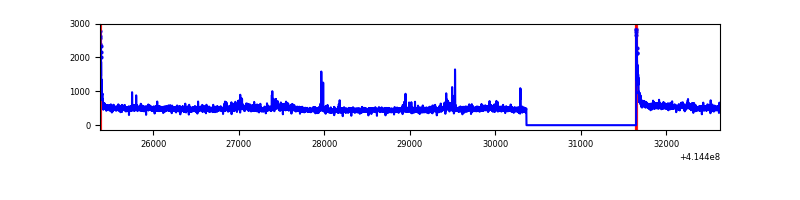 |
| D | 7250 | 5967 | 407 | 407 | 5.61% | 6.82% | 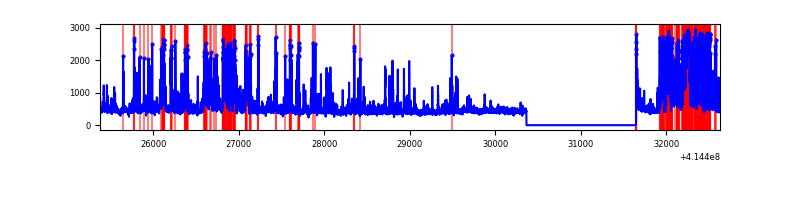 |
Top three noisy pixels from each quadrant. If the there are fewer than three noisy pixels in the level2.evt file, extra rows are filled as -1
| Pixel properties | Quadrant properties | ||||||
|---|---|---|---|---|---|---|---|
| Quadrant | DetID | PixID | Counts | Sigma | Mean | Median | Sigma |
| A | 10 | 83 | 514346 | 3792.46 | 657 | 645 | 135.5 |
| A | 6 | 10 | 84464 | 618.8 | 657 | 645 | 135.5 |
| A | 13 | 248 | 71353 | 522.01 | 657 | 645 | 135.5 |
| B | 4 | 171 | 527165 | 4176.43 | 650 | 633 | 126.1 |
| B | 5 | 255 | 93556 | 737.06 | 650 | 633 | 126.1 |
| B | 0 | 230 | 51847 | 406.23 | 650 | 633 | 126.1 |
| C | 15 | 214 | 250271 | 1647.01 | 642 | 646 | 151.6 |
| C | 3 | 233 | 142624 | 936.76 | 642 | 646 | 151.6 |
| C | 0 | 10 | 75615 | 494.64 | 642 | 646 | 151.6 |
| D | 12 | 227 | 792733 | 5159.86 | 620 | 602 | 153.5 |
| D | 2 | 250 | 609309 | 3965.06 | 620 | 602 | 153.5 |
| D | 1 | 47 | 199894 | 1298.17 | 620 | 602 | 153.5 |
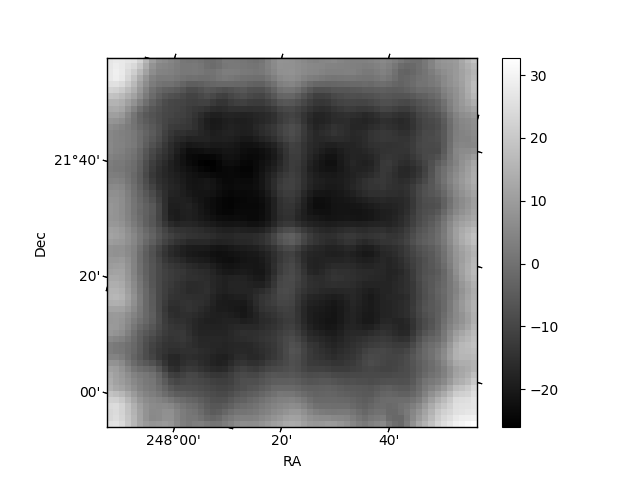
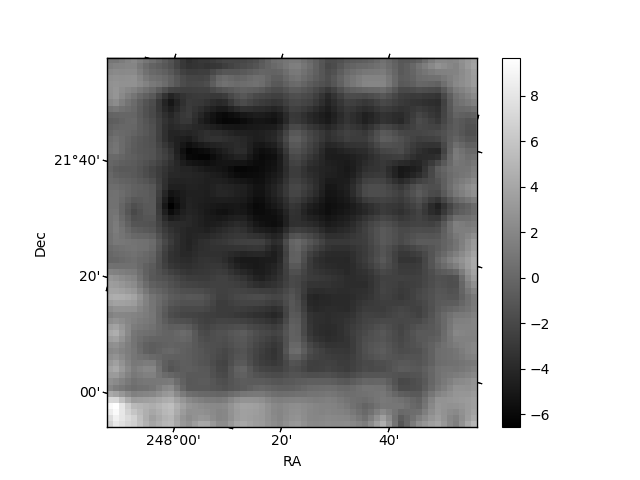
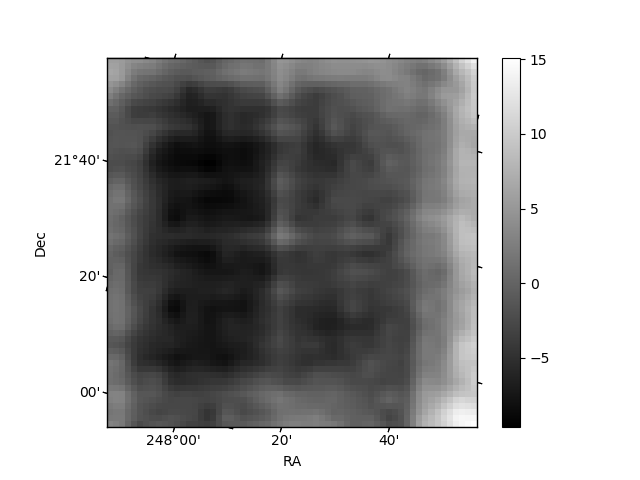
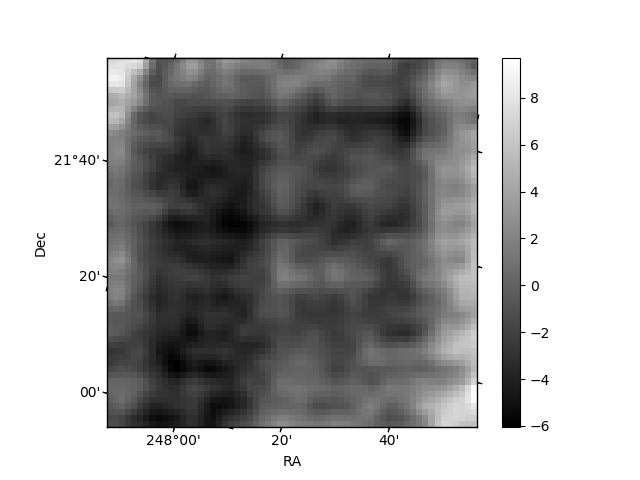
Histogram calculated using DETX and DETY for each event in the final _common_clean file
| Quadrant A | 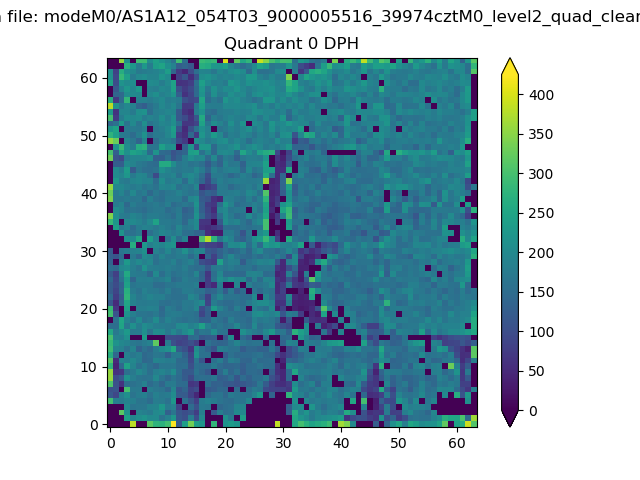 |
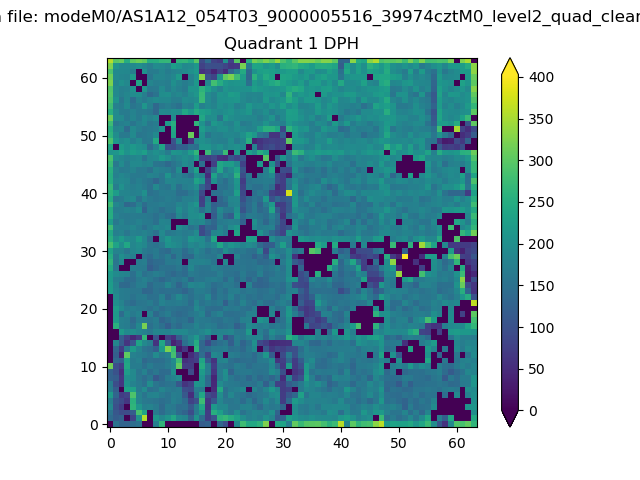 |
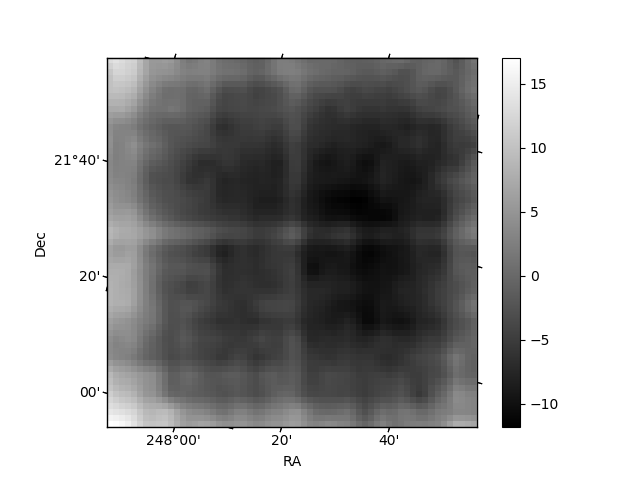
Quadrant B |
|---|---|---|---|
| Quadrant D | 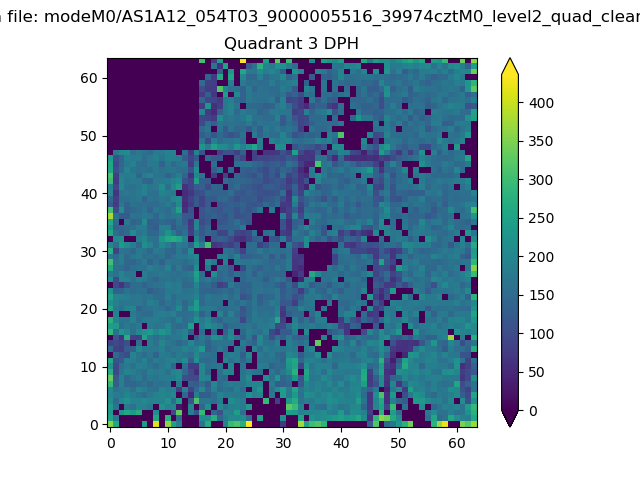 |
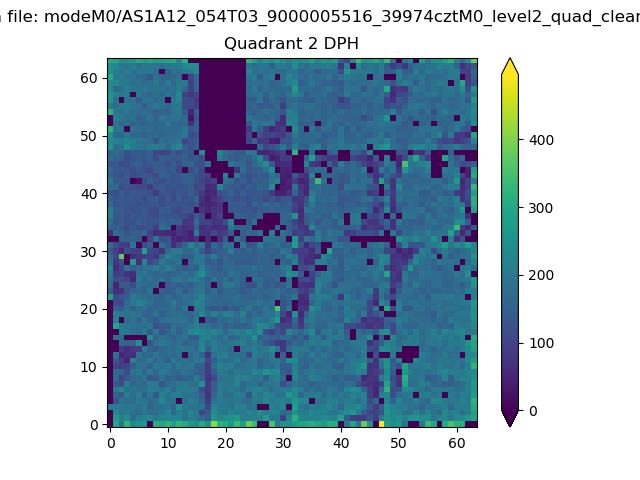 |
Quadrant C |
| Plot type | Count rate plots | Images |
|---|---|---|
| Comparison with Poisson distribution Blue bars denote a histogram of data divided into 1 sec bins. Red curve is a Poisson curve with rate = median count rate of data. |
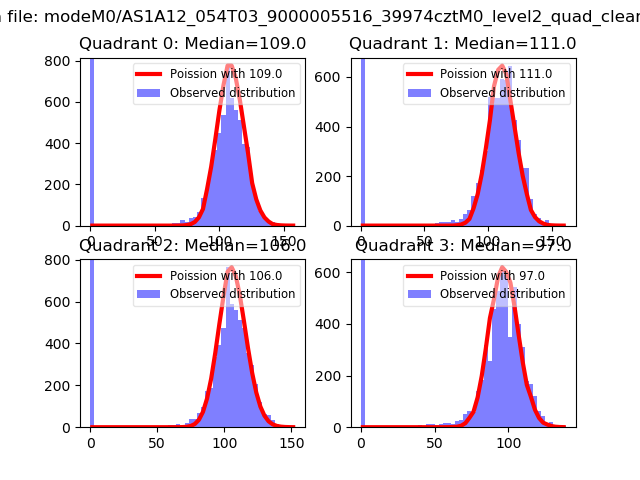 |
 |
| Quadrant-wise count rates Data is divided into 100 sec bins |
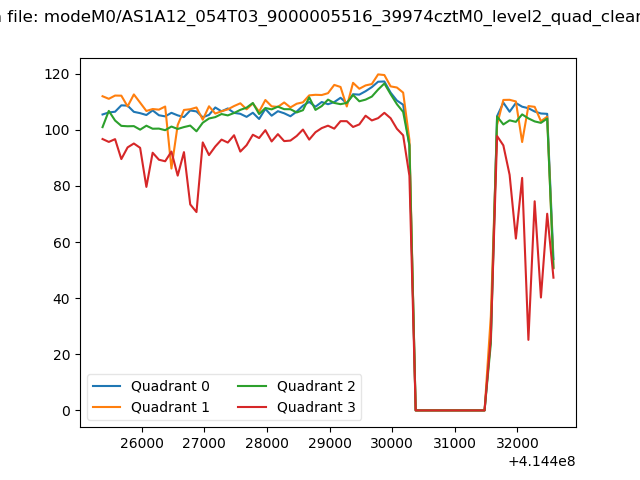 |
|
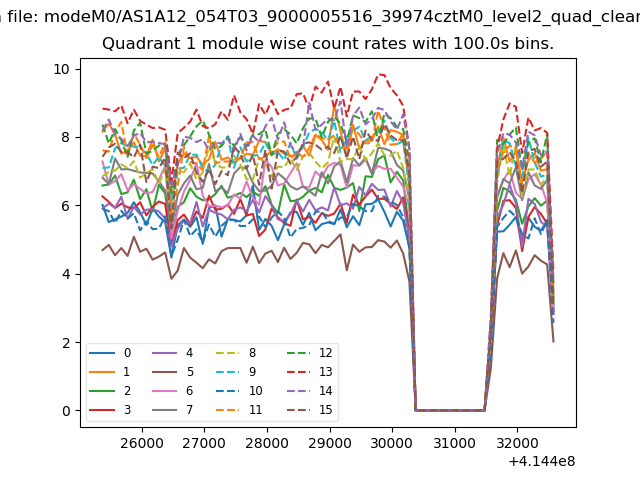
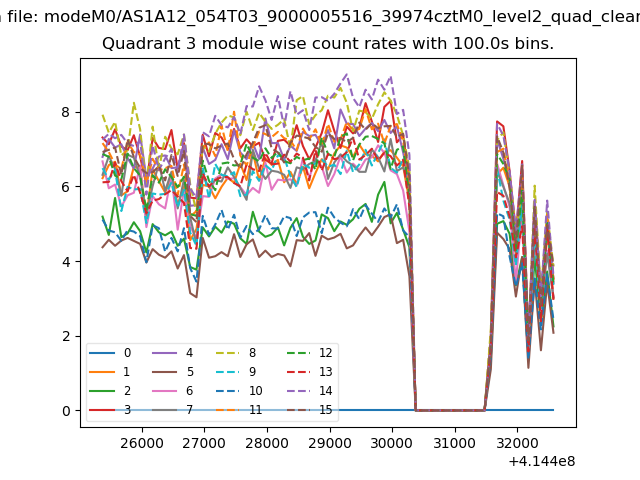
| Module-wise count rates for Quadrant A Data is divided into 100 sec bins |
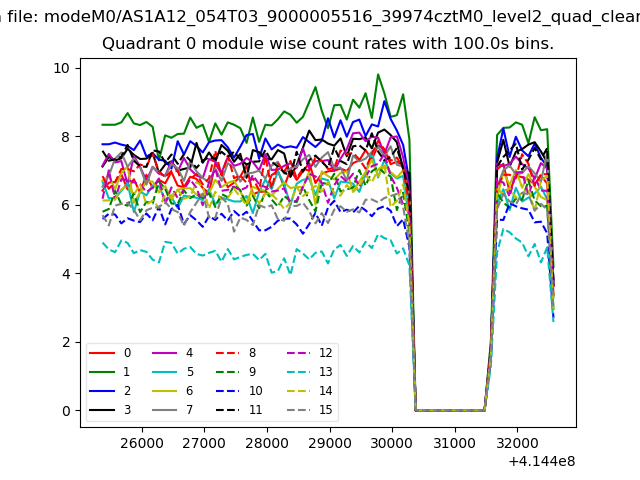 |
 |
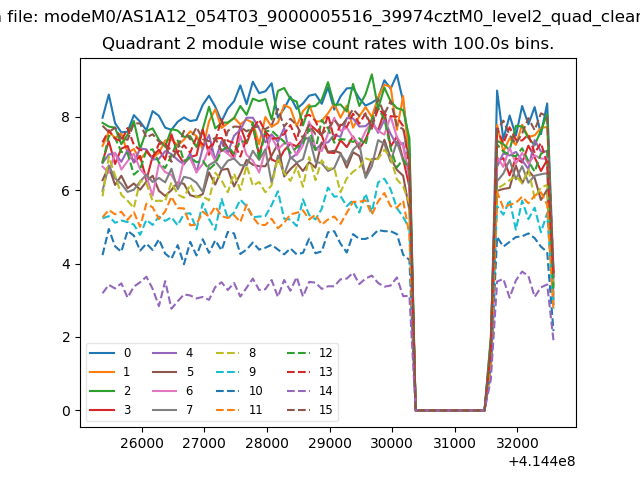
| Module-wise count rates for Quadrant B Data is divided into 100 sec bins |
 |
 |
| Module-wise count rates for Quadrant C Data is divided into 100 sec bins |
 |
 |
| Module-wise count rates for Quadrant D Data is divided into 100 sec bins |
 |
 |
| Parameter | Plot |
|---|---|
| CZT HV Monitor | 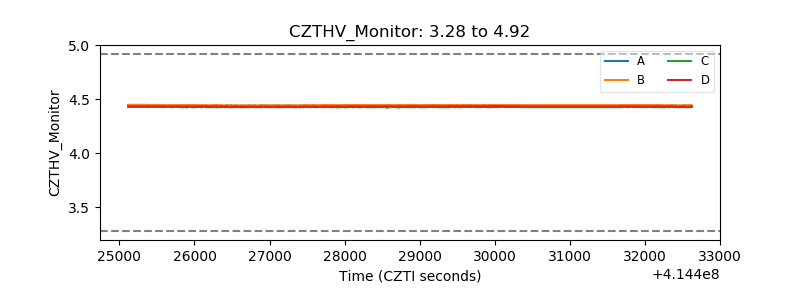 |
| D_VDD | 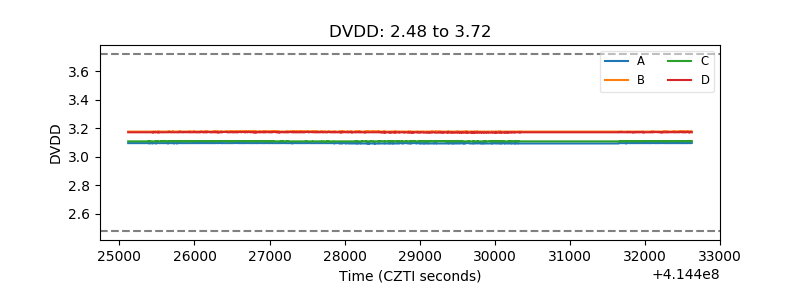 |
| Temperature 1 | 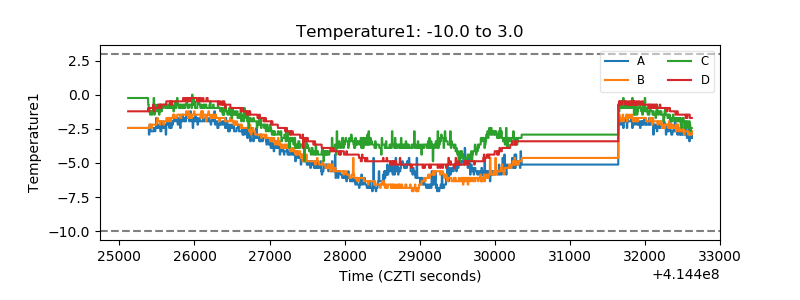 |
| Veto HV Monitor | 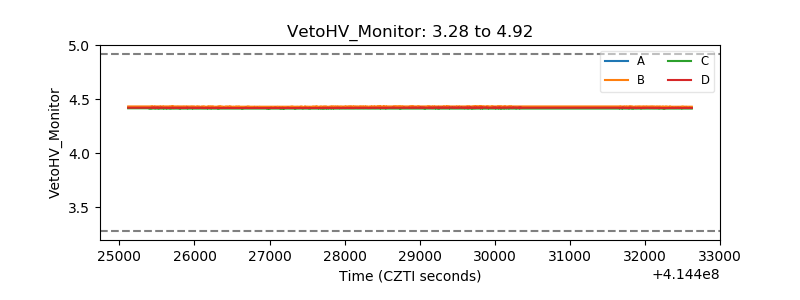 |
| Veto LLD | 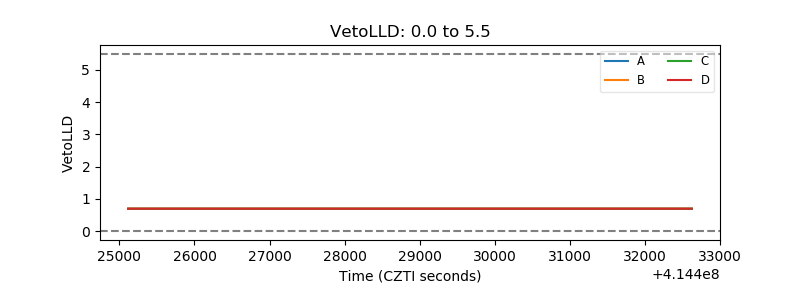 |
| Alpha Counter | 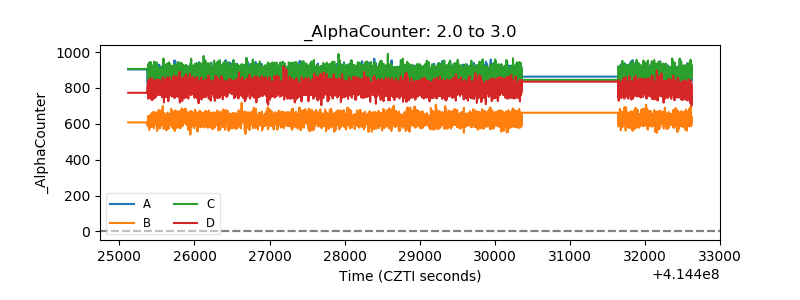 |
| _CPM_Rate | 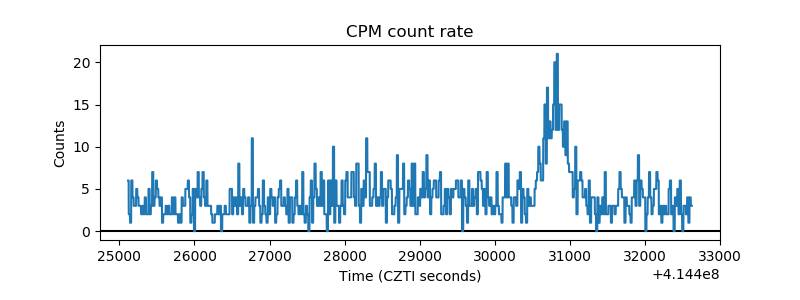 |
| CZT Counter | 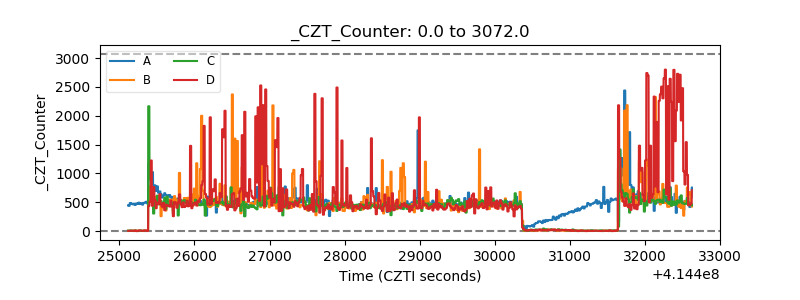 |
| +2.5 Volts monitor |  |
| +5 Volts monitor | 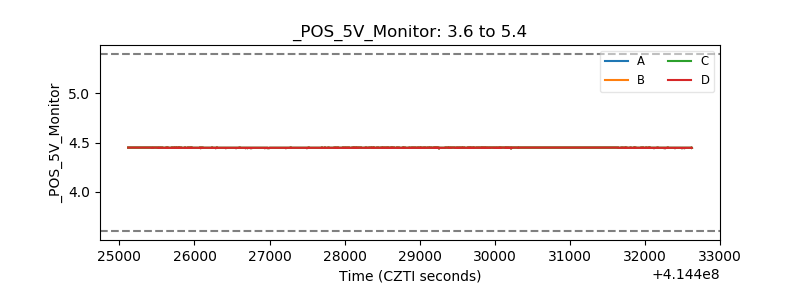 |
| _ROLL_ROT | 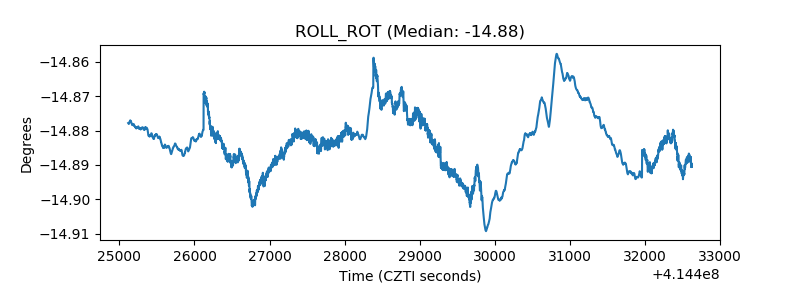 |
| _Roll_DEC | 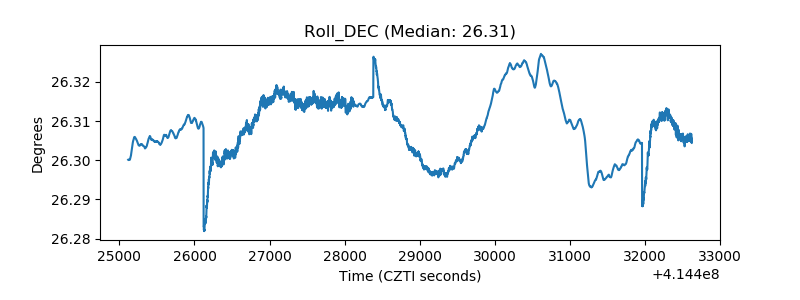 |
| _Roll_RA | 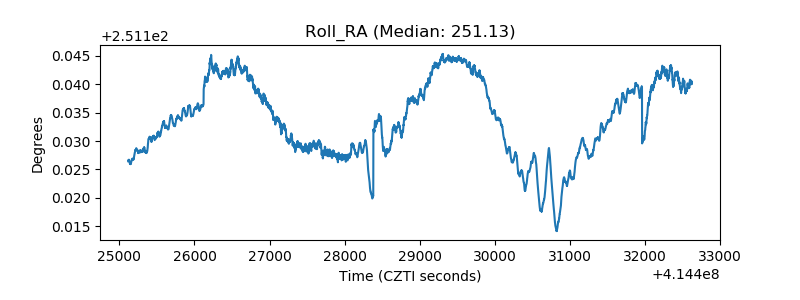 |
| Veto Counter | 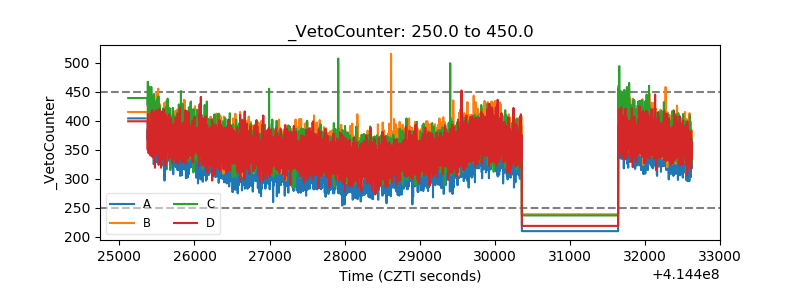 |