| Param | Original file | Final file |
|---|---|---|
| Filename | modeM0/AS1A12_054T03_9000005516_39976cztM0_level2.fits | modeM0/AS1A12_054T03_9000005516_39976cztM0_level2_quad_clean.evt |
| Size (bytes) | 684,979,200 | 171,031,680 |
| Size | 653.2 MB | 163.1 MB |
| Events in quadrant A | 5,734,088 | 1,148,200 |
| Events in quadrant B | 5,556,440 | 1,168,887 |
| Events in quadrant C | 5,348,632 | 1,144,721 |
| Events in quadrant D | 7,887,003 | 976,023 |
| Mode M9 | |||
|---|---|---|---|
| Quadrant | BADHDUFLAG | Total packets | Discarded packets |
| A | 0 | 34 | 0 |
| B | 0 | 34 | 0 |
| C | 0 | 34 | 0 |
| D | 0 | 35 | 0 |
| Mode SS | |||
|---|---|---|---|
| Quadrant | BADHDUFLAG | Total packets | Discarded packets |
| A | 0 | 218 | 0 |
| B | 0 | 218 | 0 |
| C | 0 | 218 | 0 |
| D | 0 | 218 | 0 |
| Mode M0 | |||
|---|---|---|---|
| Quadrant | BADHDUFLAG | Total packets | Discarded packets |
| A | 0 | 23625 | 3 |
| B | 0 | 23861 | 2 |
| C | 0 | 22644 | 2 |
| D | 0 | 30942 | 2 |
| Quadrant | Total seconds | Saturated seconds | Saturation percentage |
|---|---|---|---|
| A | 10694 | 56 | 0.523658% |
| B | 10694 | 148 | 1.383954% |
| C | 10694 | 61 | 0.570413% |
| D | 10694 | 846 | 7.910978% |
Noise dominated data is calculated using 1-second bins in cleaned event files. If a bin has >2000 counts, and if more than 50% of those come from <1% of pixels, then it is considered to be noise-dominated and hence unusable.
| Quadrant | # 1 sec bins | Bins with >0 counts | Bins with >2000 counts | High rate bins dominated by noise | Noise dominated (total time) | Noise dominated (detector-on time) | Marked lightcurve |
|---|---|---|---|---|---|---|---|
| A | 13500 | 10696 | 40 | 40 | 0.30% | 0.37% | 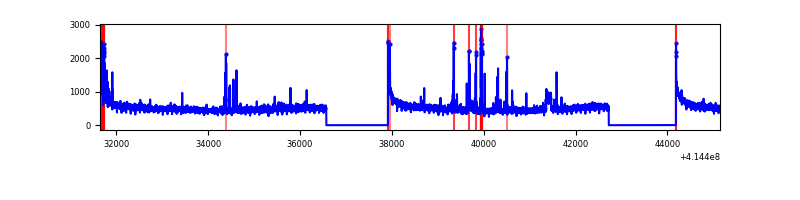 |
| B | 13499 | 10693 | 95 | 95 | 0.70% | 0.89% | 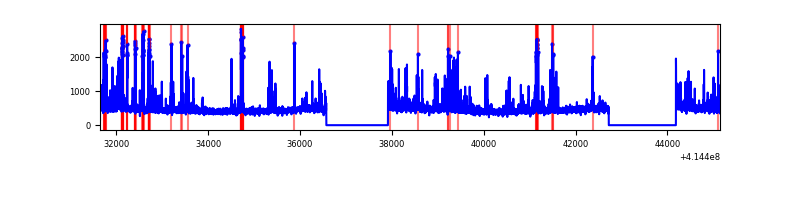 |
| C | 13499 | 10693 | 56 | 56 | 0.41% | 0.52% | 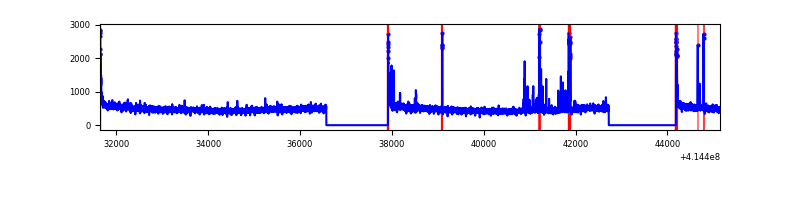 |
| D | 13499 | 10693 | 808 | 808 | 5.99% | 7.56% | 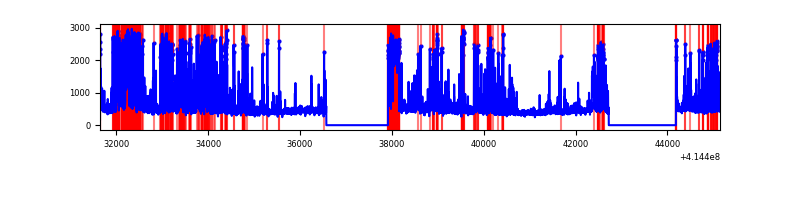 |
Top three noisy pixels from each quadrant. If the there are fewer than three noisy pixels in the level2.evt file, extra rows are filled as -1
| Pixel properties | Quadrant properties | ||||||
|---|---|---|---|---|---|---|---|
| Quadrant | DetID | PixID | Counts | Sigma | Mean | Median | Sigma |
| A | 10 | 83 | 857820 | 3596.94 | 1172 | 1149 | 238.2 |
| A | 13 | 248 | 191992 | 801.3 | 1172 | 1149 | 238.2 |
| A | 6 | 10 | 99252 | 411.91 | 1172 | 1149 | 238.2 |
| B | 4 | 171 | 626283 | 2765.14 | 1165 | 1132 | 226.1 |
| B | 5 | 255 | 144400 | 633.7 | 1165 | 1132 | 226.1 |
| B | 0 | 230 | 59363 | 257.56 | 1165 | 1132 | 226.1 |
| C | 15 | 214 | 438682 | 1633.09 | 1149 | 1157 | 267.9 |
| C | 0 | 10 | 130449 | 482.59 | 1149 | 1157 | 267.9 |
| C | 3 | 233 | 118942 | 439.64 | 1149 | 1157 | 267.9 |
| D | 2 | 250 | 1228665 | 4554.29 | 1099 | 1069 | 269.5 |
| D | 12 | 227 | 1183022 | 4384.96 | 1099 | 1069 | 269.5 |
| D | 2 | 249 | 309526 | 1144.35 | 1099 | 1069 | 269.5 |
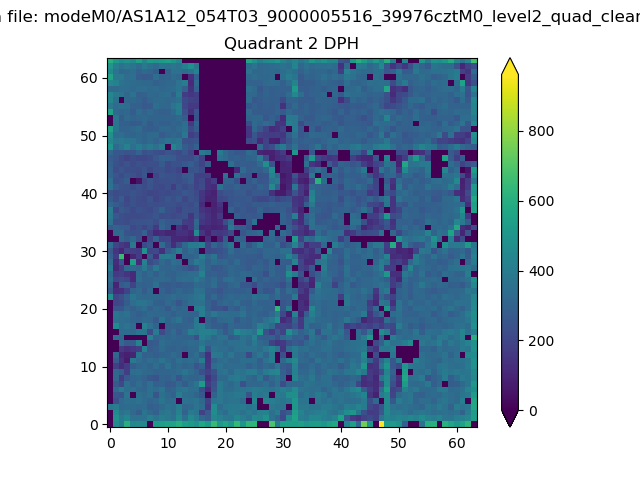
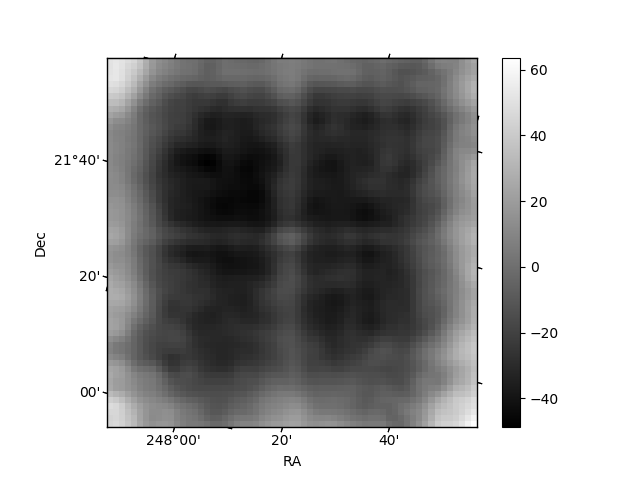
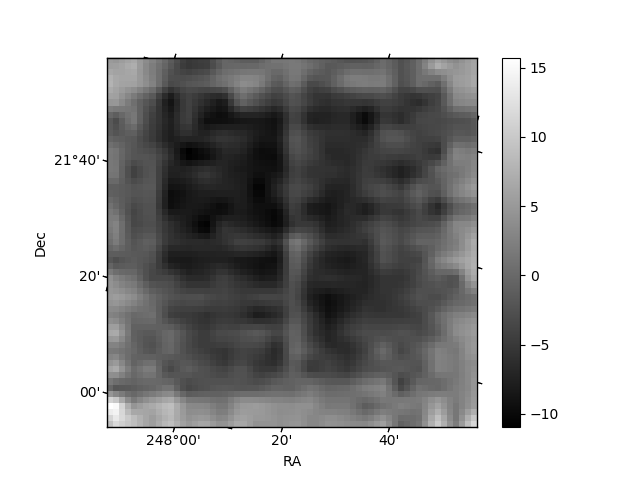
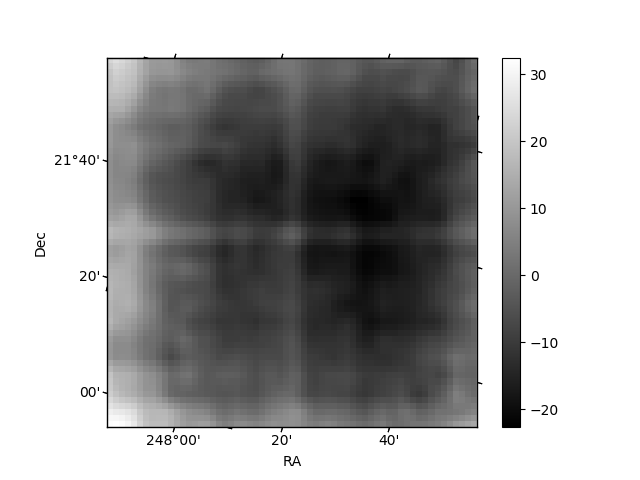
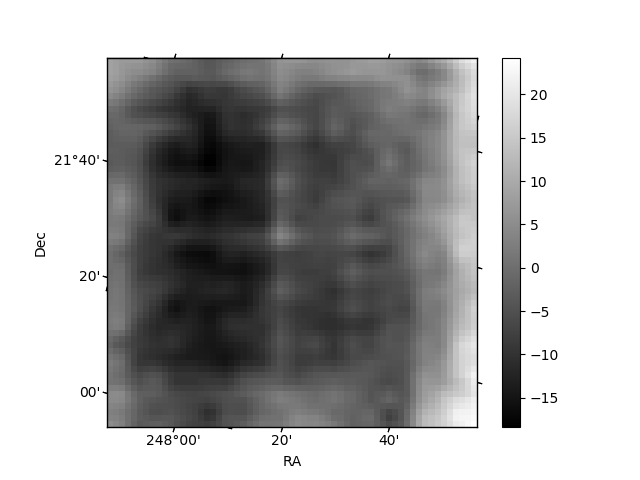
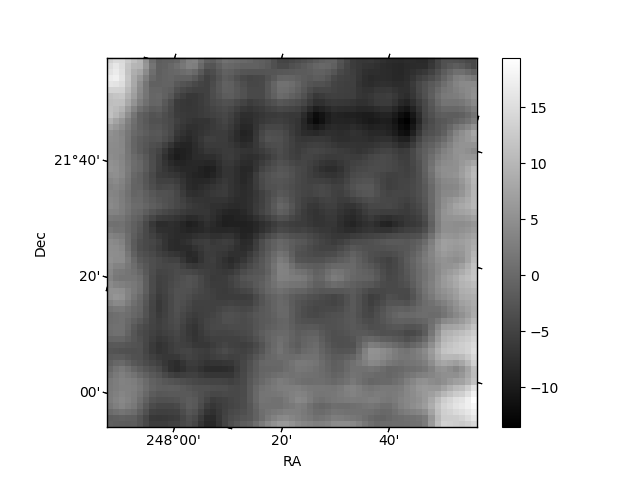
Histogram calculated using DETX and DETY for each event in the final _common_clean file
| Quadrant A | 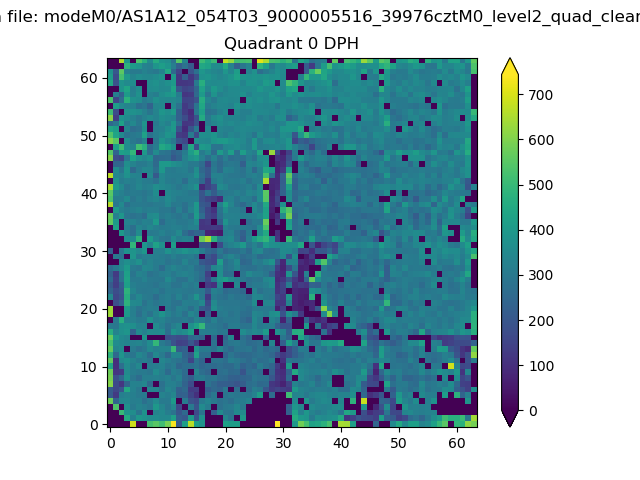 |
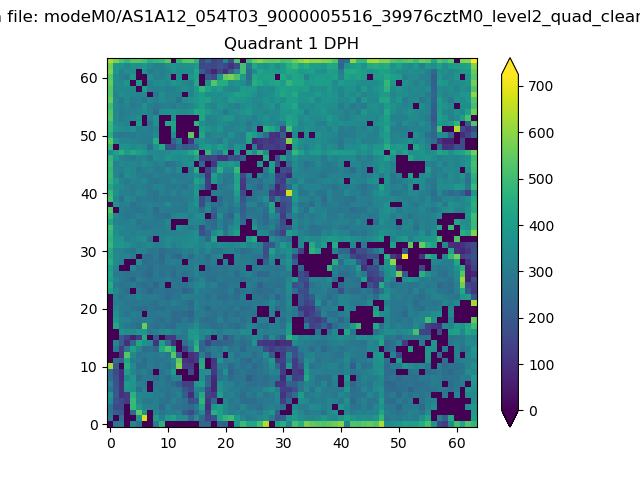 |
Quadrant B |
|---|---|---|---|
| Quadrant D | 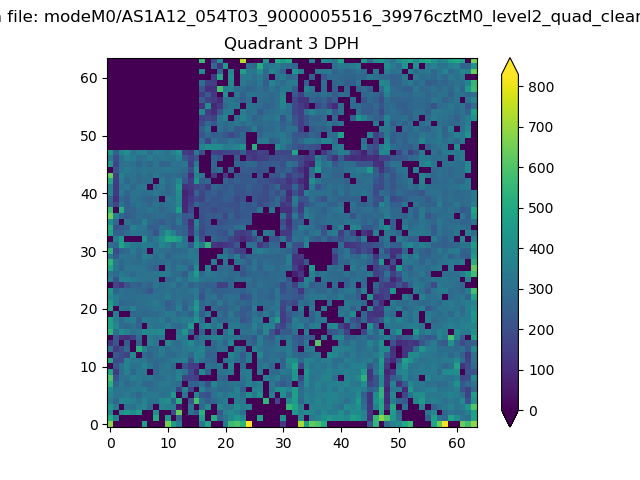 |
 |
Quadrant C |
| Plot type | Count rate plots | Images |
|---|---|---|
| Comparison with Poisson distribution Blue bars denote a histogram of data divided into 1 sec bins. Red curve is a Poisson curve with rate = median count rate of data. |
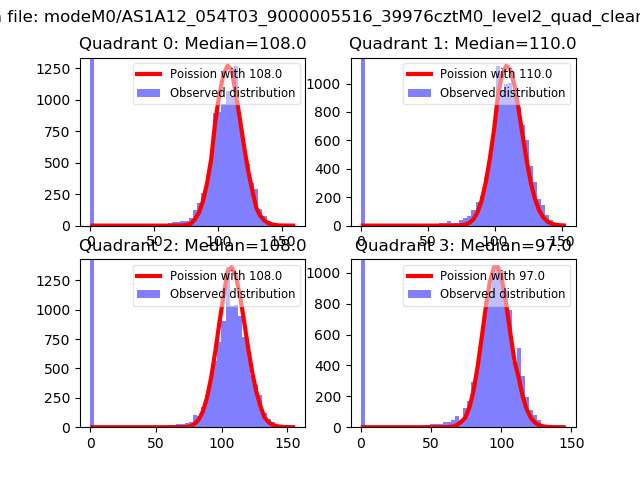 |
 |
| Quadrant-wise count rates Data is divided into 100 sec bins |
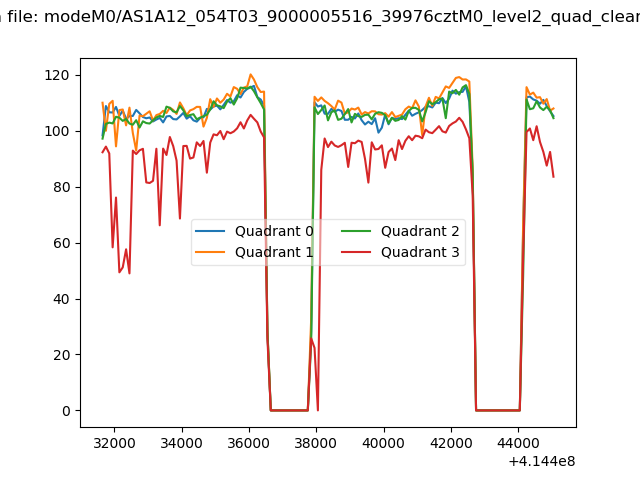 |
|
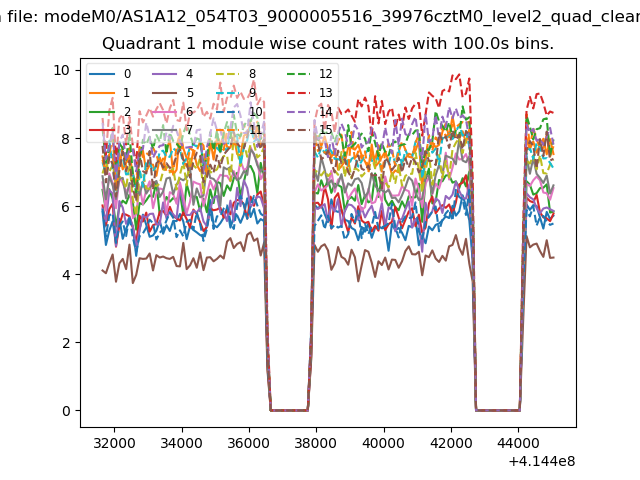
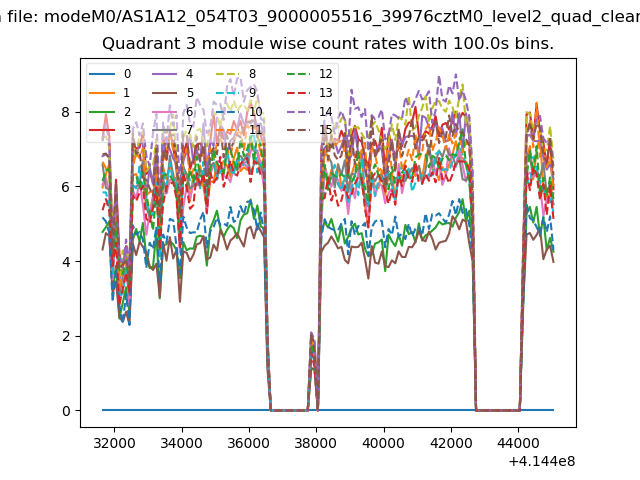
| Module-wise count rates for Quadrant A Data is divided into 100 sec bins |
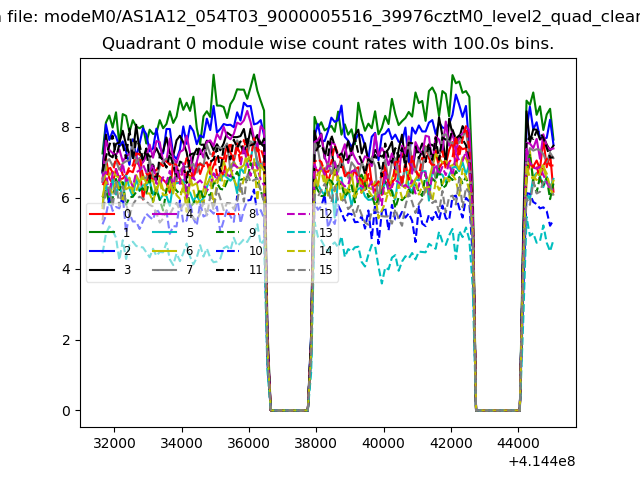 |
 |
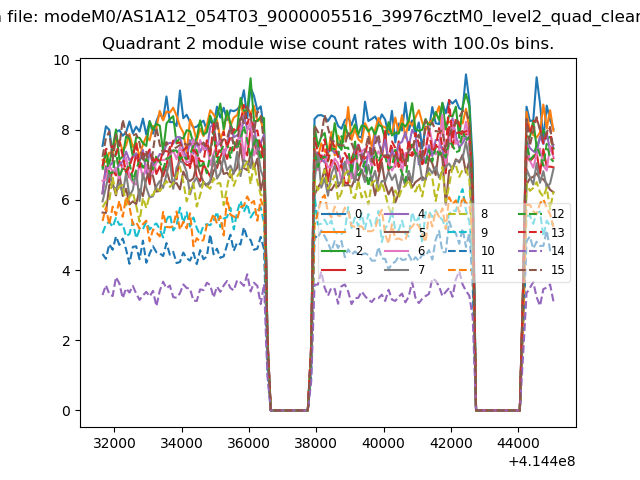
| Module-wise count rates for Quadrant B Data is divided into 100 sec bins |
 |
 |
| Module-wise count rates for Quadrant C Data is divided into 100 sec bins |
 |
 |
| Module-wise count rates for Quadrant D Data is divided into 100 sec bins |
 |
 |
| Parameter | Plot |
|---|---|
| CZT HV Monitor |  |
| D_VDD | 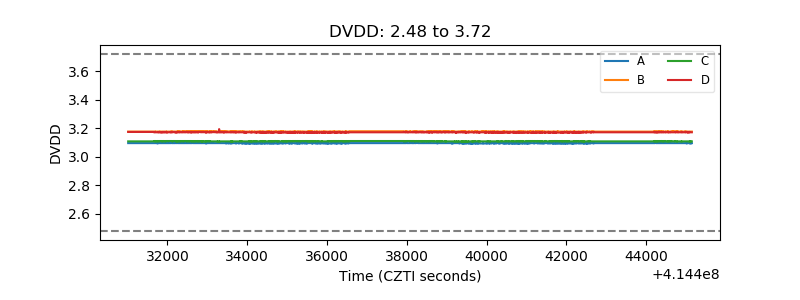 |
| Temperature 1 | 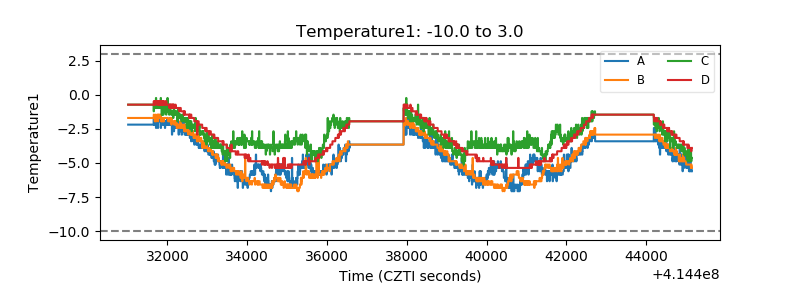 |
| Veto HV Monitor | 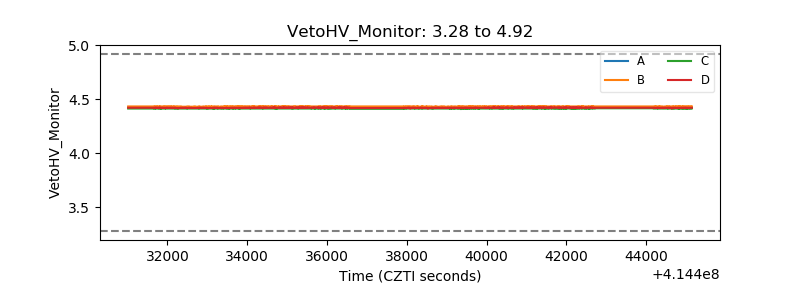 |
| Veto LLD | 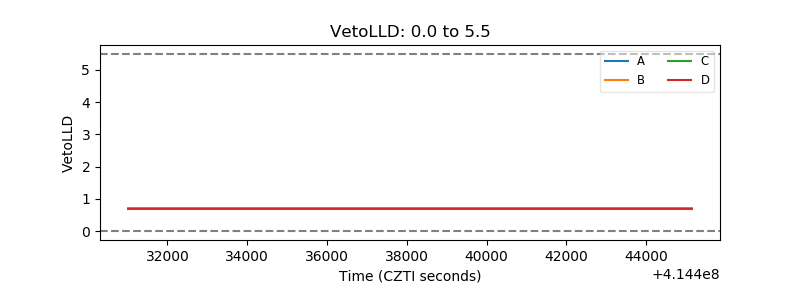 |
| Alpha Counter | 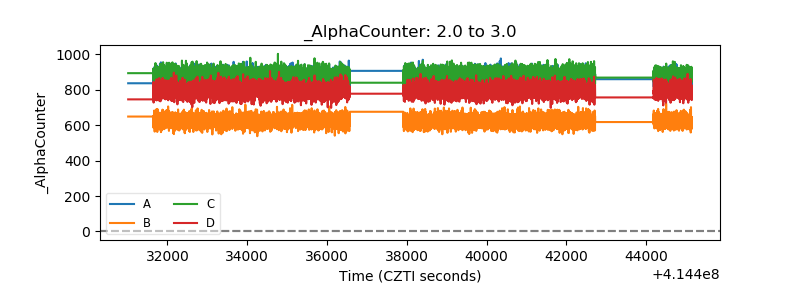 |
| _CPM_Rate | 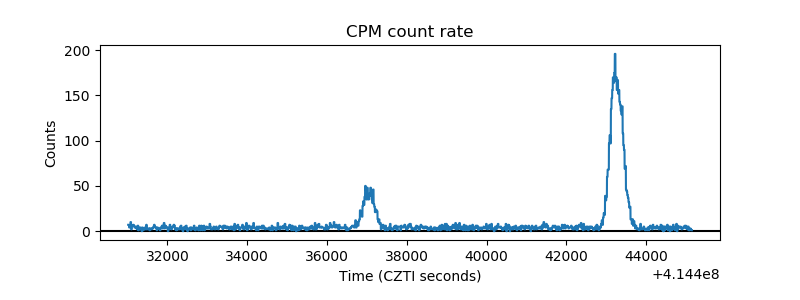 |
| CZT Counter | 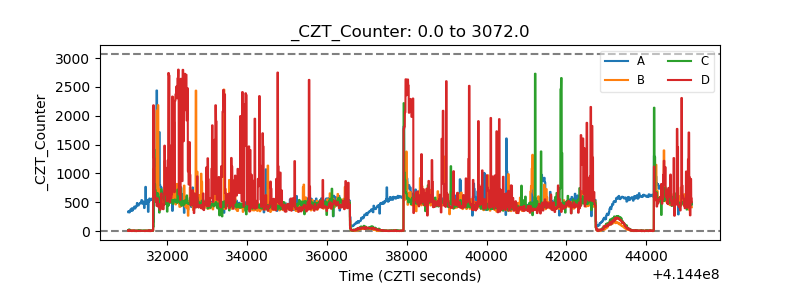 |
| +2.5 Volts monitor |  |
| +5 Volts monitor | 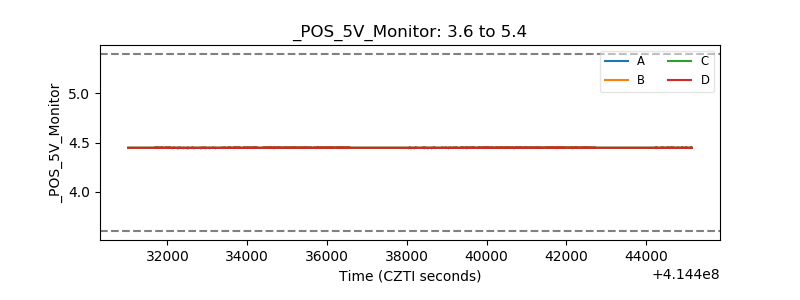 |
| _ROLL_ROT | 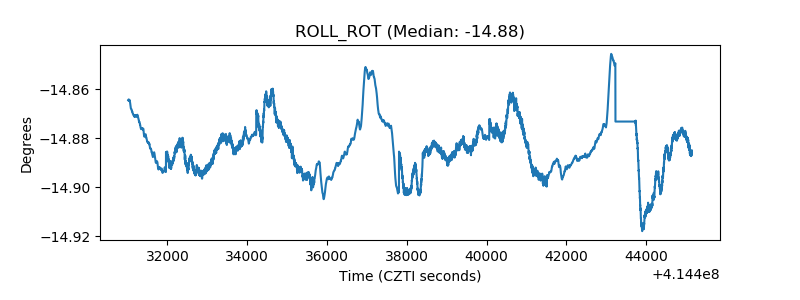 |
| _Roll_DEC | 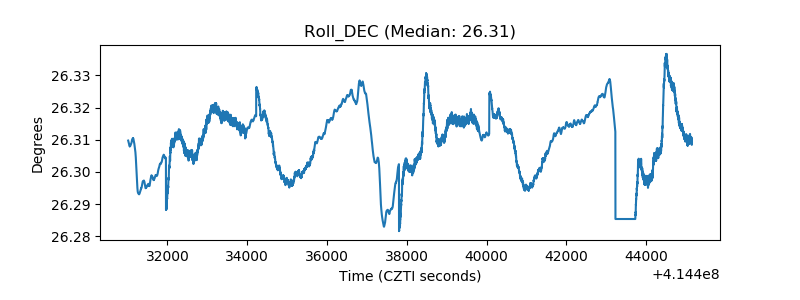 |
| _Roll_RA | 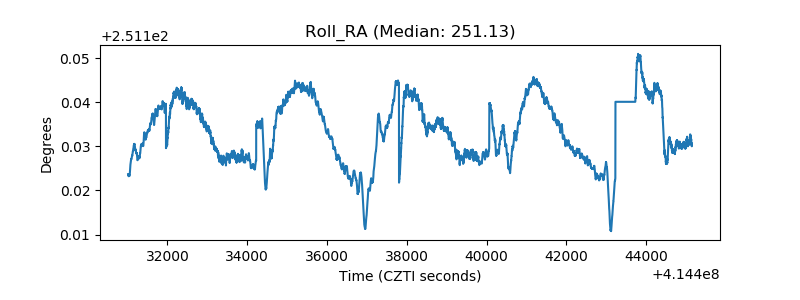 |
| Veto Counter | 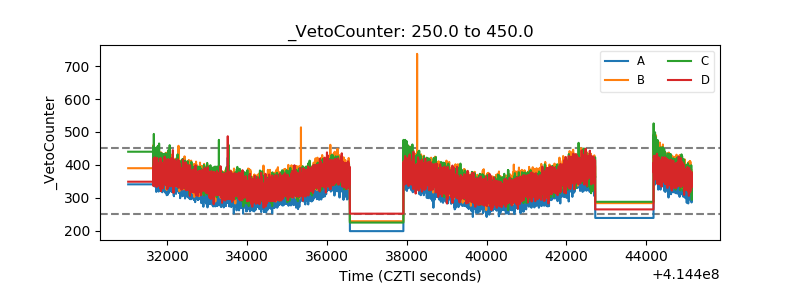 |