| Param | Original file | Final file |
|---|---|---|
| Filename | modeM0/AS1A12_054T03_9000005516_39977cztM0_level2.fits | modeM0/AS1A12_054T03_9000005516_39977cztM0_level2_quad_clean.evt |
| Size (bytes) | 352,641,600 | 94,893,120 |
| Size | 336.3 MB | 90.5 MB |
| Events in quadrant A | 3,011,602 | 633,516 |
| Events in quadrant B | 2,962,252 | 646,722 |
| Events in quadrant C | 2,884,781 | 623,764 |
| Events in quadrant D | 3,744,425 | 564,132 |
| Mode M9 | |||
|---|---|---|---|
| Quadrant | BADHDUFLAG | Total packets | Discarded packets |
| A | 0 | 30 | 0 |
| B | 0 | 30 | 0 |
| C | 0 | 30 | 0 |
| D | 0 | 30 | 0 |
| Mode SS | |||
|---|---|---|---|
| Quadrant | BADHDUFLAG | Total packets | Discarded packets |
| A | 0 | 122 | 0 |
| B | 0 | 122 | 0 |
| C | 0 | 122 | 0 |
| D | 0 | 122 | 0 |
| Mode M0 | |||
|---|---|---|---|
| Quadrant | BADHDUFLAG | Total packets | Discarded packets |
| A | 0 | 12673 | 3 |
| B | 0 | 12738 | 2 |
| C | 0 | 12205 | 2 |
| D | 0 | 15276 | 2 |
| Quadrant | Total seconds | Saturated seconds | Saturation percentage |
|---|---|---|---|
| A | 5786 | 16 | 0.276530% |
| B | 5786 | 66 | 1.140684% |
| C | 5786 | 49 | 0.846872% |
| D | 5786 | 242 | 4.182510% |
Noise dominated data is calculated using 1-second bins in cleaned event files. If a bin has >2000 counts, and if more than 50% of those come from <1% of pixels, then it is considered to be noise-dominated and hence unusable.
| Quadrant | # 1 sec bins | Bins with >0 counts | Bins with >2000 counts | High rate bins dominated by noise | Noise dominated (total time) | Noise dominated (detector-on time) | Marked lightcurve |
|---|---|---|---|---|---|---|---|
| A | 8831 | 5788 | 7 | 7 | 0.08% | 0.12% | 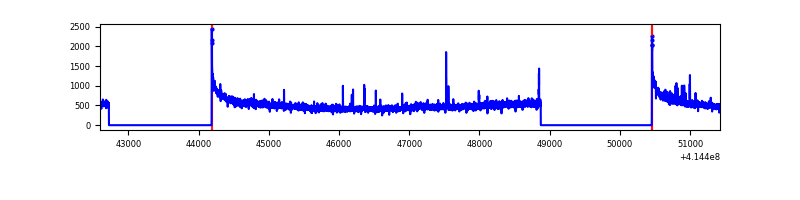 |
| B | 8831 | 5786 | 32 | 32 | 0.36% | 0.55% | 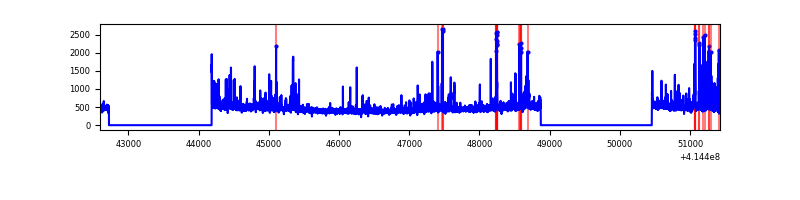 |
| C | 8830 | 5785 | 43 | 43 | 0.49% | 0.74% | 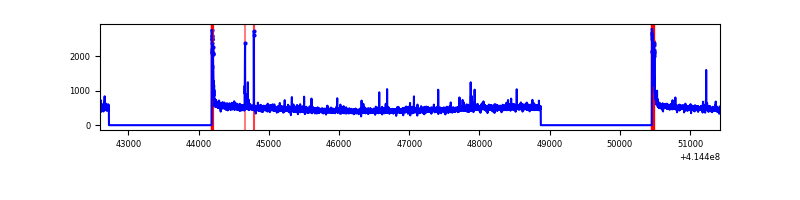 |
| D | 8831 | 5786 | 212 | 212 | 2.40% | 3.66% | 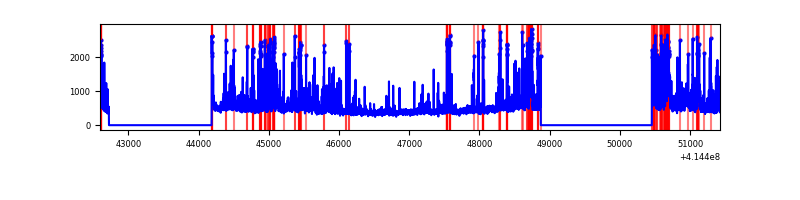 |
Top three noisy pixels from each quadrant. If the there are fewer than three noisy pixels in the level2.evt file, extra rows are filled as -1
| Pixel properties | Quadrant properties | ||||||
|---|---|---|---|---|---|---|---|
| Quadrant | DetID | PixID | Counts | Sigma | Mean | Median | Sigma |
| A | 10 | 83 | 479482 | 3646.27 | 637 | 625 | 131.3 |
| A | 6 | 10 | 52813 | 397.39 | 637 | 625 | 131.3 |
| A | 15 | 191 | 12033 | 86.87 | 637 | 625 | 131.3 |
| B | 4 | 171 | 304302 | 2456.22 | 633 | 616 | 123.6 |
| B | 15 | 201 | 72722 | 583.2 | 633 | 616 | 123.6 |
| B | 0 | 221 | 26991 | 213.32 | 633 | 616 | 123.6 |
| C | 15 | 214 | 240904 | 1634.39 | 624 | 626 | 147.0 |
| C | 0 | 10 | 125353 | 848.4 | 624 | 626 | 147.0 |
| C | 14 | 254 | 38421 | 257.08 | 624 | 626 | 147.0 |
| D | 2 | 250 | 296932 | 1976.78 | 613 | 596 | 149.9 |
| D | 12 | 233 | 246375 | 1639.52 | 613 | 596 | 149.9 |
| D | 12 | 227 | 227334 | 1512.51 | 613 | 596 | 149.9 |
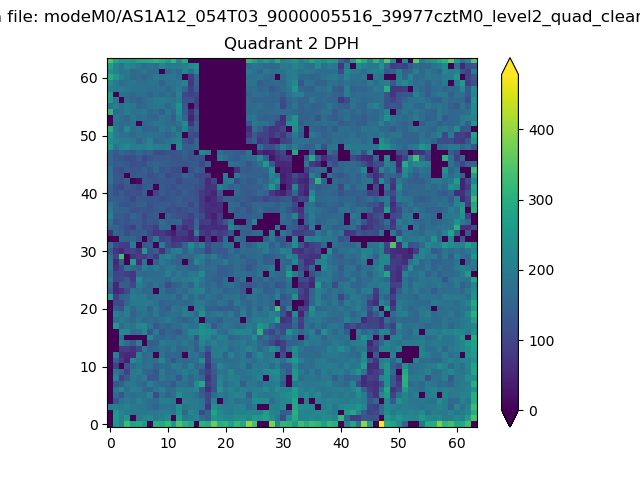
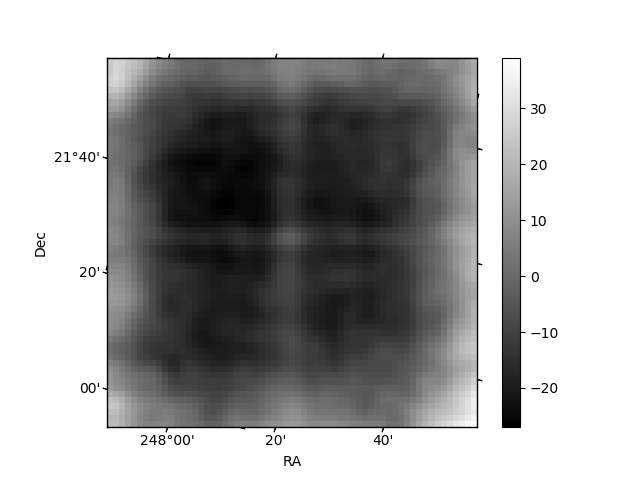
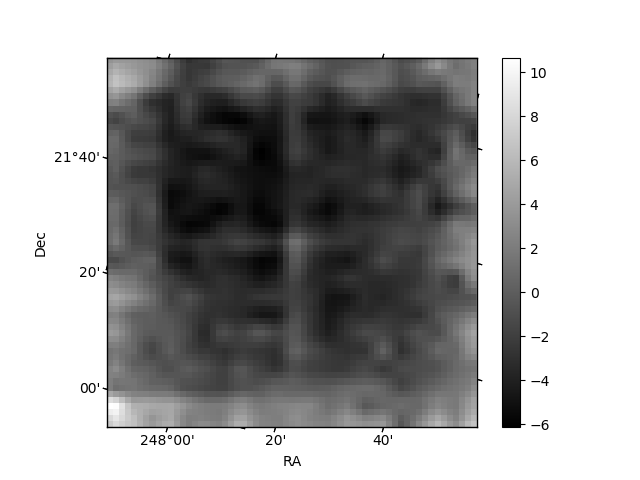
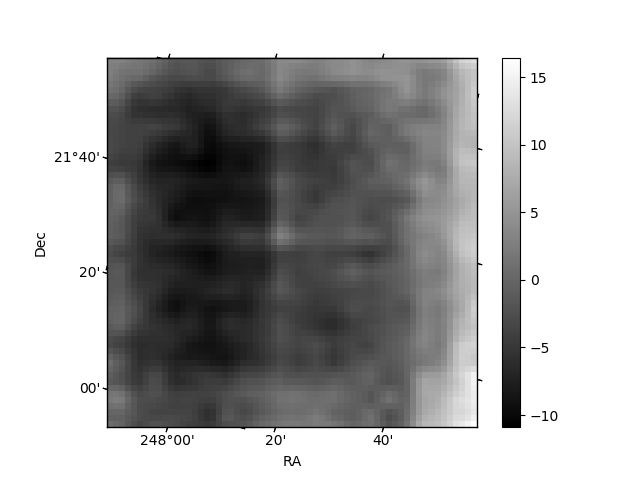
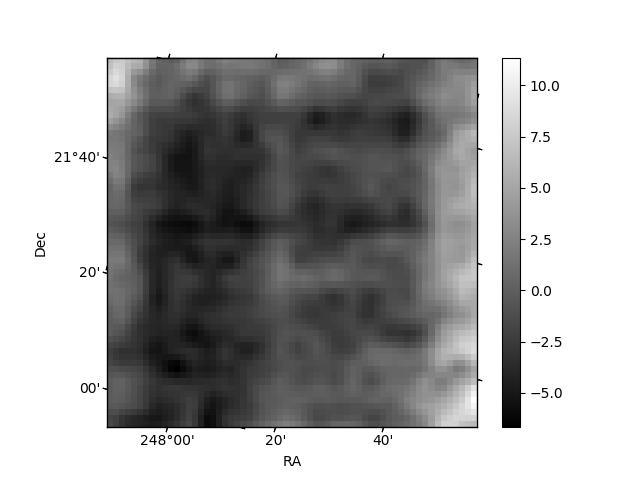
Histogram calculated using DETX and DETY for each event in the final _common_clean file
| Quadrant A | 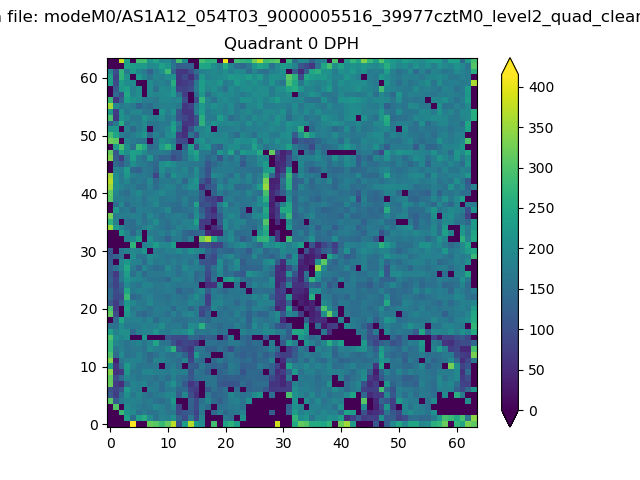 |
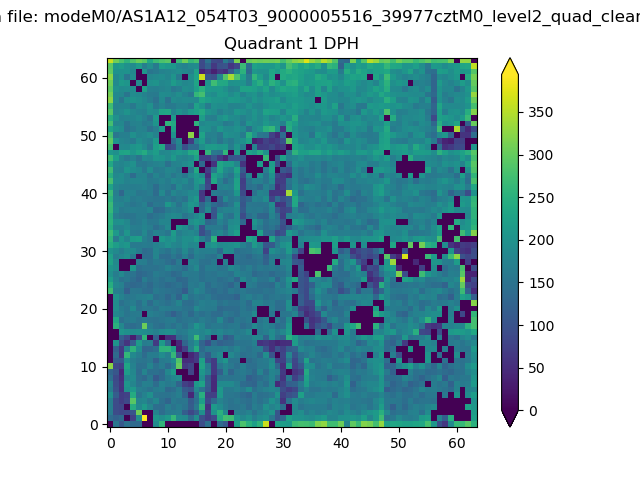 |
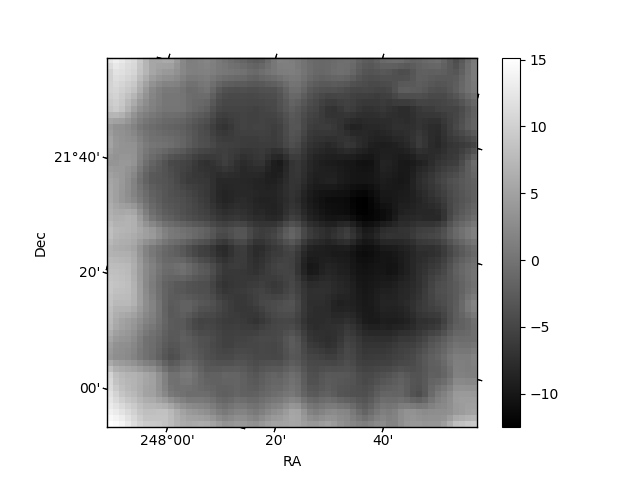
Quadrant B |
|---|---|---|---|
| Quadrant D | 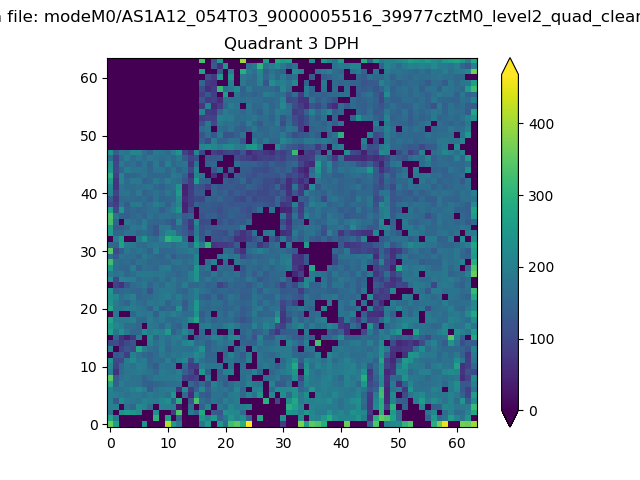 |
 |
Quadrant C |
| Plot type | Count rate plots | Images |
|---|---|---|
| Comparison with Poisson distribution Blue bars denote a histogram of data divided into 1 sec bins. Red curve is a Poisson curve with rate = median count rate of data. |
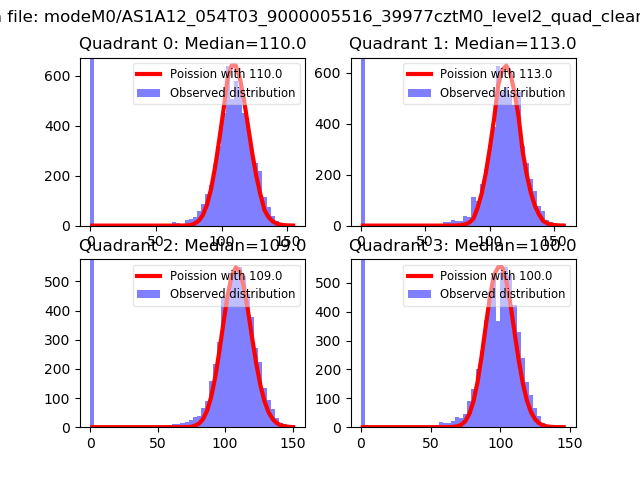 |
 |
| Quadrant-wise count rates Data is divided into 100 sec bins |
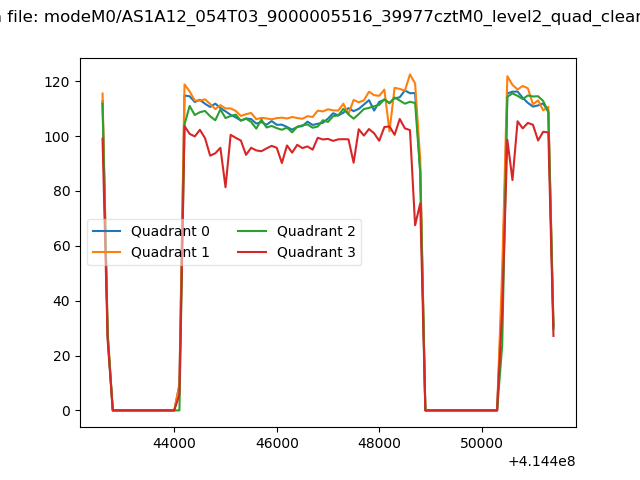 |
|
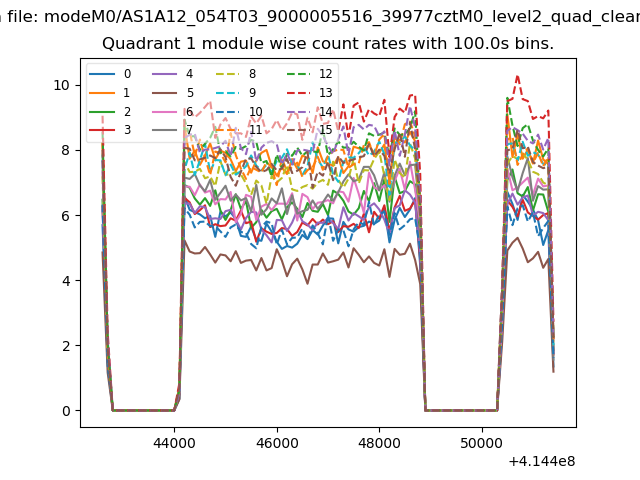
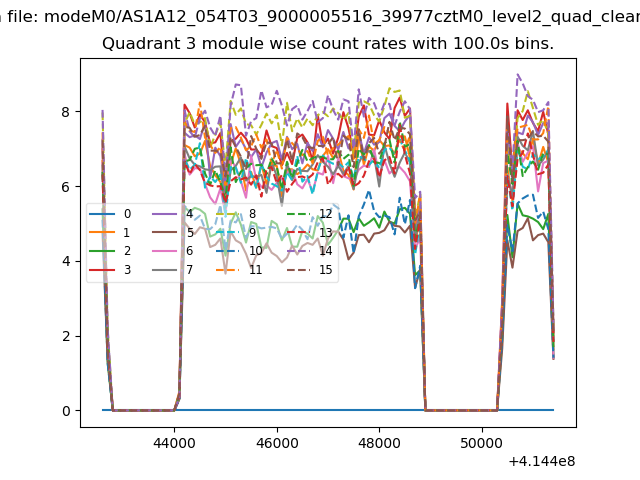
| Module-wise count rates for Quadrant A Data is divided into 100 sec bins |
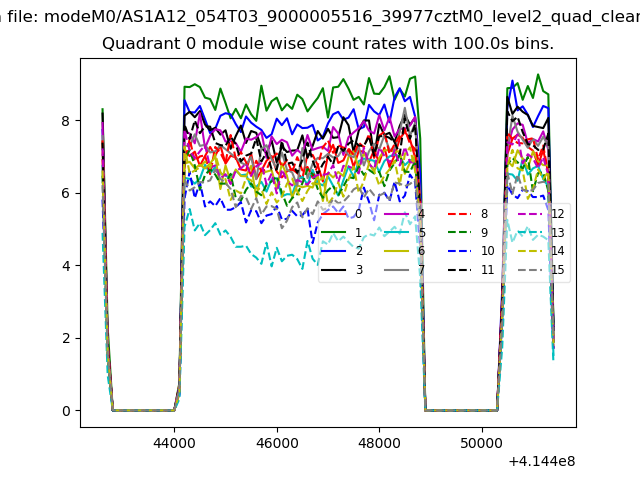 |
 |
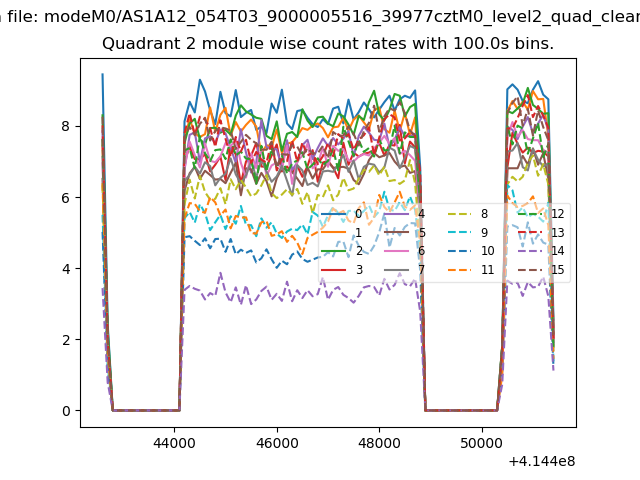
| Module-wise count rates for Quadrant B Data is divided into 100 sec bins |
 |
 |
| Module-wise count rates for Quadrant C Data is divided into 100 sec bins |
 |
 |
| Module-wise count rates for Quadrant D Data is divided into 100 sec bins |
 |
 |
| Parameter | Plot |
|---|---|
| CZT HV Monitor | 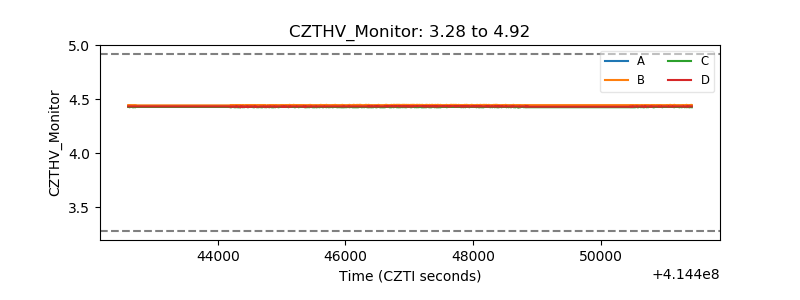 |
| D_VDD | 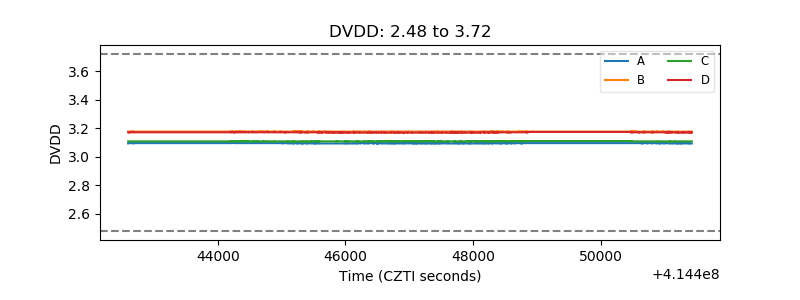 |
| Temperature 1 | 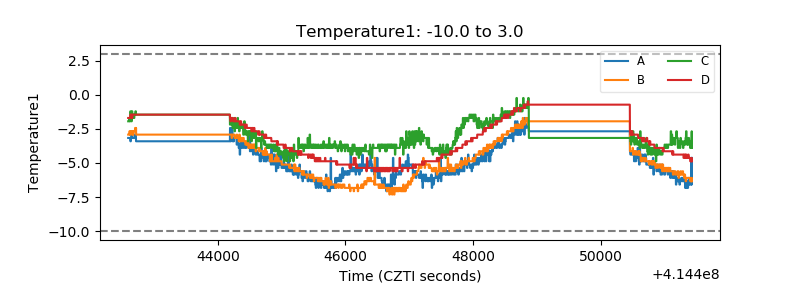 |
| Veto HV Monitor | 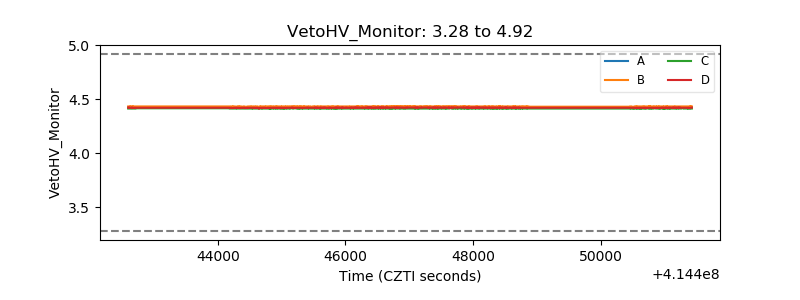 |
| Veto LLD | 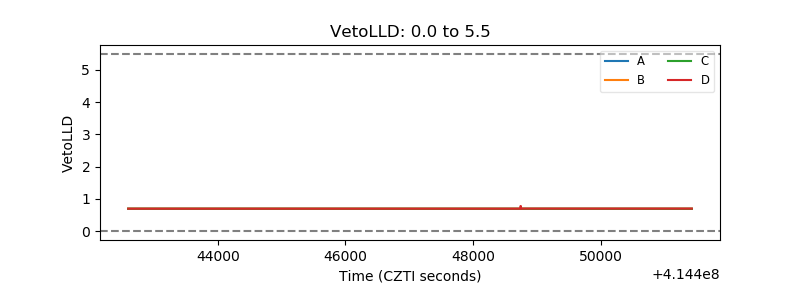 |
| Alpha Counter | 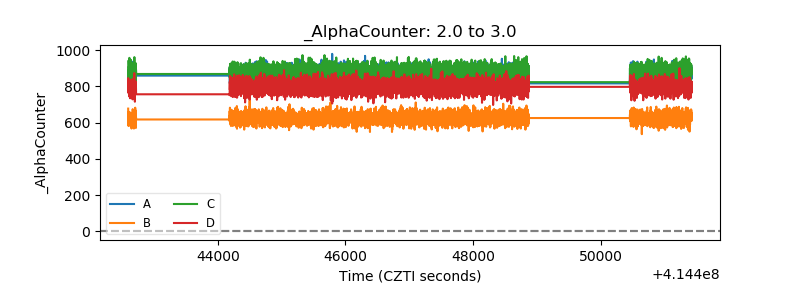 |
| _CPM_Rate | 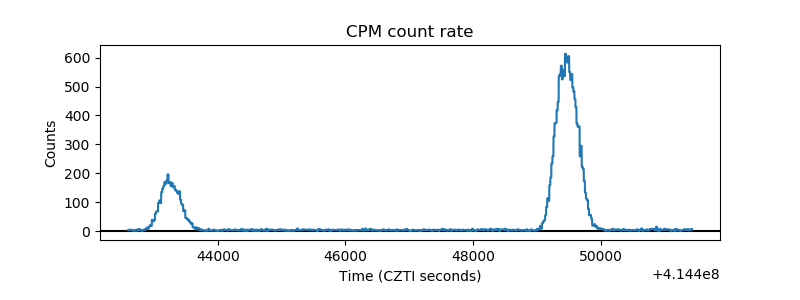 |
| CZT Counter | 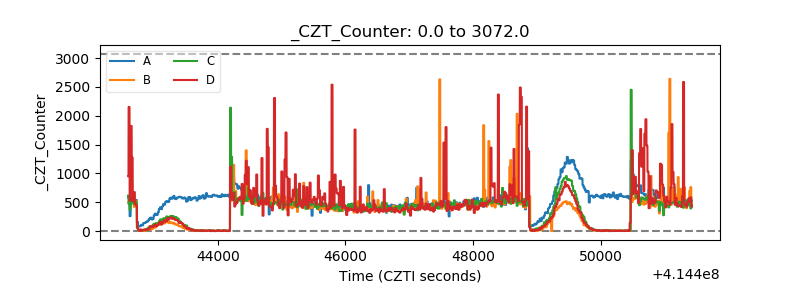 |
| +2.5 Volts monitor | 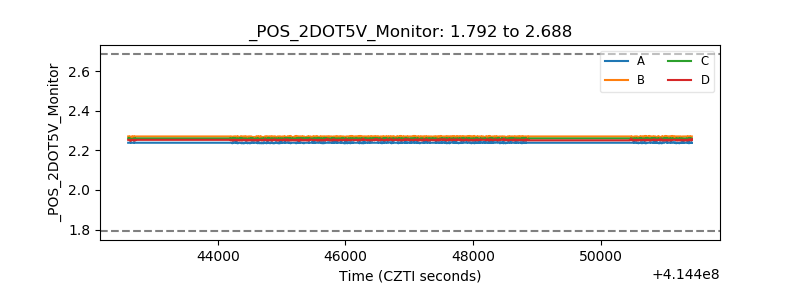 |
| +5 Volts monitor |  |
| _ROLL_ROT | 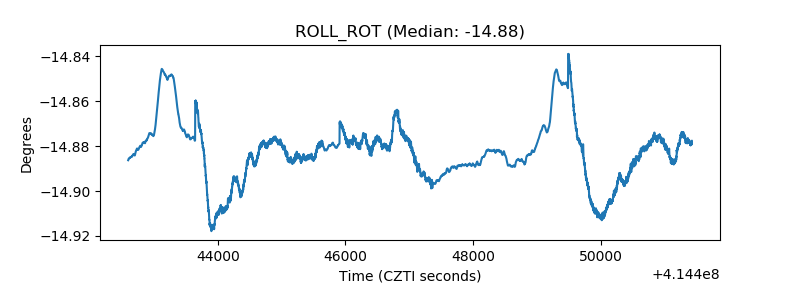 |
| _Roll_DEC | 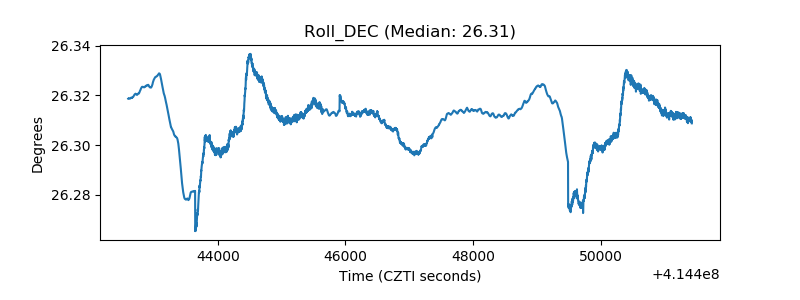 |
| _Roll_RA | 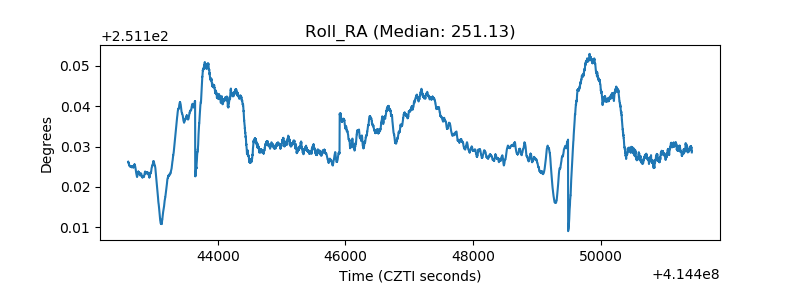 |
| Veto Counter | 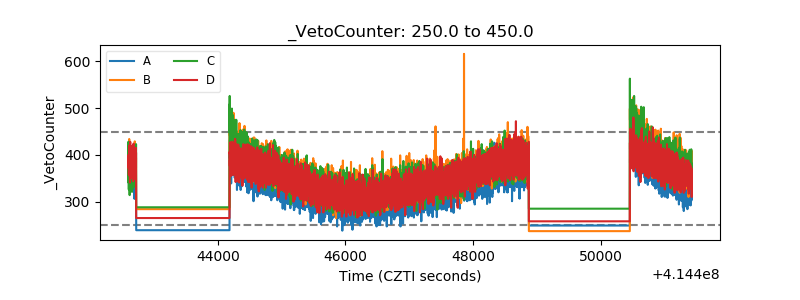 |