| Param | Original file | Final file |
|---|---|---|
| Filename | modeM0/AS1A12_054T03_9000005516_39978cztM0_level2.fits | modeM0/AS1A12_054T03_9000005516_39978cztM0_level2_quad_clean.evt |
| Size (bytes) | 605,638,080 | 165,686,400 |
| Size | 577.6 MB | 158.0 MB |
| Events in quadrant A | 5,073,736 | 1,105,711 |
| Events in quadrant B | 4,999,259 | 1,135,741 |
| Events in quadrant C | 4,918,029 | 1,098,835 |
| Events in quadrant D | 6,646,609 | 979,540 |
| Mode M9 | |||
|---|---|---|---|
| Quadrant | BADHDUFLAG | Total packets | Discarded packets |
| A | 0 | 33 | 0 |
| B | 0 | 33 | 0 |
| C | 0 | 33 | 0 |
| D | 0 | 33 | 0 |
| Mode SS | |||
|---|---|---|---|
| Quadrant | BADHDUFLAG | Total packets | Discarded packets |
| A | 0 | 204 | 0 |
| B | 0 | 204 | 0 |
| C | 0 | 204 | 0 |
| D | 0 | 204 | 0 |
| Mode M0 | |||
|---|---|---|---|
| Quadrant | BADHDUFLAG | Total packets | Discarded packets |
| A | 0 | 21527 | 3 |
| B | 0 | 21880 | 2 |
| C | 0 | 21043 | 2 |
| D | 0 | 26966 | 2 |
| Quadrant | Total seconds | Saturated seconds | Saturation percentage |
|---|---|---|---|
| A | 10064 | 17 | 0.168919% |
| B | 10064 | 77 | 0.765103% |
| C | 10064 | 68 | 0.675676% |
| D | 10064 | 452 | 4.491256% |
Noise dominated data is calculated using 1-second bins in cleaned event files. If a bin has >2000 counts, and if more than 50% of those come from <1% of pixels, then it is considered to be noise-dominated and hence unusable.
| Quadrant | # 1 sec bins | Bins with >0 counts | Bins with >2000 counts | High rate bins dominated by noise | Noise dominated (total time) | Noise dominated (detector-on time) | Marked lightcurve |
|---|---|---|---|---|---|---|---|
| A | 13348 | 10066 | 6 | 6 | 0.04% | 0.06% | 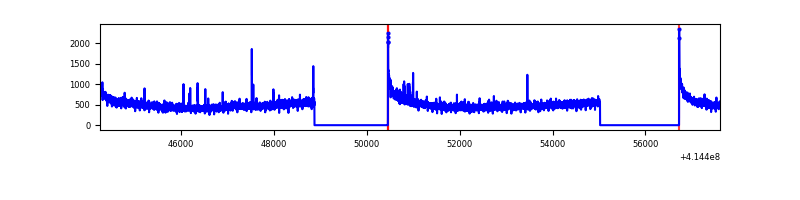 |
| B | 13348 | 10064 | 42 | 42 | 0.31% | 0.42% | 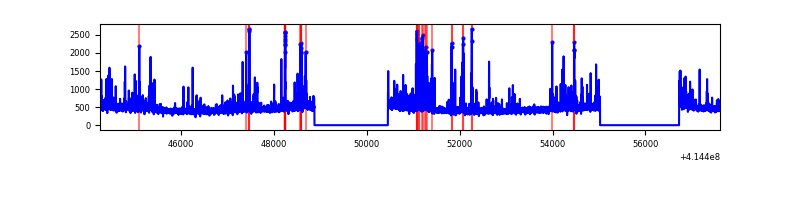 |
| C | 13347 | 10063 | 60 | 60 | 0.45% | 0.60% | 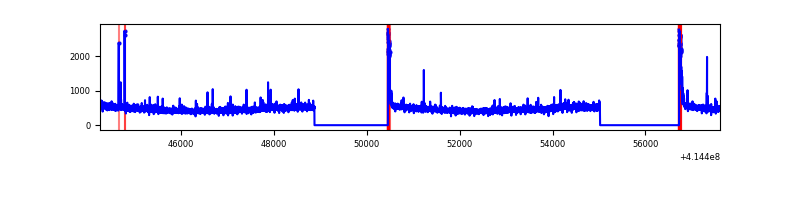 |
| D | 13348 | 10064 | 439 | 439 | 3.29% | 4.36% | 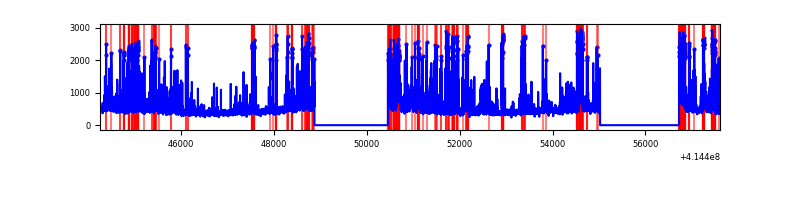 |
Top three noisy pixels from each quadrant. If the there are fewer than three noisy pixels in the level2.evt file, extra rows are filled as -1
| Pixel properties | Quadrant properties | ||||||
|---|---|---|---|---|---|---|---|
| Quadrant | DetID | PixID | Counts | Sigma | Mean | Median | Sigma |
| A | 10 | 83 | 741338 | 3284.82 | 1097 | 1076 | 225.4 |
| A | 6 | 10 | 69641 | 304.25 | 1097 | 1076 | 225.4 |
| A | 15 | 191 | 19698 | 82.63 | 1097 | 1076 | 225.4 |
| B | 4 | 171 | 508813 | 2399.99 | 1092 | 1061 | 211.6 |
| B | 15 | 201 | 74638 | 347.78 | 1092 | 1061 | 211.6 |
| B | 0 | 221 | 41216 | 189.8 | 1092 | 1061 | 211.6 |
| C | 15 | 214 | 415044 | 1652.69 | 1074 | 1079 | 250.5 |
| C | 0 | 10 | 181297 | 719.49 | 1074 | 1079 | 250.5 |
| C | 14 | 254 | 58345 | 228.62 | 1074 | 1079 | 250.5 |
| D | 12 | 227 | 600559 | 2330.32 | 1049 | 1019 | 257.3 |
| D | 2 | 249 | 504658 | 1957.57 | 1049 | 1019 | 257.3 |
| D | 12 | 233 | 342775 | 1328.35 | 1049 | 1019 | 257.3 |
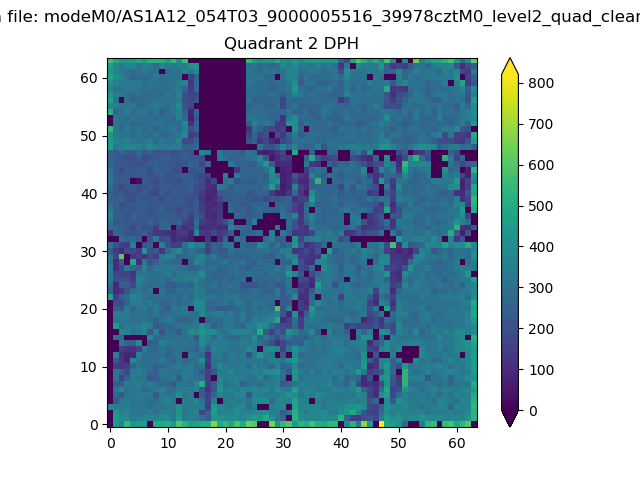
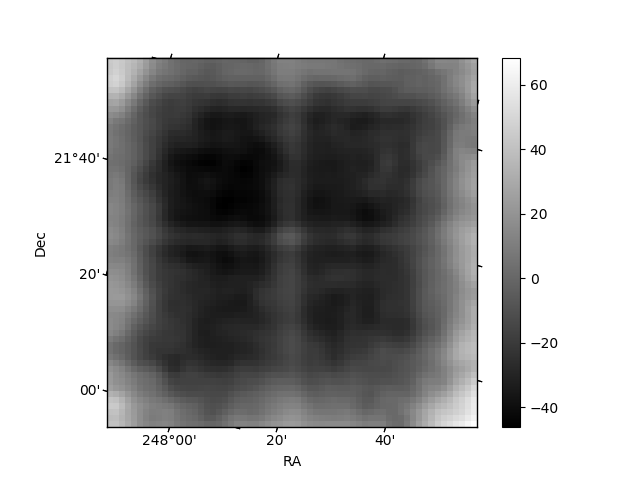
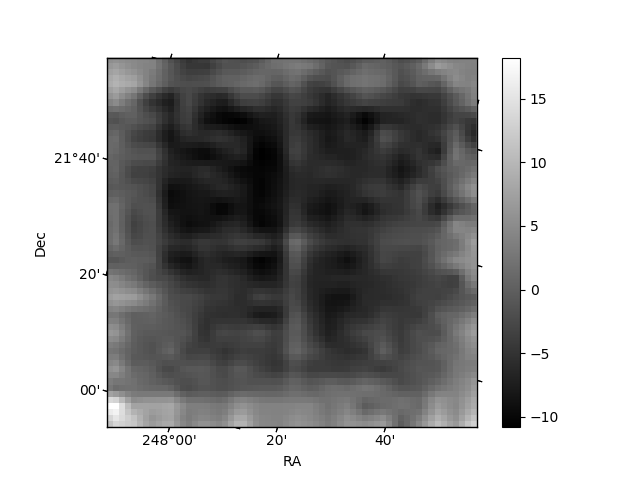
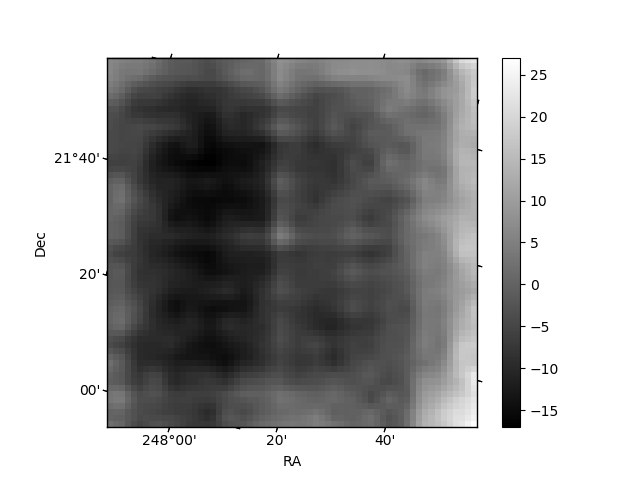
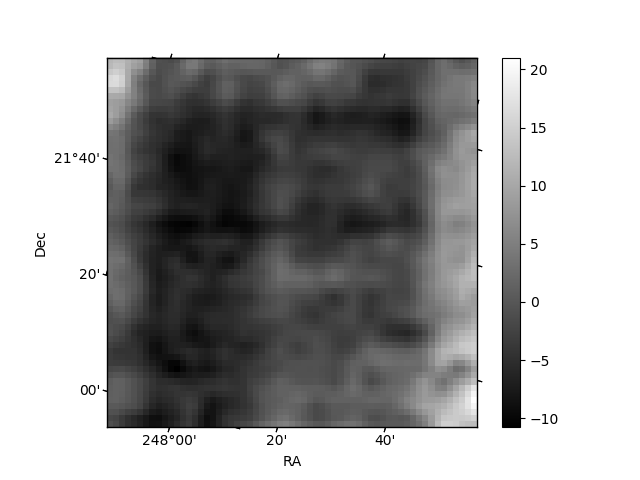
Histogram calculated using DETX and DETY for each event in the final _common_clean file
| Quadrant A | 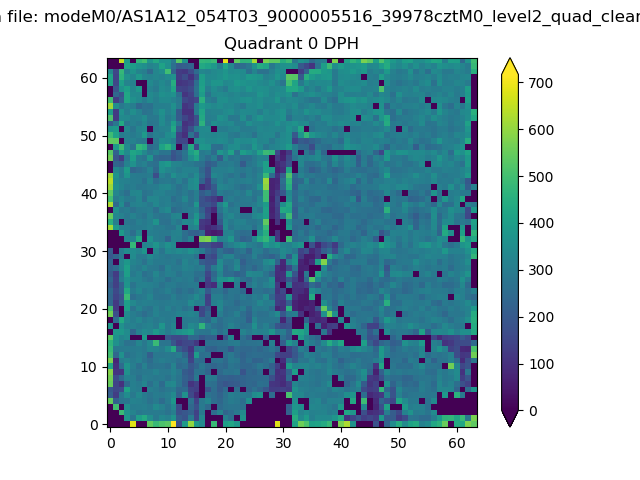 |
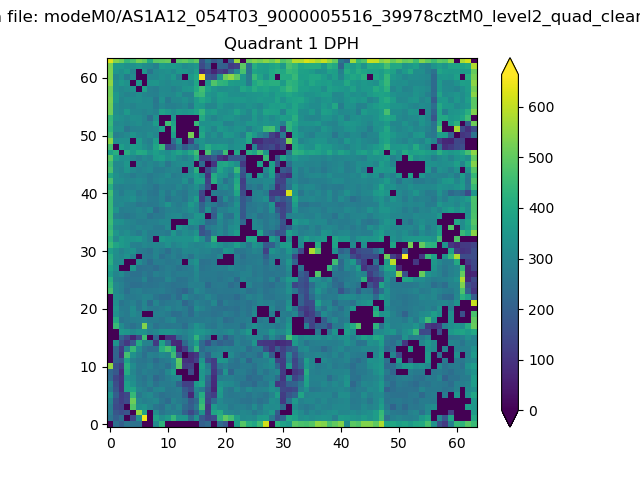 |
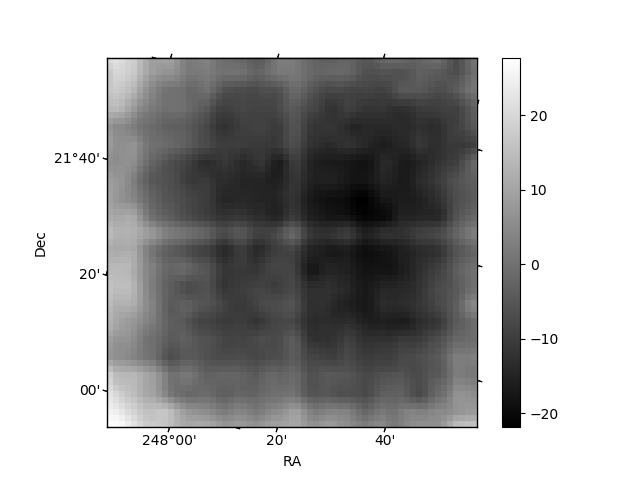
Quadrant B |
|---|---|---|---|
| Quadrant D | 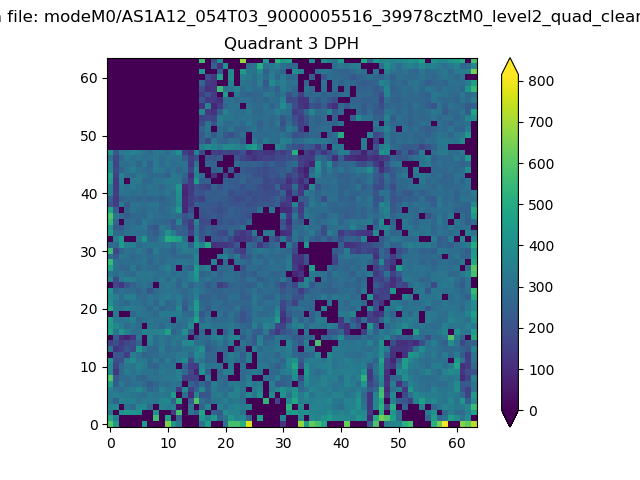 |
 |
Quadrant C |
| Plot type | Count rate plots | Images |
|---|---|---|
| Comparison with Poisson distribution Blue bars denote a histogram of data divided into 1 sec bins. Red curve is a Poisson curve with rate = median count rate of data. |
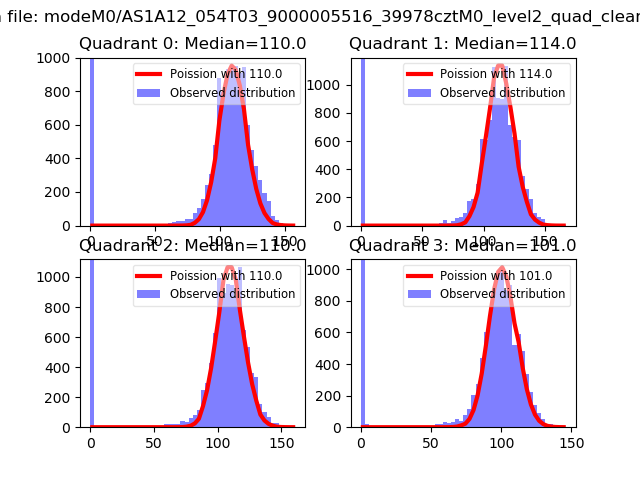 |
 |
| Quadrant-wise count rates Data is divided into 100 sec bins |
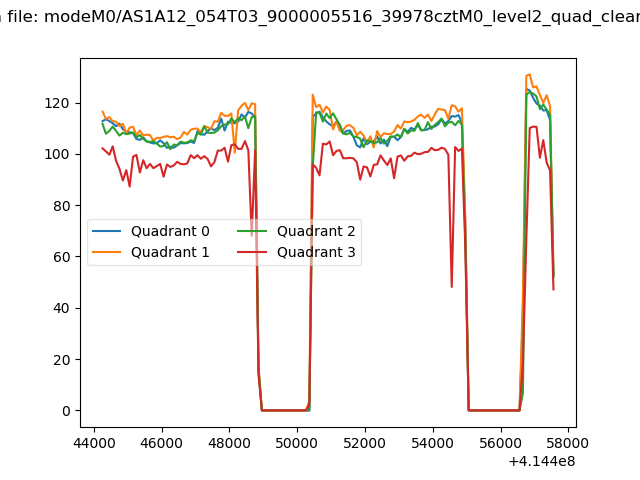 |
|
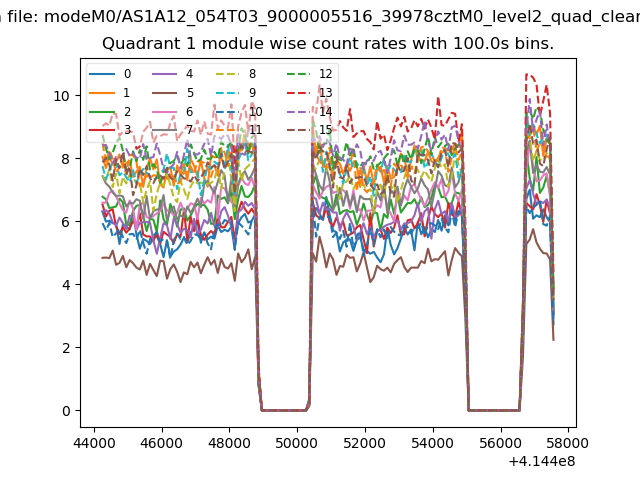
| Module-wise count rates for Quadrant A Data is divided into 100 sec bins |
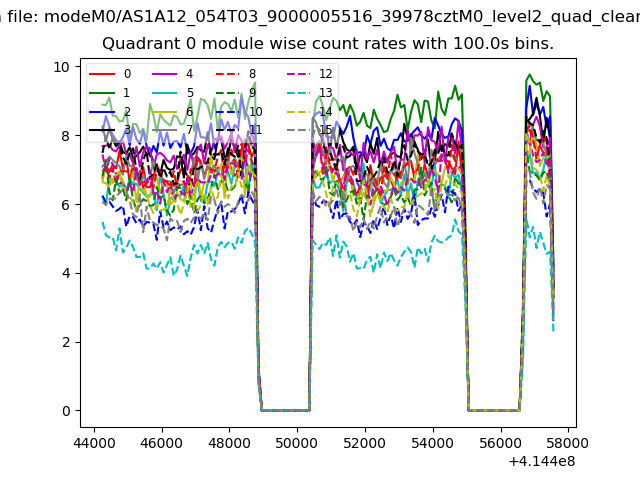 |
 |
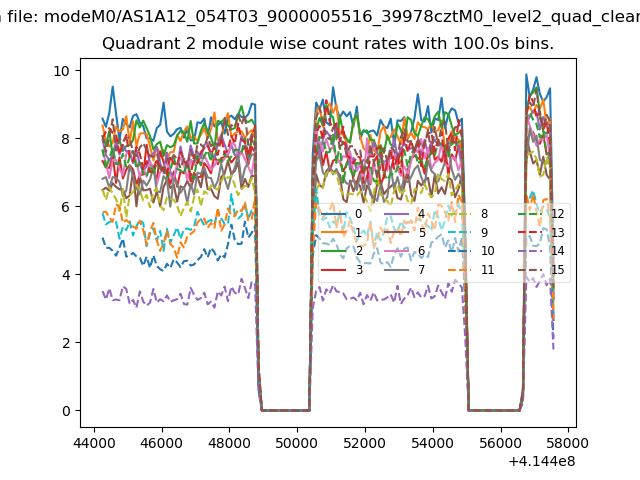
| Module-wise count rates for Quadrant B Data is divided into 100 sec bins |
 |
 |
| Module-wise count rates for Quadrant C Data is divided into 100 sec bins |
 |
 |
| Module-wise count rates for Quadrant D Data is divided into 100 sec bins |
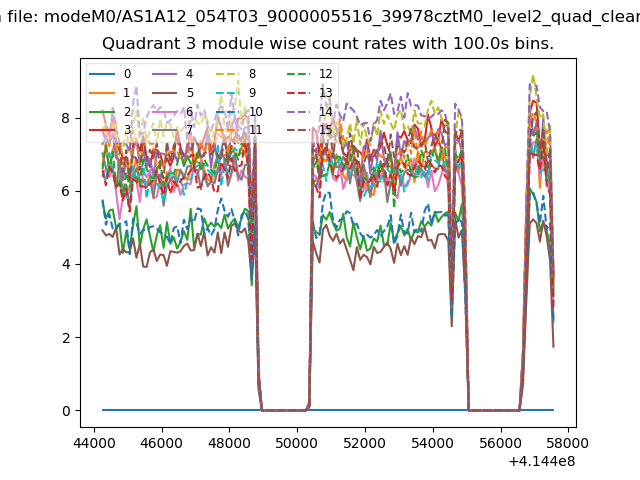 |
 |
| Parameter | Plot |
|---|---|
| CZT HV Monitor | 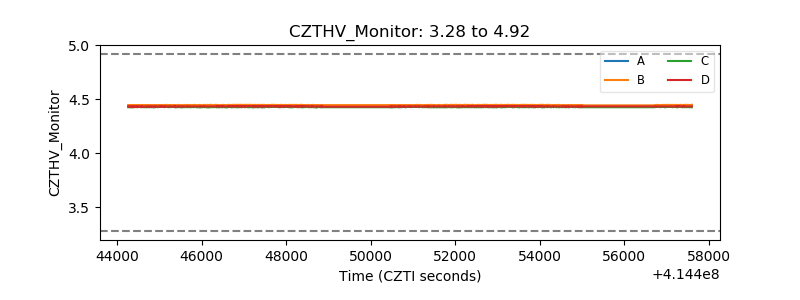 |
| D_VDD | 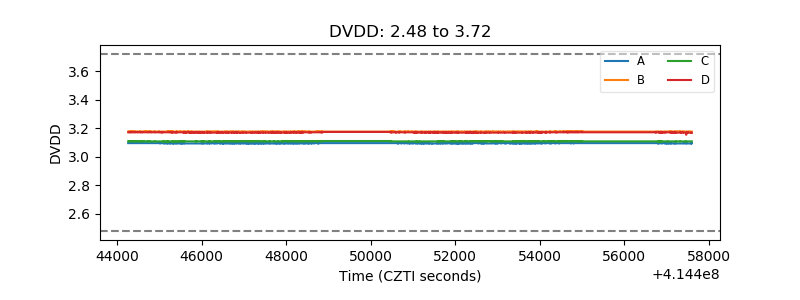 |
| Temperature 1 | 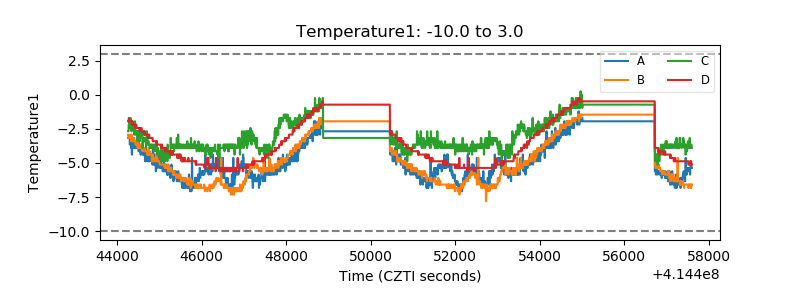 |
| Veto HV Monitor | 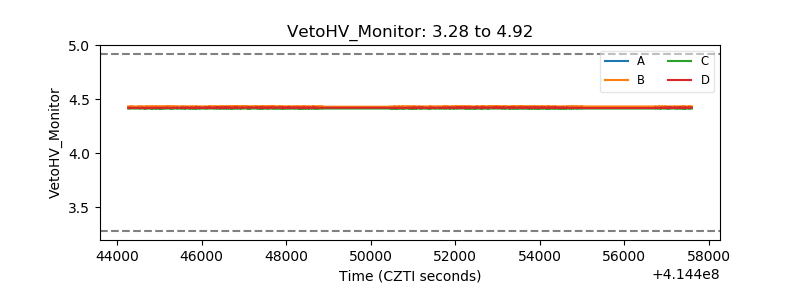 |
| Veto LLD | 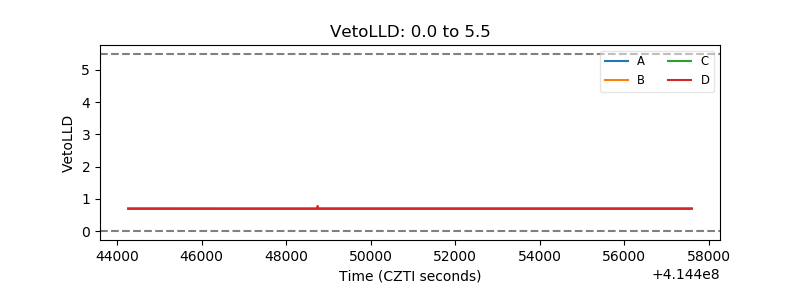 |
| Alpha Counter | 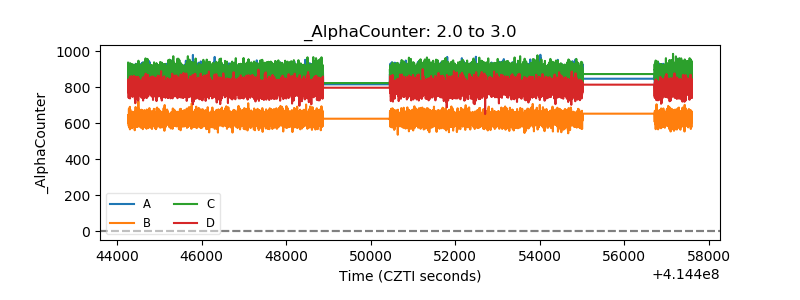 |
| _CPM_Rate | 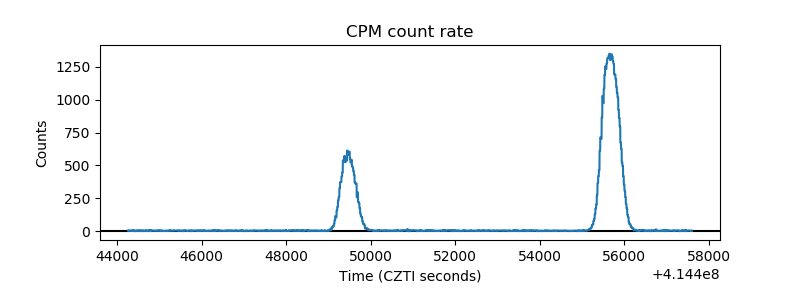 |
| CZT Counter | 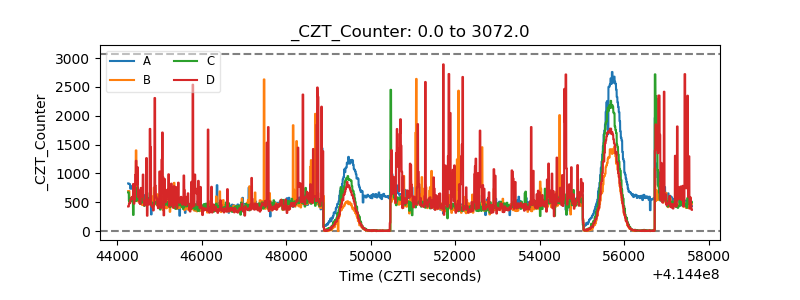 |
| +2.5 Volts monitor |  |
| +5 Volts monitor | 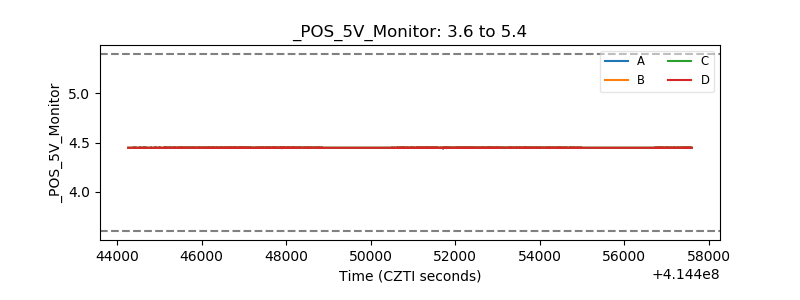 |
| _ROLL_ROT | 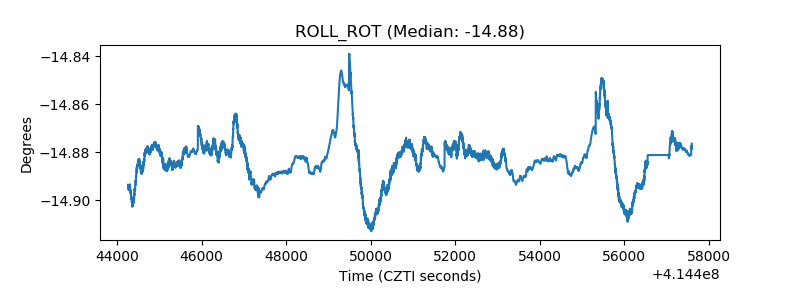 |
| _Roll_DEC | 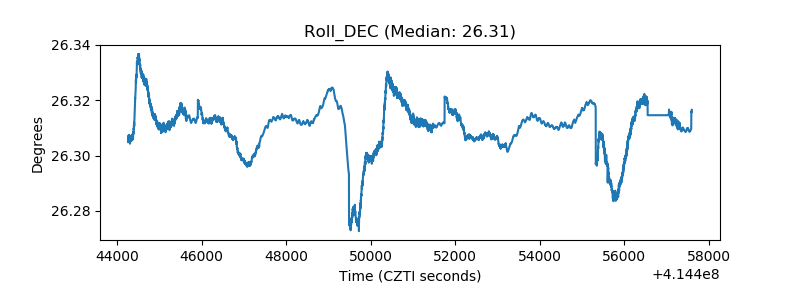 |
| _Roll_RA | 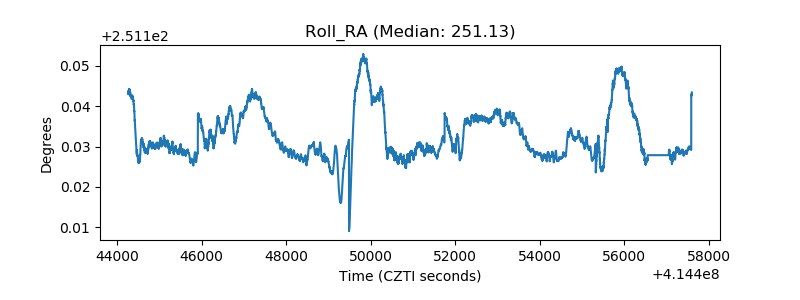 |
| Veto Counter | 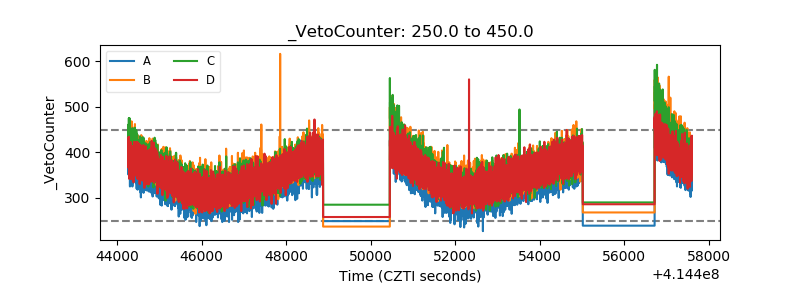 |