| Param | Original file | Final file |
|---|---|---|
| Filename | modeM0/AS1A12_054T03_9000005516_39980cztM0_level2.fits | modeM0/AS1A12_054T03_9000005516_39980cztM0_level2_quad_clean.evt |
| Size (bytes) | 312,540,480 | 92,266,560 |
| Size | 298.1 MB | 88.0 MB |
| Events in quadrant A | 2,755,584 | 618,040 |
| Events in quadrant B | 2,653,666 | 640,117 |
| Events in quadrant C | 2,760,590 | 611,170 |
| Events in quadrant D | 2,982,884 | 550,338 |
| Mode M9 | |||
|---|---|---|---|
| Quadrant | BADHDUFLAG | Total packets | Discarded packets |
| A | 0 | 35 | 0 |
| B | 0 | 35 | 0 |
| C | 0 | 35 | 0 |
| D | 0 | 35 | 0 |
| Mode SS | |||
|---|---|---|---|
| Quadrant | BADHDUFLAG | Total packets | Discarded packets |
| A | 0 | 112 | 0 |
| B | 0 | 112 | 0 |
| C | 0 | 112 | 0 |
| D | 0 | 112 | 0 |
| Mode M0 | |||
|---|---|---|---|
| Quadrant | BADHDUFLAG | Total packets | Discarded packets |
| A | 0 | 11571 | 3 |
| B | 0 | 11603 | 2 |
| C | 0 | 11582 | 2 |
| D | 0 | 12711 | 2 |
| Quadrant | Total seconds | Saturated seconds | Saturation percentage |
|---|---|---|---|
| A | 5343 | 11 | 0.205877% |
| B | 5343 | 44 | 0.823507% |
| C | 5343 | 46 | 0.860940% |
| D | 5343 | 122 | 2.283361% |
Noise dominated data is calculated using 1-second bins in cleaned event files. If a bin has >2000 counts, and if more than 50% of those come from <1% of pixels, then it is considered to be noise-dominated and hence unusable.
| Quadrant | # 1 sec bins | Bins with >0 counts | Bins with >2000 counts | High rate bins dominated by noise | Noise dominated (total time) | Noise dominated (detector-on time) | Marked lightcurve |
|---|---|---|---|---|---|---|---|
| A | 8898 | 5345 | 4 | 4 | 0.04% | 0.07% | 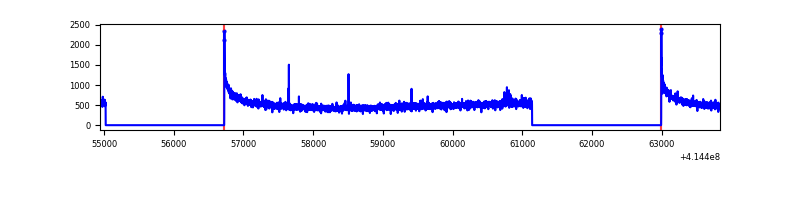 |
| B | 8898 | 5344 | 21 | 21 | 0.24% | 0.39% | 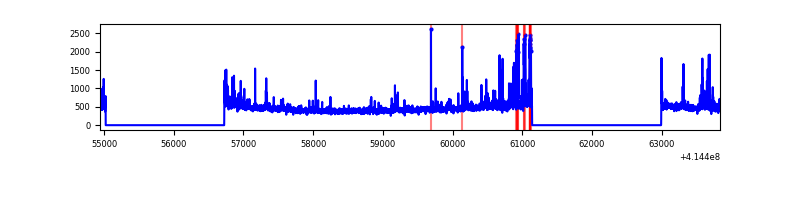 |
| C | 8898 | 5344 | 40 | 40 | 0.45% | 0.75% | 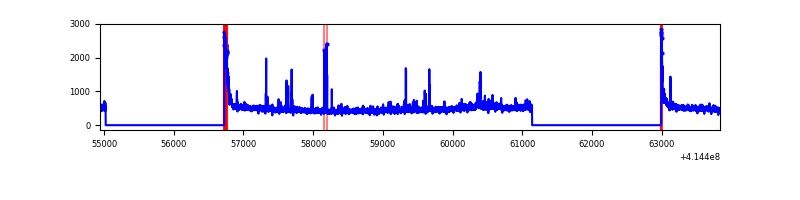 |
| D | 8898 | 5344 | 120 | 120 | 1.35% | 2.25% | 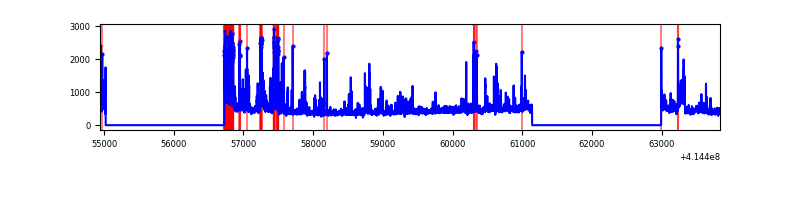 |
Top three noisy pixels from each quadrant. If the there are fewer than three noisy pixels in the level2.evt file, extra rows are filled as -1
| Pixel properties | Quadrant properties | ||||||
|---|---|---|---|---|---|---|---|
| Quadrant | DetID | PixID | Counts | Sigma | Mean | Median | Sigma |
| A | 10 | 83 | 445158 | 3666.22 | 593 | 583 | 121.3 |
| A | 13 | 254 | 8739 | 67.26 | 593 | 583 | 121.3 |
| A | 3 | 137 | 6299 | 47.14 | 593 | 583 | 121.3 |
| B | 4 | 171 | 257289 | 2232.14 | 593 | 577 | 115.0 |
| B | 5 | 255 | 23494 | 199.27 | 593 | 577 | 115.0 |
| B | 12 | 111 | 14065 | 117.28 | 593 | 577 | 115.0 |
| C | 15 | 214 | 223756 | 1646.48 | 580 | 583 | 135.5 |
| C | 0 | 10 | 152074 | 1117.64 | 580 | 583 | 135.5 |
| C | 14 | 254 | 66964 | 489.73 | 580 | 583 | 135.5 |
| D | 2 | 249 | 361943 | 2600.31 | 568 | 553 | 139.0 |
| D | 1 | 47 | 150380 | 1078.05 | 568 | 553 | 139.0 |
| D | 12 | 227 | 116508 | 834.33 | 568 | 553 | 139.0 |
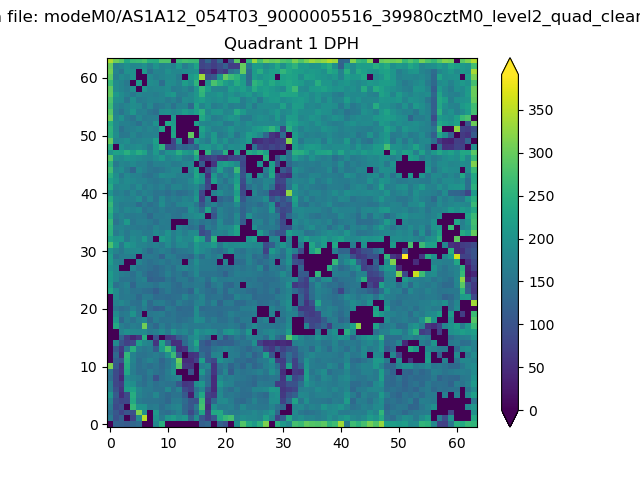
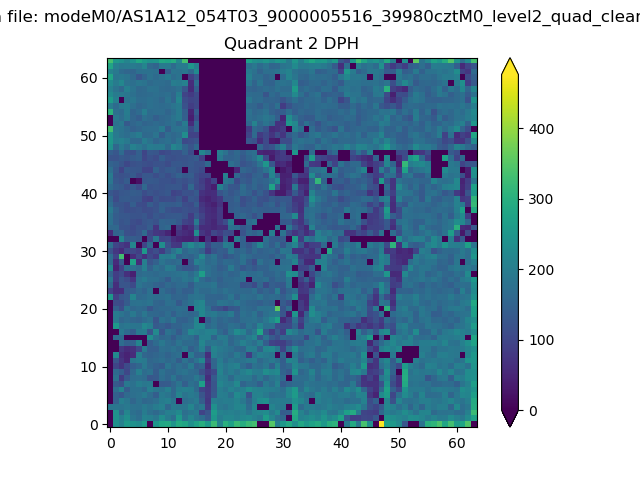
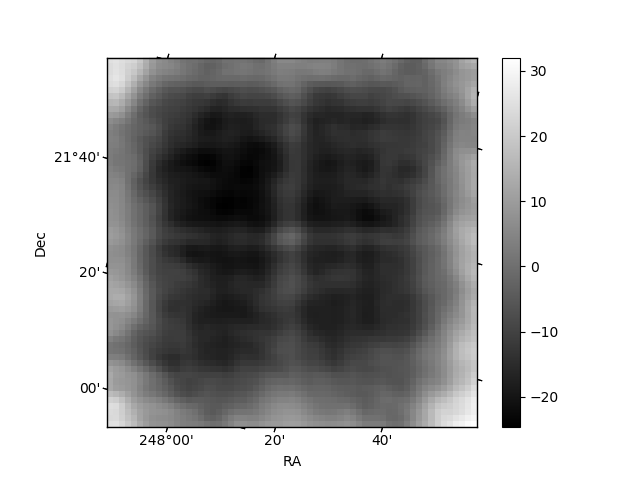
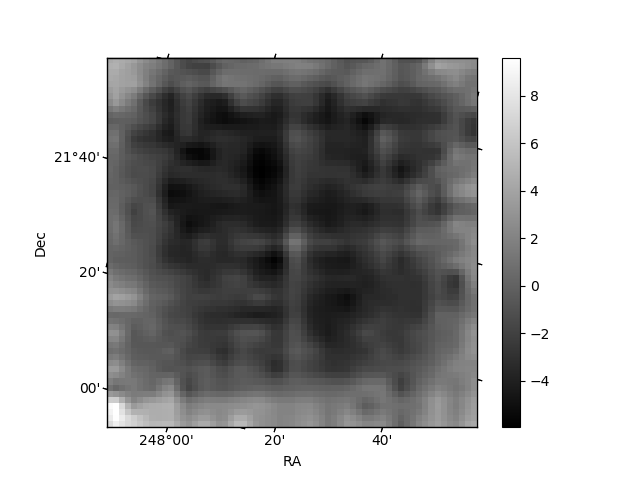
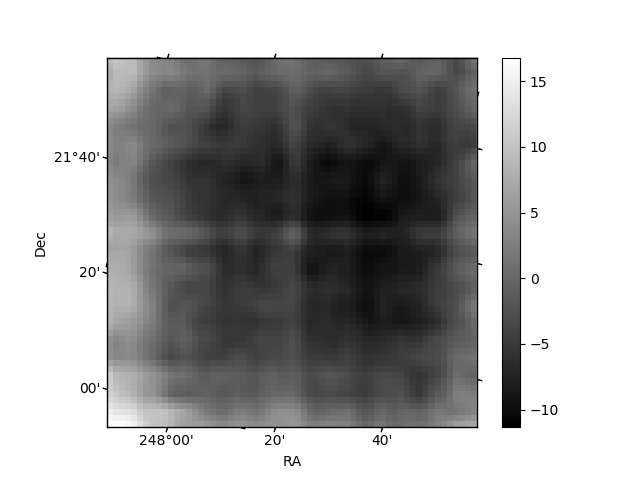
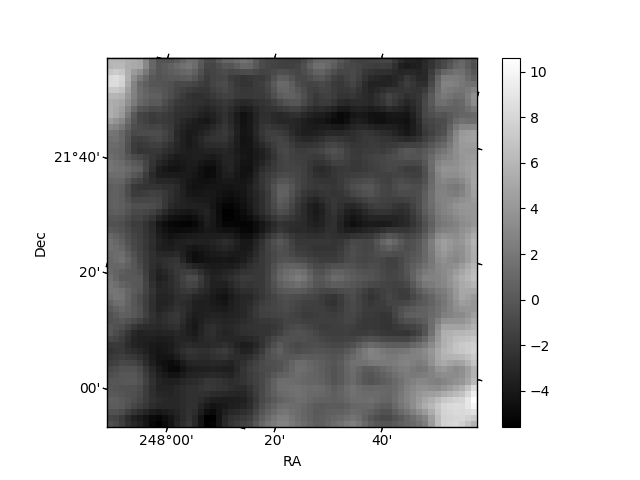
Histogram calculated using DETX and DETY for each event in the final _common_clean file
| Quadrant A |  |
 |
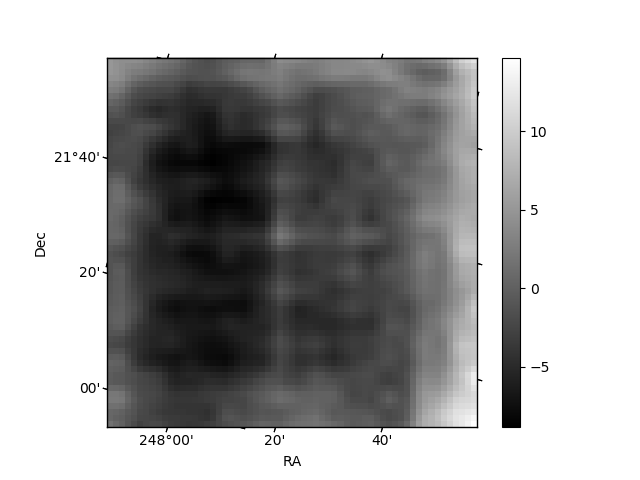
Quadrant B |
|---|---|---|---|
| Quadrant D | 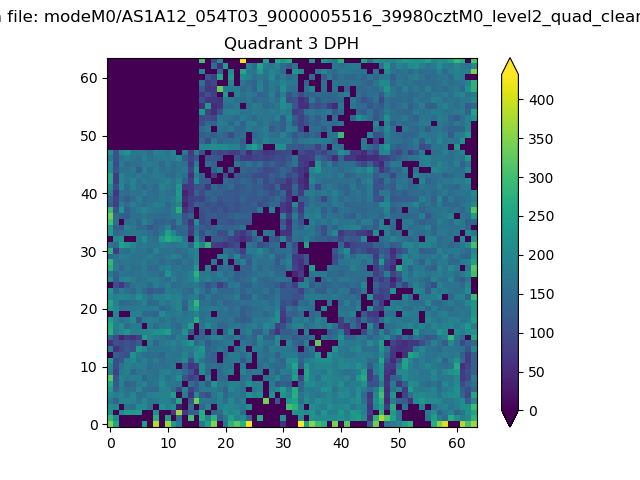 |
 |
Quadrant C |
| Plot type | Count rate plots | Images |
|---|---|---|
| Comparison with Poisson distribution Blue bars denote a histogram of data divided into 1 sec bins. Red curve is a Poisson curve with rate = median count rate of data. |
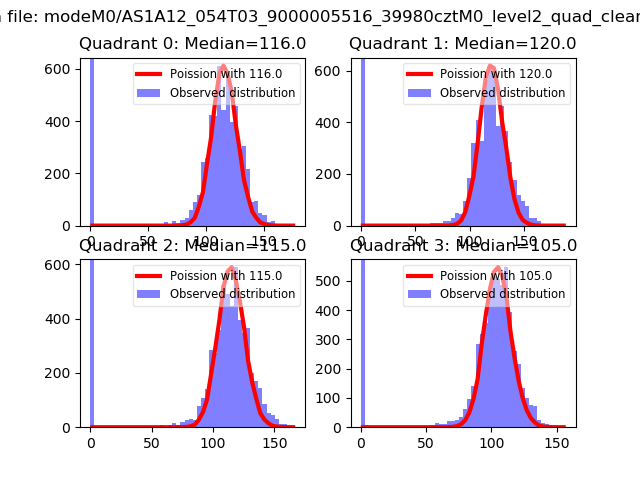 |
 |
| Quadrant-wise count rates Data is divided into 100 sec bins |
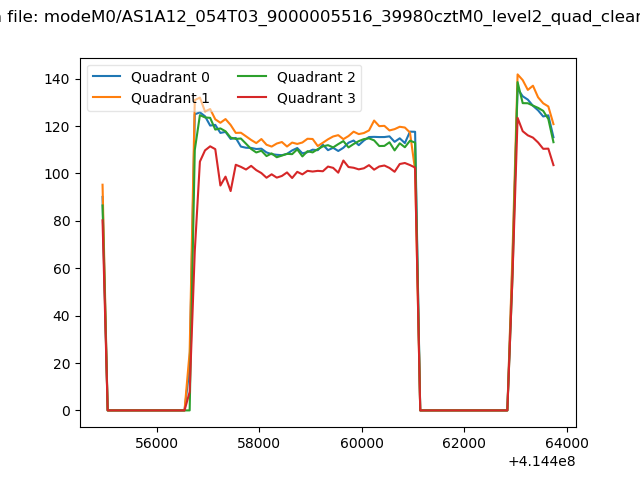 |
|
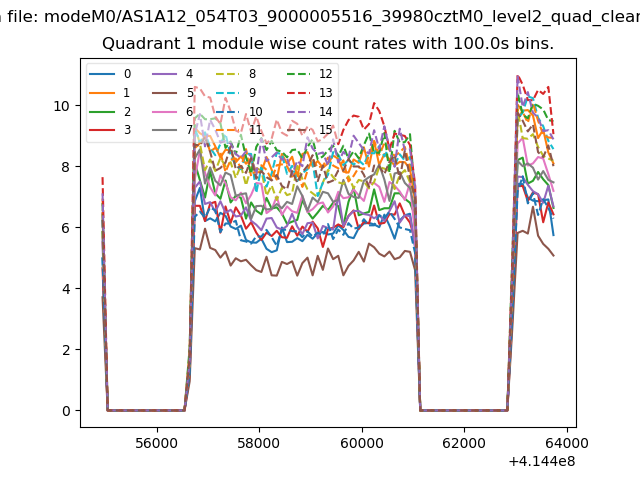
| Module-wise count rates for Quadrant A Data is divided into 100 sec bins |
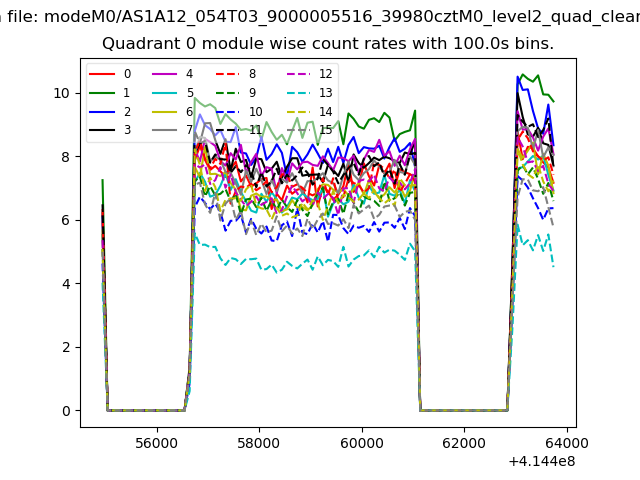 |
 |
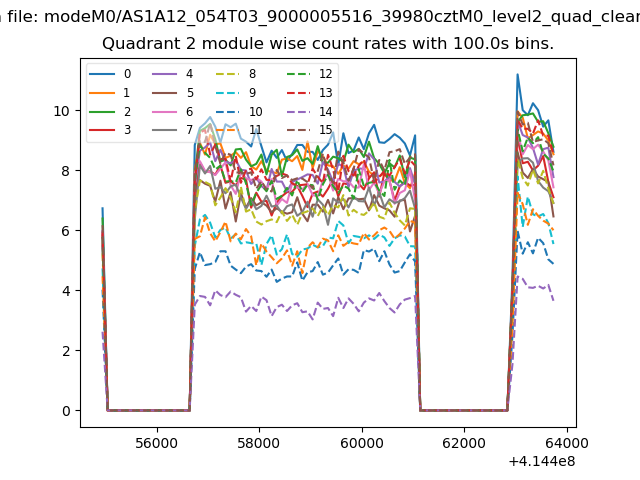
| Module-wise count rates for Quadrant B Data is divided into 100 sec bins |
 |
 |
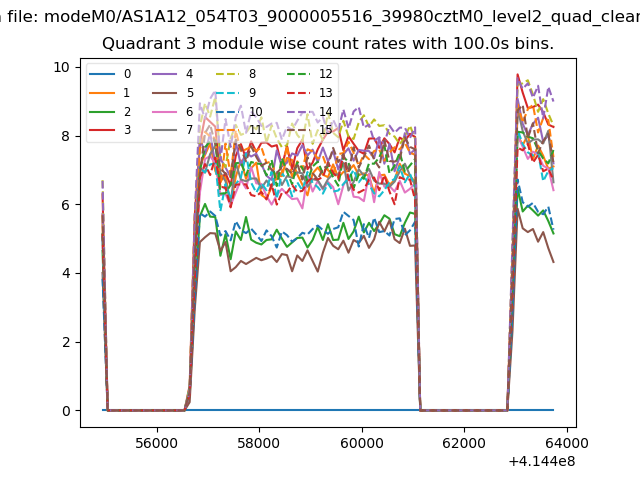
| Module-wise count rates for Quadrant C Data is divided into 100 sec bins |
 |
 |
| Module-wise count rates for Quadrant D Data is divided into 100 sec bins |
 |
 |
| Parameter | Plot |
|---|---|
| CZT HV Monitor | 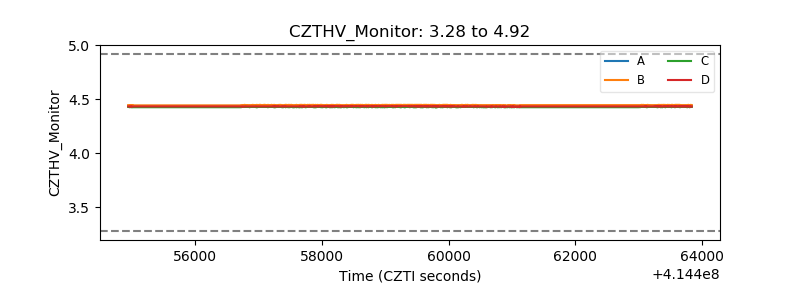 |
| D_VDD | 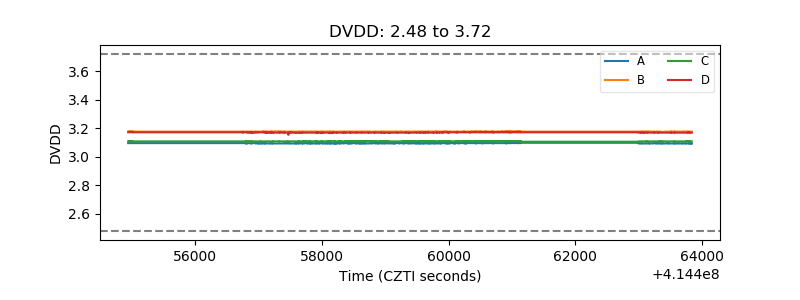 |
| Temperature 1 | 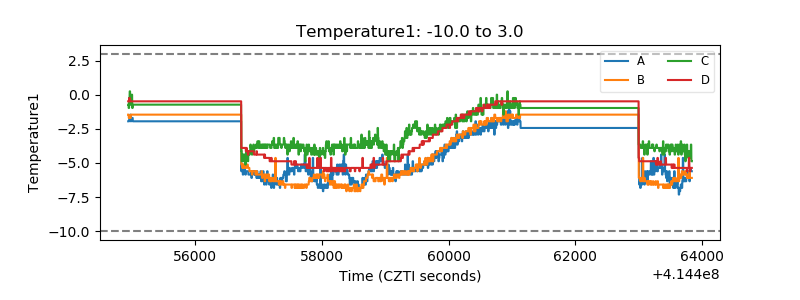 |
| Veto HV Monitor | 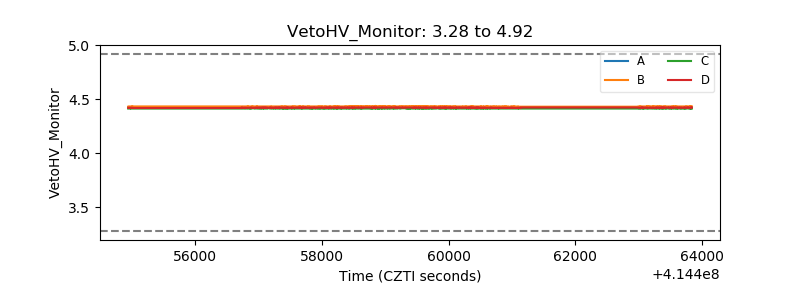 |
| Veto LLD | 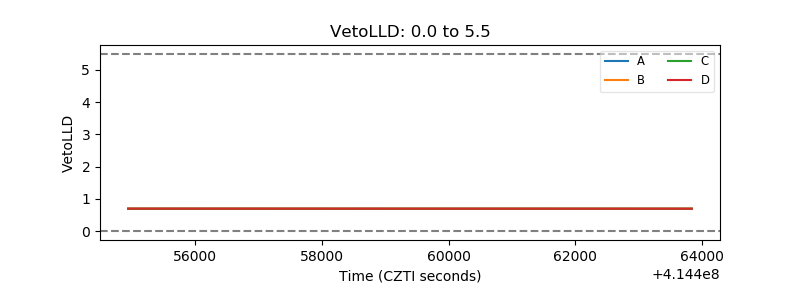 |
| Alpha Counter | 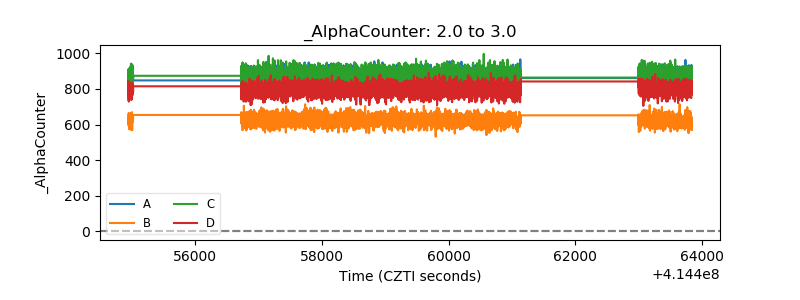 |
| _CPM_Rate | 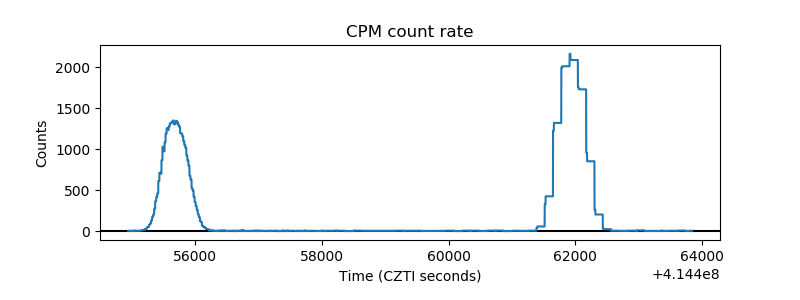 |
| CZT Counter | 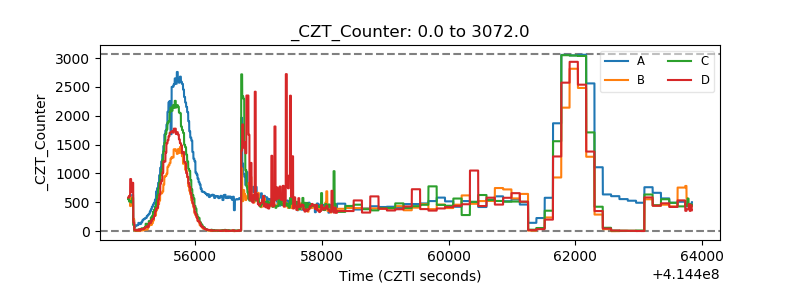 |
| +2.5 Volts monitor | 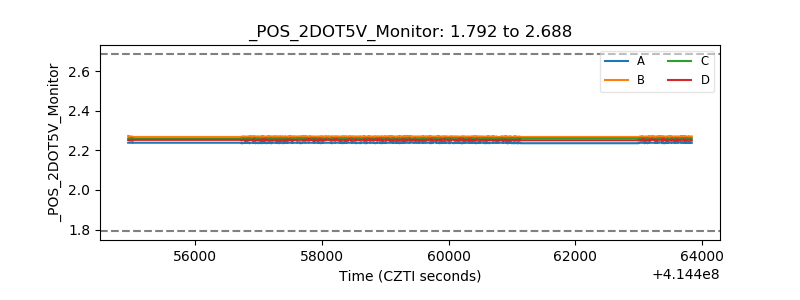 |
| +5 Volts monitor | 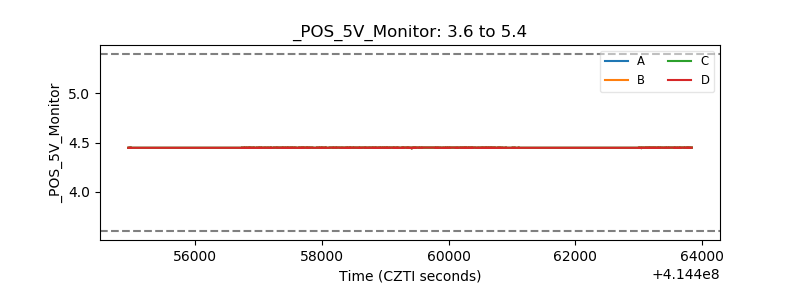 |
| _ROLL_ROT | 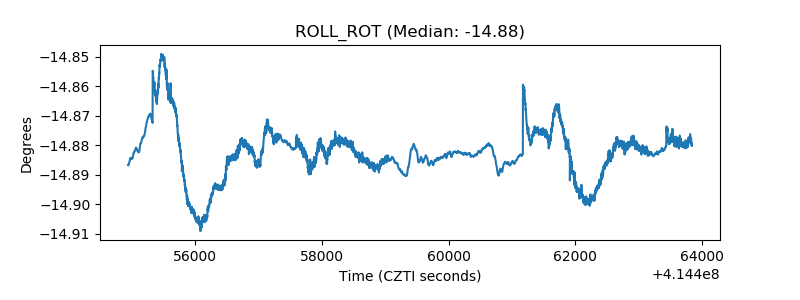 |
| _Roll_DEC | 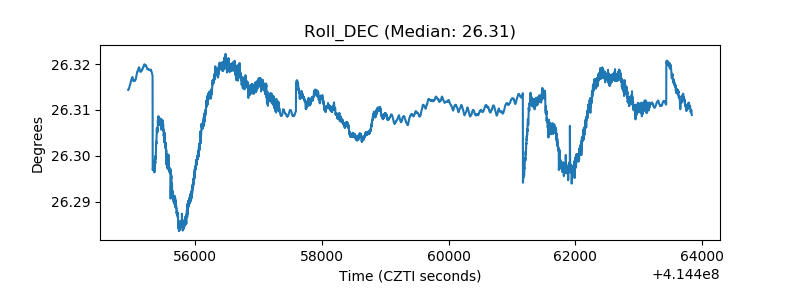 |
| _Roll_RA | 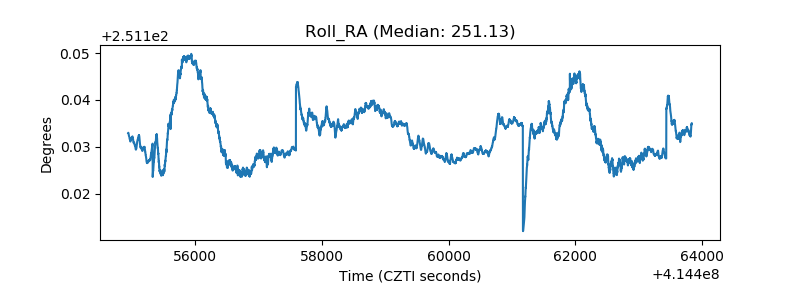 |
| Veto Counter | 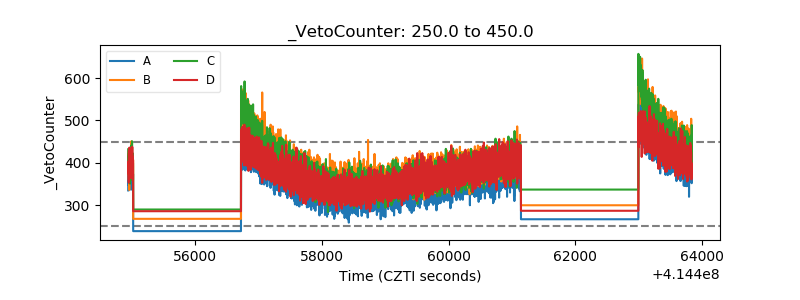 |