| Param | Original file | Final file |
|---|---|---|
| Filename | modeM0/AS1A12_054T03_9000005516_39981cztM0_level2.fits | modeM0/AS1A12_054T03_9000005516_39981cztM0_level2_quad_clean.evt |
| Size (bytes) | 318,421,440 | 95,639,040 |
| Size | 303.7 MB | 91.2 MB |
| Events in quadrant A | 2,899,805 | 645,274 |
| Events in quadrant B | 2,809,236 | 671,539 |
| Events in quadrant C | 2,701,034 | 635,905 |
| Events in quadrant D | 2,960,592 | 569,630 |
| Mode M9 | |||
|---|---|---|---|
| Quadrant | BADHDUFLAG | Total packets | Discarded packets |
| A | 0 | 37 | 0 |
| B | 0 | 37 | 0 |
| C | 0 | 37 | 0 |
| D | 0 | 37 | 0 |
| Mode SS | |||
|---|---|---|---|
| Quadrant | BADHDUFLAG | Total packets | Discarded packets |
| A | 0 | 108 | 0 |
| B | 0 | 108 | 0 |
| C | 0 | 108 | 0 |
| D | 0 | 108 | 0 |
| Mode M0 | |||
|---|---|---|---|
| Quadrant | BADHDUFLAG | Total packets | Discarded packets |
| A | 0 | 11924 | 3 |
| B | 0 | 11901 | 2 |
| C | 0 | 11309 | 2 |
| D | 0 | 12612 | 2 |
| Quadrant | Total seconds | Saturated seconds | Saturation percentage |
|---|---|---|---|
| A | 5341 | 15 | 0.280846% |
| B | 5341 | 54 | 1.011047% |
| C | 5341 | 38 | 0.711477% |
| D | 5341 | 103 | 1.928478% |
Noise dominated data is calculated using 1-second bins in cleaned event files. If a bin has >2000 counts, and if more than 50% of those come from <1% of pixels, then it is considered to be noise-dominated and hence unusable.
| Quadrant | # 1 sec bins | Bins with >0 counts | Bins with >2000 counts | High rate bins dominated by noise | Noise dominated (total time) | Noise dominated (detector-on time) | Marked lightcurve |
|---|---|---|---|---|---|---|---|
| A | 7314 | 5342 | 12 | 12 | 0.16% | 0.22% | 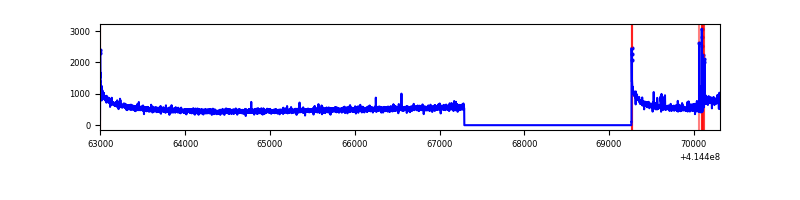 |
| B | 7314 | 5342 | 23 | 23 | 0.31% | 0.43% | 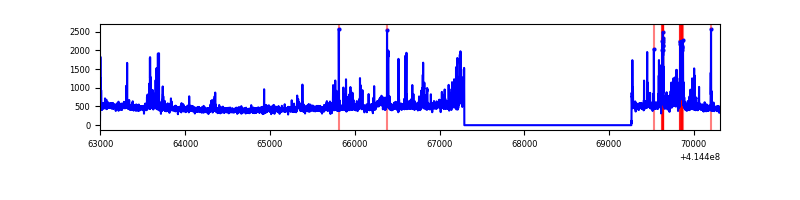 |
| C | 7314 | 5342 | 32 | 32 | 0.44% | 0.60% | 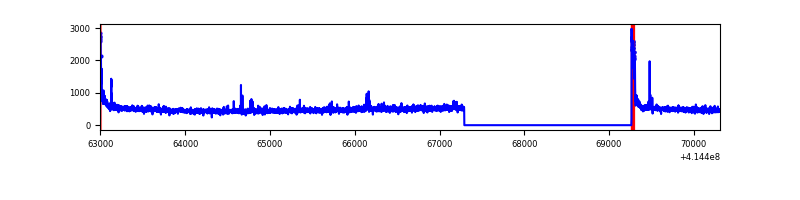 |
| D | 7314 | 5342 | 103 | 103 | 1.41% | 1.93% | 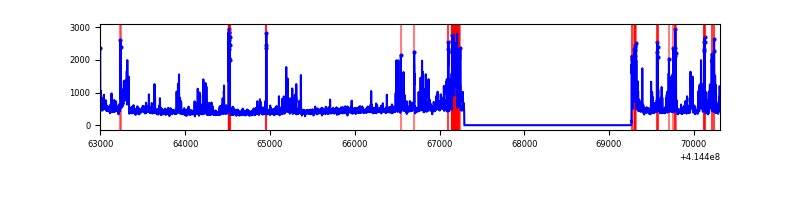 |
Top three noisy pixels from each quadrant. If the there are fewer than three noisy pixels in the level2.evt file, extra rows are filled as -1
| Pixel properties | Quadrant properties | ||||||
|---|---|---|---|---|---|---|---|
| Quadrant | DetID | PixID | Counts | Sigma | Mean | Median | Sigma |
| A | 10 | 83 | 451647 | 3690.1 | 602 | 591 | 122.2 |
| A | 6 | 10 | 109824 | 893.64 | 602 | 591 | 122.2 |
| A | 13 | 254 | 10977 | 84.97 | 602 | 591 | 122.2 |
| B | 4 | 171 | 358539 | 3077.14 | 606 | 591 | 116.3 |
| B | 5 | 255 | 31672 | 267.19 | 606 | 591 | 116.3 |
| B | 0 | 221 | 16098 | 133.31 | 606 | 591 | 116.3 |
| C | 15 | 214 | 223296 | 1619.69 | 591 | 596 | 137.5 |
| C | 0 | 10 | 130455 | 944.46 | 591 | 596 | 137.5 |
| C | 14 | 254 | 23667 | 167.79 | 591 | 596 | 137.5 |
| D | 2 | 250 | 269959 | 1901.81 | 577 | 561 | 141.7 |
| D | 13 | 171 | 194212 | 1367.08 | 577 | 561 | 141.7 |
| D | 1 | 47 | 115594 | 812.07 | 577 | 561 | 141.7 |
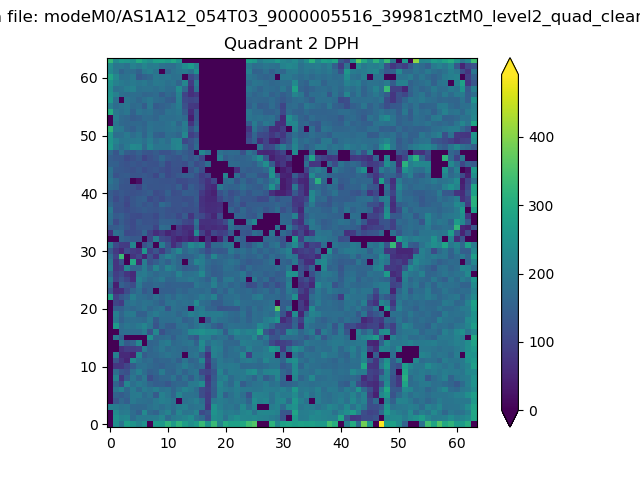
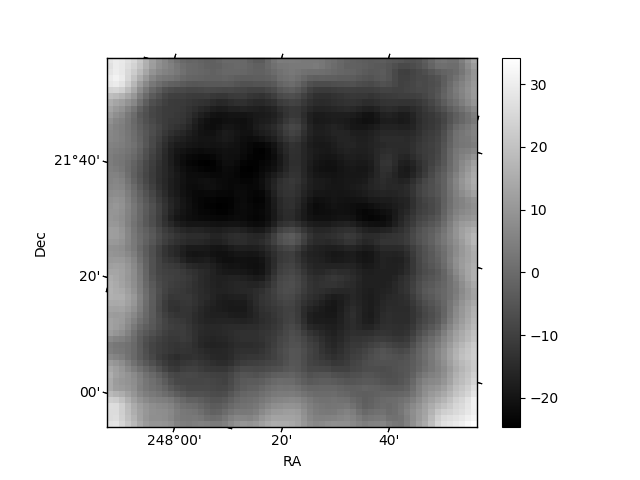
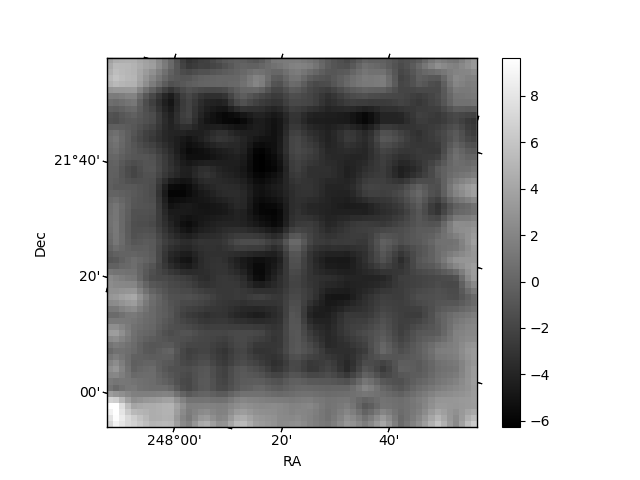
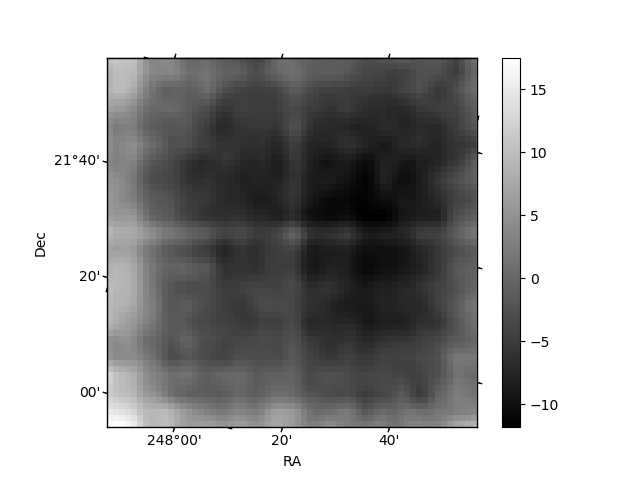
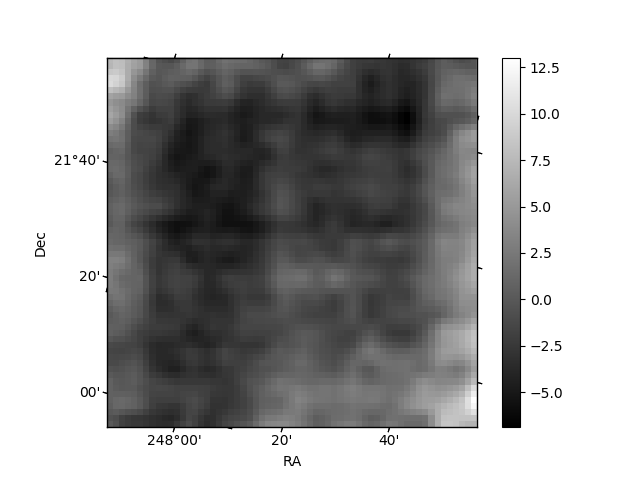
Histogram calculated using DETX and DETY for each event in the final _common_clean file
| Quadrant A | 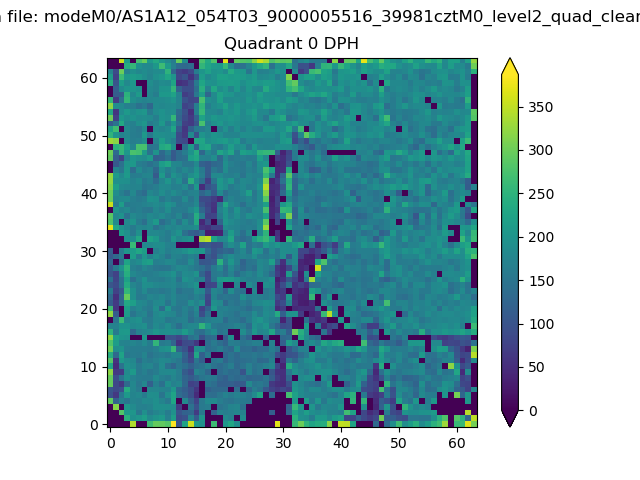 |
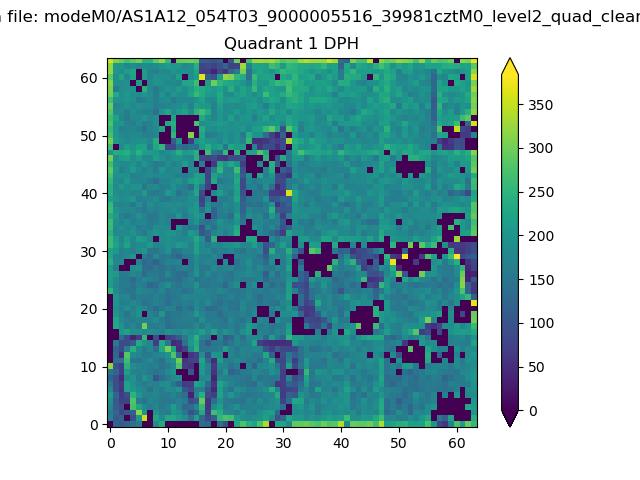 |
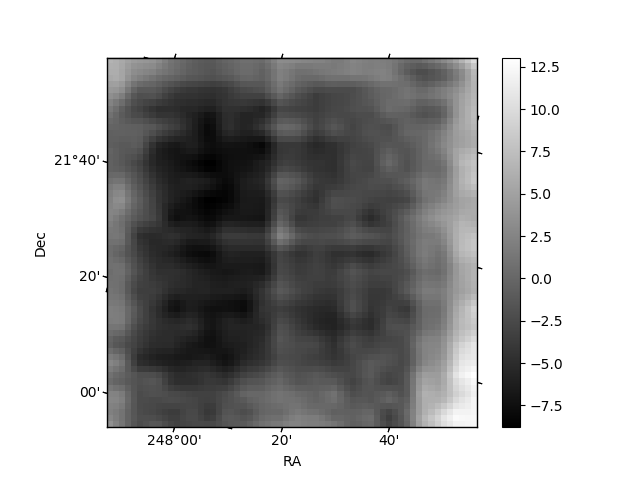
Quadrant B |
|---|---|---|---|
| Quadrant D | 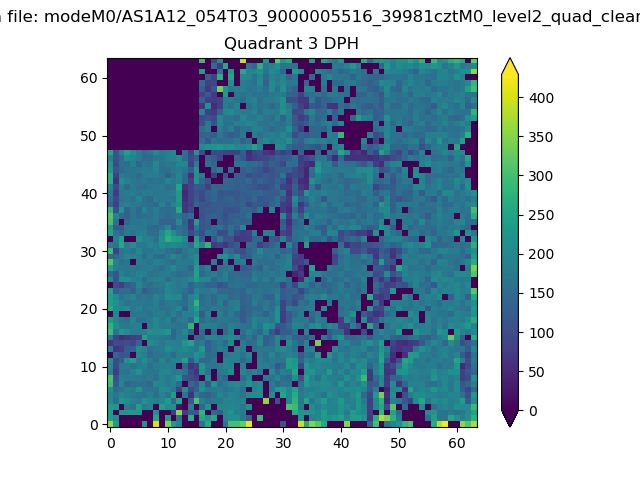 |
 |
Quadrant C |
| Plot type | Count rate plots | Images |
|---|---|---|
| Comparison with Poisson distribution Blue bars denote a histogram of data divided into 1 sec bins. Red curve is a Poisson curve with rate = median count rate of data. |
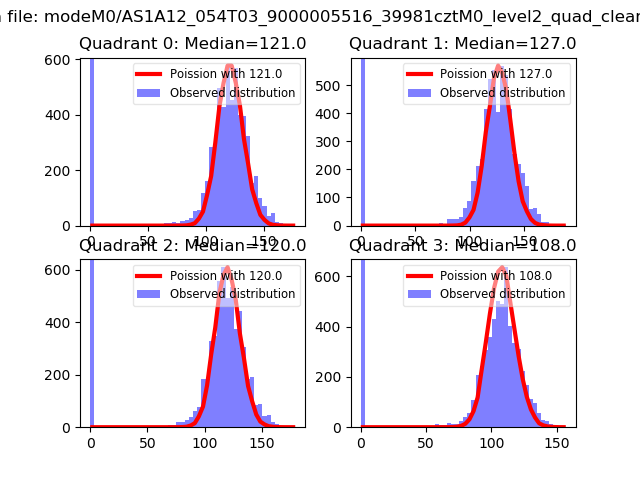 |
 |
| Quadrant-wise count rates Data is divided into 100 sec bins |
 |
|
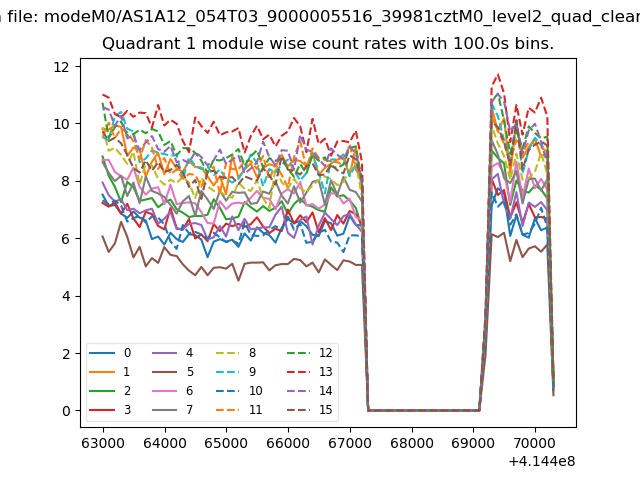
| Module-wise count rates for Quadrant A Data is divided into 100 sec bins |
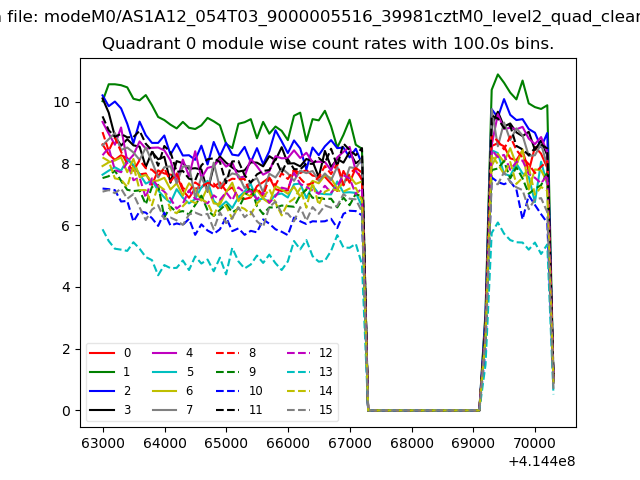 |
 |
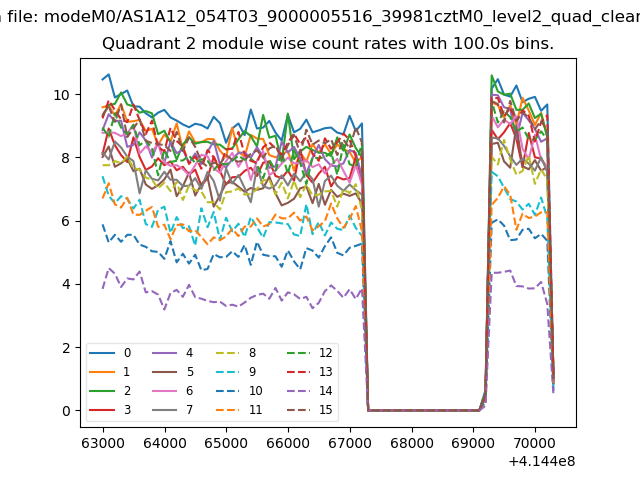
| Module-wise count rates for Quadrant B Data is divided into 100 sec bins |
 |
 |
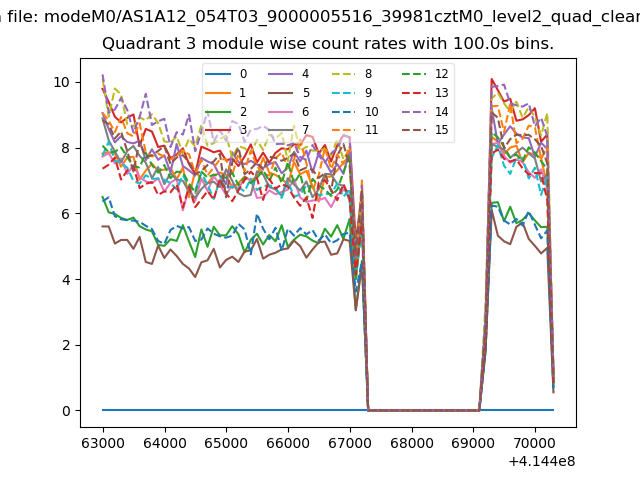
| Module-wise count rates for Quadrant C Data is divided into 100 sec bins |
 |
 |
| Module-wise count rates for Quadrant D Data is divided into 100 sec bins |
 |
 |
| Parameter | Plot |
|---|---|
| CZT HV Monitor | 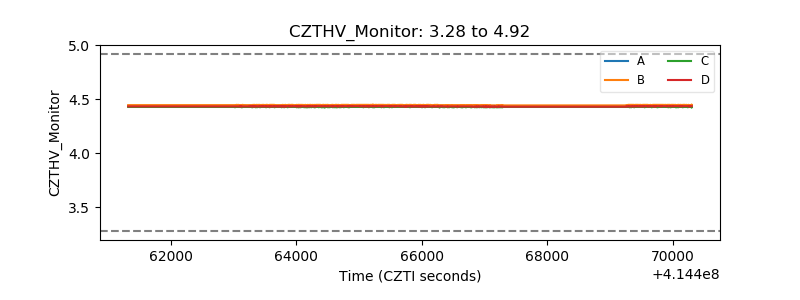 |
| D_VDD | 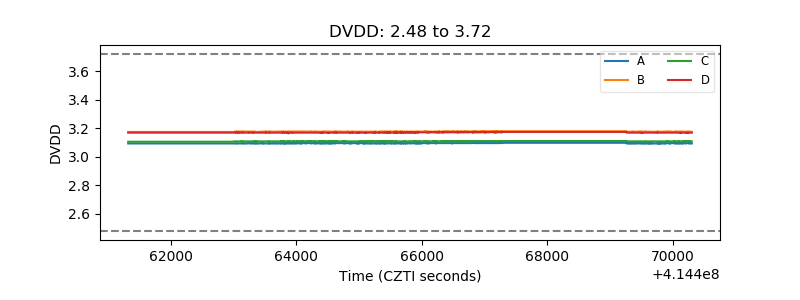 |
| Temperature 1 | 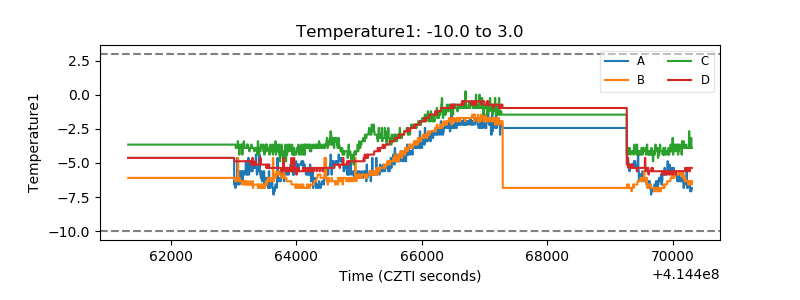 |
| Veto HV Monitor | 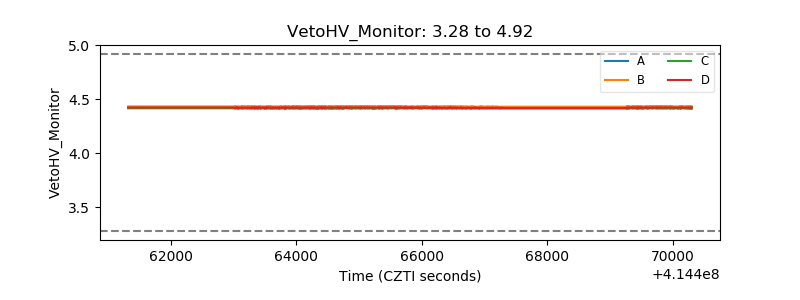 |
| Veto LLD | 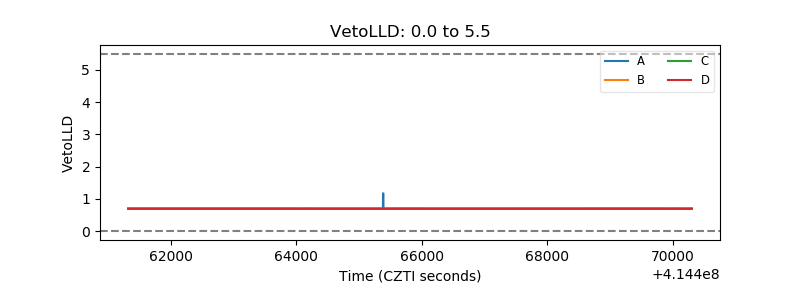 |
| Alpha Counter | 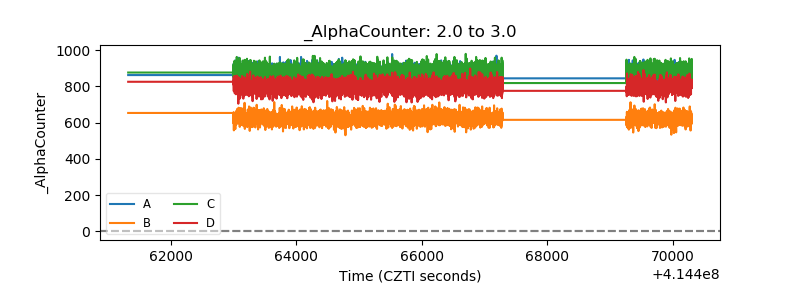 |
| _CPM_Rate | 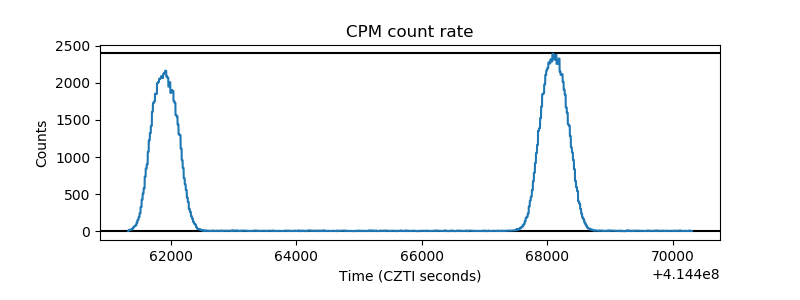 |
| CZT Counter | 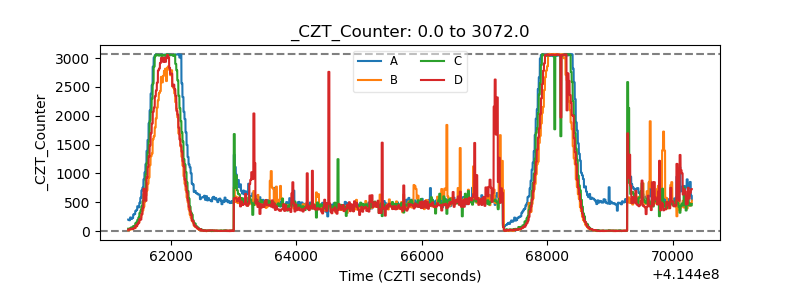 |
| +2.5 Volts monitor | 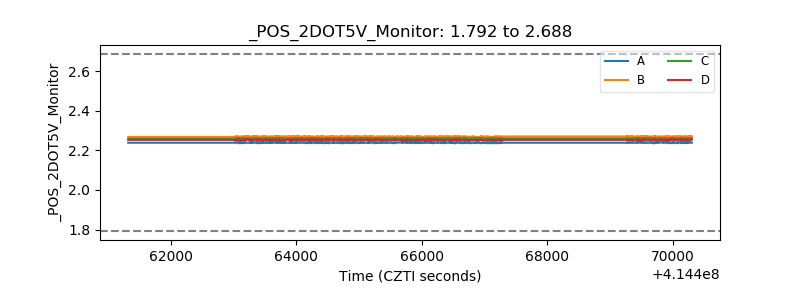 |
| +5 Volts monitor |  |
| _ROLL_ROT | 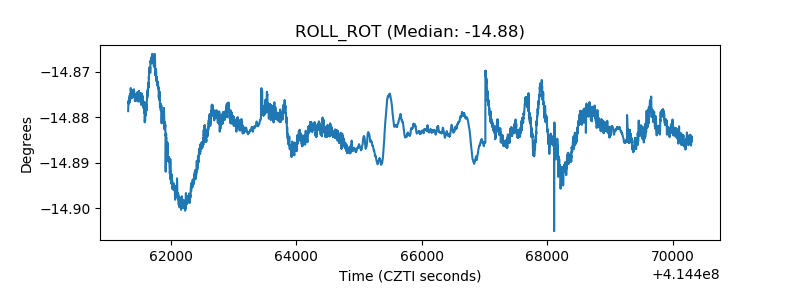 |
| _Roll_DEC | 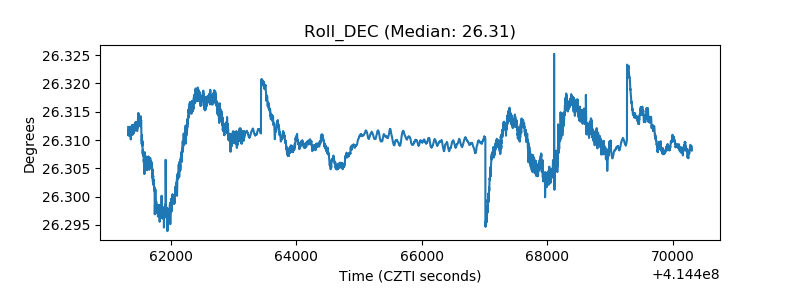 |
| _Roll_RA | 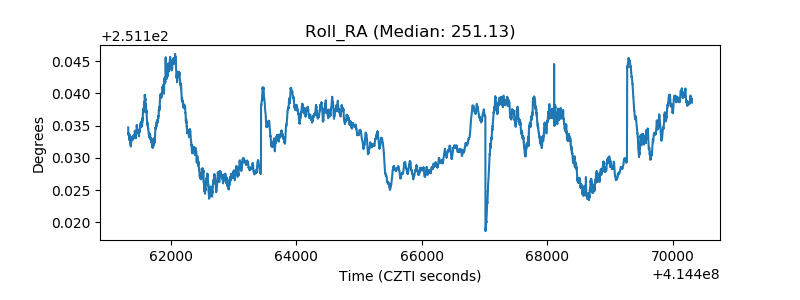 |
| Veto Counter | 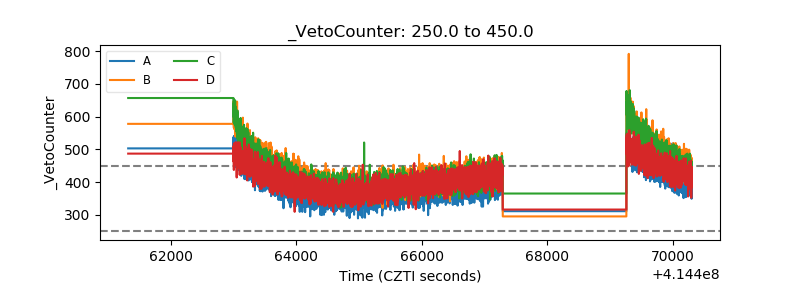 |