| Param | Original file | Final file |
|---|---|---|
| Filename | modeM0/AS1A12_054T03_9000005516_39982cztM0_level2.fits | modeM0/AS1A12_054T03_9000005516_39982cztM0_level2_quad_clean.evt |
| Size (bytes) | 354,539,520 | 95,676,480 |
| Size | 338.1 MB | 91.2 MB |
| Events in quadrant A | 3,168,166 | 655,222 |
| Events in quadrant B | 2,912,625 | 679,755 |
| Events in quadrant C | 2,738,905 | 640,760 |
| Events in quadrant D | 3,890,550 | 549,061 |
| Mode M9 | |||
|---|---|---|---|
| Quadrant | BADHDUFLAG | Total packets | Discarded packets |
| A | 0 | 31 | 0 |
| B | 0 | 31 | 0 |
| C | 0 | 31 | 0 |
| D | 0 | 32 | 0 |
| Mode SS | |||
|---|---|---|---|
| Quadrant | BADHDUFLAG | Total packets | Discarded packets |
| A | 0 | 110 | 0 |
| B | 0 | 110 | 0 |
| C | 0 | 110 | 0 |
| D | 0 | 110 | 0 |
| Mode M0 | |||
|---|---|---|---|
| Quadrant | BADHDUFLAG | Total packets | Discarded packets |
| A | 0 | 12762 | 3 |
| B | 0 | 12104 | 2 |
| C | 0 | 11348 | 2 |
| D | 0 | 15266 | 2 |
| Quadrant | Total seconds | Saturated seconds | Saturation percentage |
|---|---|---|---|
| A | 5313 | 31 | 0.583474% |
| B | 5313 | 82 | 1.543384% |
| C | 5313 | 48 | 0.903444% |
| D | 5313 | 423 | 7.961604% |
Noise dominated data is calculated using 1-second bins in cleaned event files. If a bin has >2000 counts, and if more than 50% of those come from <1% of pixels, then it is considered to be noise-dominated and hence unusable.
| Quadrant | # 1 sec bins | Bins with >0 counts | Bins with >2000 counts | High rate bins dominated by noise | Noise dominated (total time) | Noise dominated (detector-on time) | Marked lightcurve |
|---|---|---|---|---|---|---|---|
| A | 7375 | 5314 | 28 | 28 | 0.38% | 0.53% | 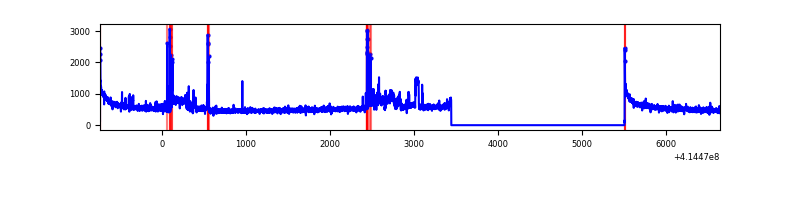 |
| B | 7375 | 5314 | 57 | 57 | 0.77% | 1.07% | 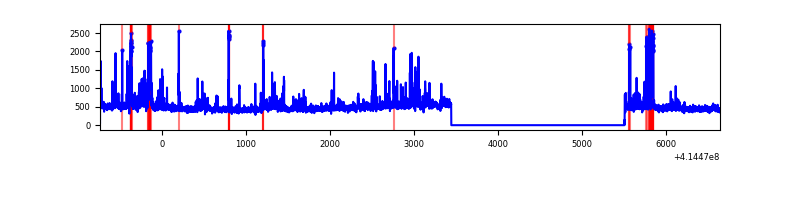 |
| C | 7375 | 5314 | 47 | 47 | 0.64% | 0.88% | 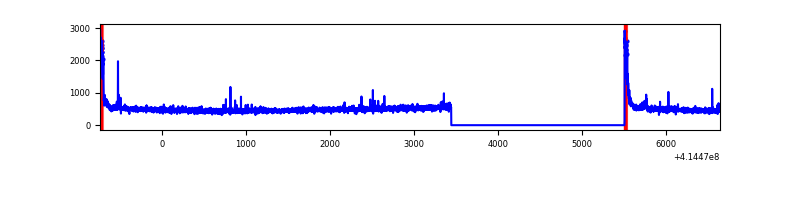 |
| D | 7375 | 5314 | 419 | 419 | 5.68% | 7.88% | 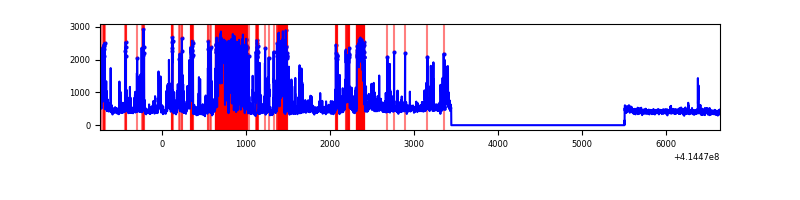 |
Top three noisy pixels from each quadrant. If the there are fewer than three noisy pixels in the level2.evt file, extra rows are filled as -1
| Pixel properties | Quadrant properties | ||||||
|---|---|---|---|---|---|---|---|
| Quadrant | DetID | PixID | Counts | Sigma | Mean | Median | Sigma |
| A | 10 | 83 | 456607 | 3696.89 | 609 | 601 | 123.3 |
| A | 6 | 10 | 326288 | 2640.38 | 609 | 601 | 123.3 |
| A | 13 | 248 | 21846 | 172.24 | 609 | 601 | 123.3 |
| B | 4 | 171 | 402653 | 3427.79 | 610 | 594 | 117.3 |
| B | 5 | 255 | 57188 | 482.5 | 610 | 594 | 117.3 |
| B | 0 | 221 | 23456 | 194.91 | 610 | 594 | 117.3 |
| C | 15 | 214 | 221061 | 1612.87 | 594 | 601 | 136.7 |
| C | 0 | 10 | 164394 | 1198.3 | 594 | 601 | 136.7 |
| C | 14 | 254 | 20032 | 142.16 | 594 | 601 | 136.7 |
| D | 13 | 171 | 1427442 | 10334.74 | 572 | 555 | 138.1 |
| D | 2 | 250 | 117561 | 847.45 | 572 | 555 | 138.1 |
| D | 13 | 249 | 40083 | 286.29 | 572 | 555 | 138.1 |
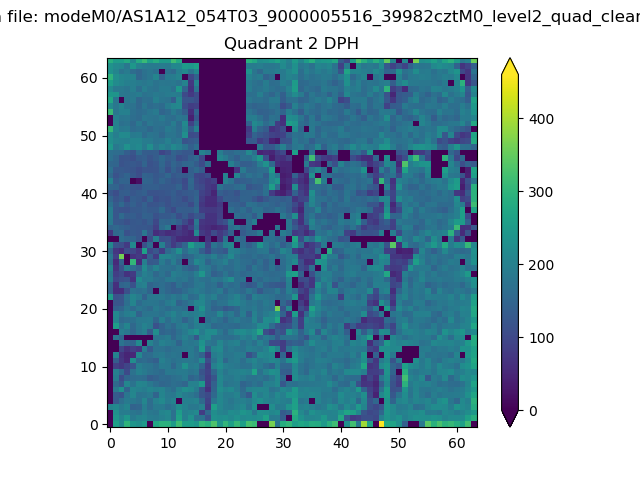
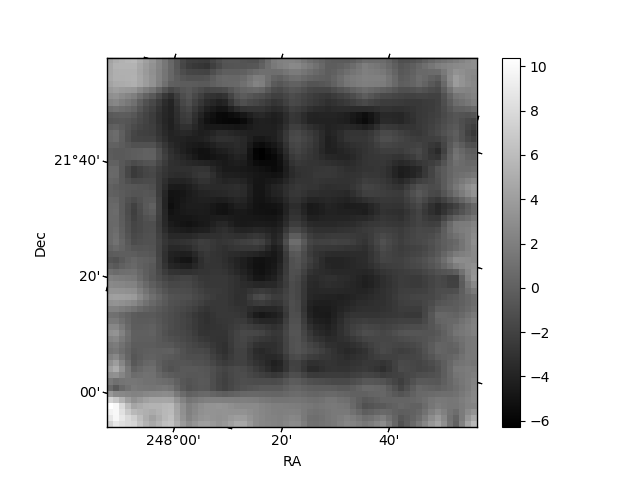
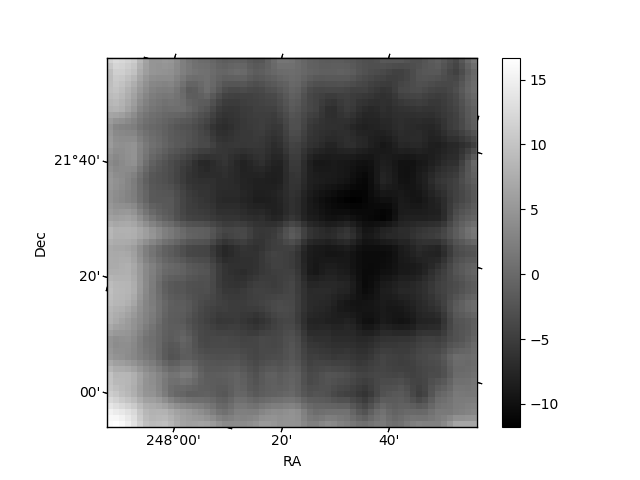
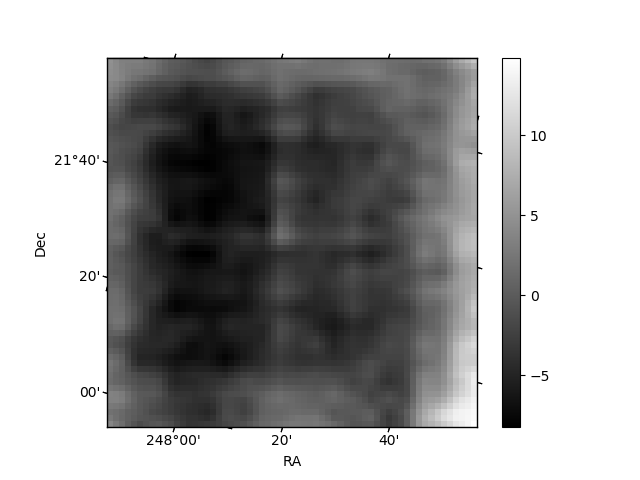
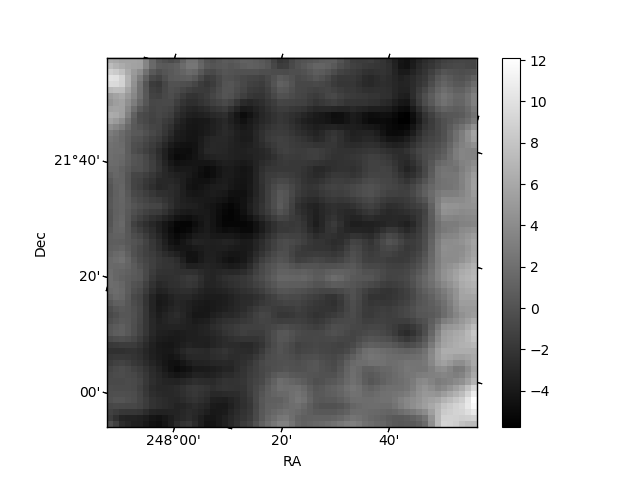
Histogram calculated using DETX and DETY for each event in the final _common_clean file
| Quadrant A | 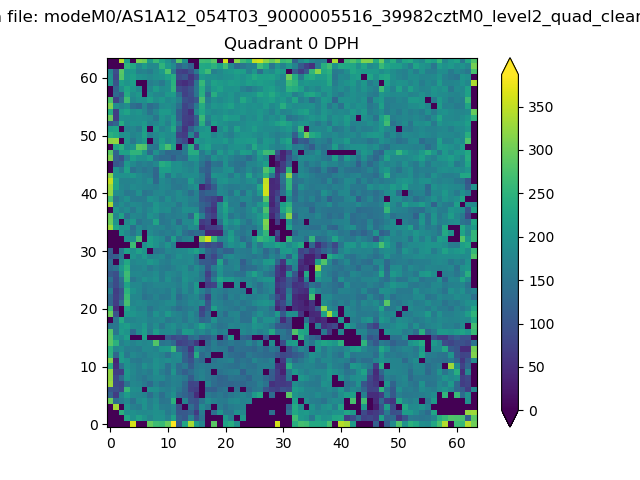 |
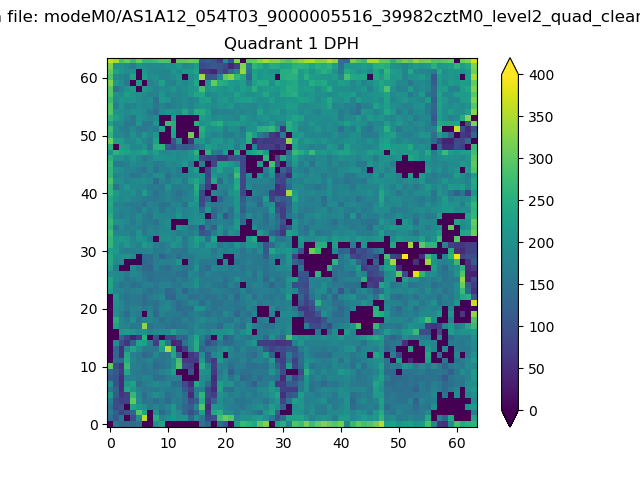 |
Quadrant B |
|---|---|---|---|
| Quadrant D | 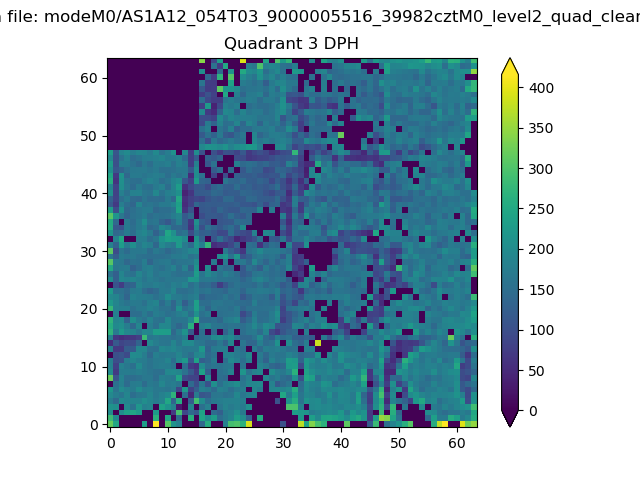 |
 |
Quadrant C |
| Plot type | Count rate plots | Images |
|---|---|---|
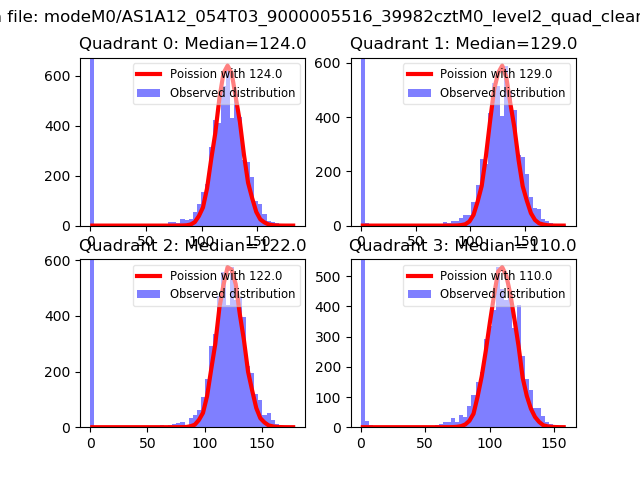
| Comparison with Poisson distribution Blue bars denote a histogram of data divided into 1 sec bins. Red curve is a Poisson curve with rate = median count rate of data. |
 |
 |
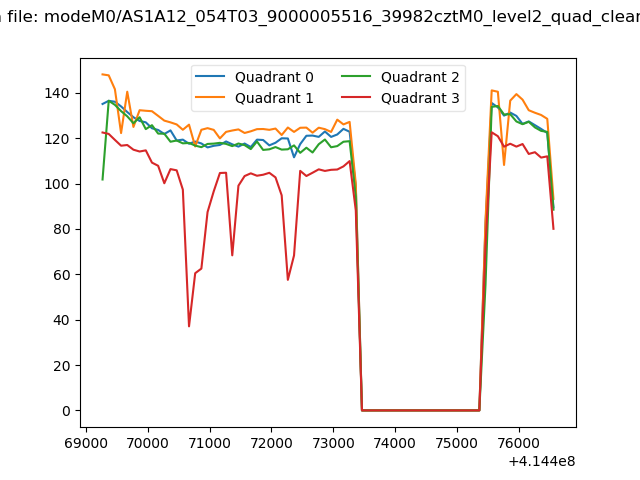
| Quadrant-wise count rates Data is divided into 100 sec bins |
 |
|
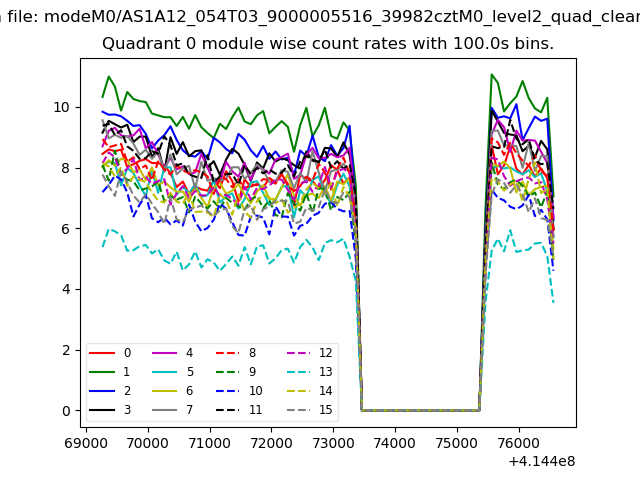
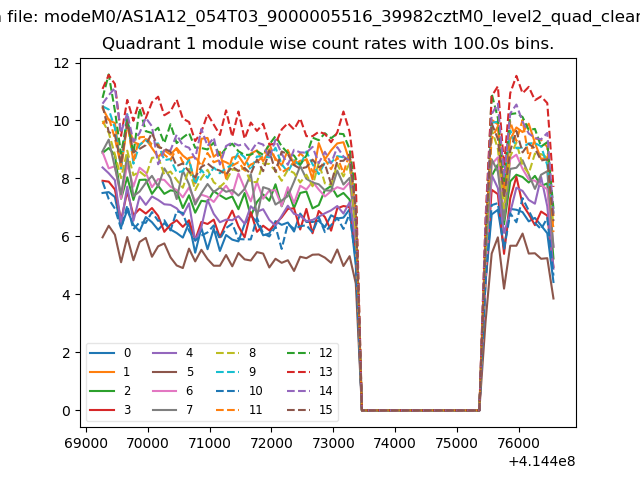
| Module-wise count rates for Quadrant A Data is divided into 100 sec bins |
 |
 |
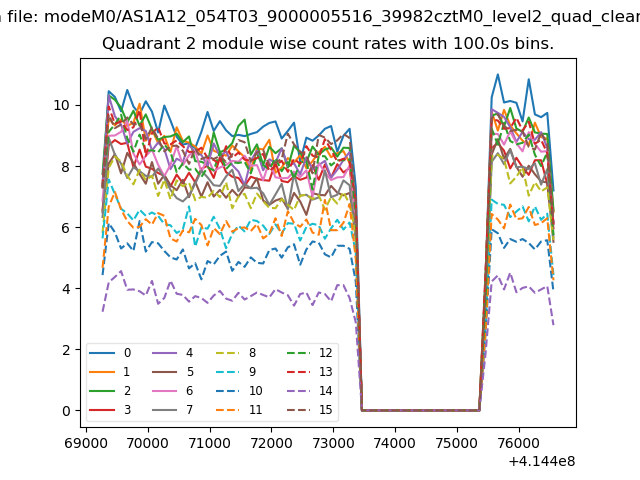
| Module-wise count rates for Quadrant B Data is divided into 100 sec bins |
 |
 |
| Module-wise count rates for Quadrant C Data is divided into 100 sec bins |
 |
 |
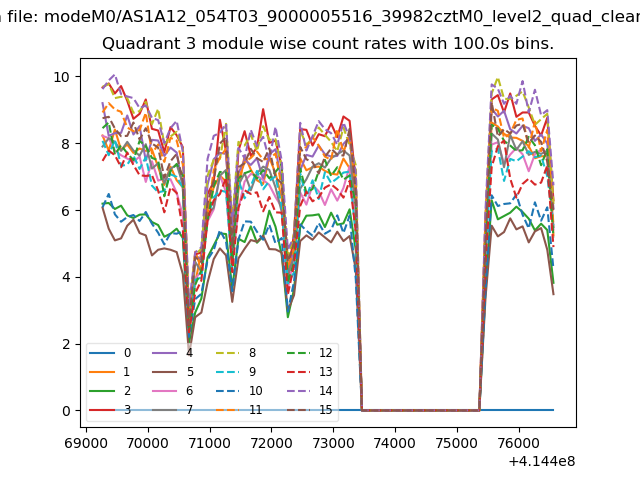
| Module-wise count rates for Quadrant D Data is divided into 100 sec bins |
 |
 |
| Parameter | Plot |
|---|---|
| CZT HV Monitor | 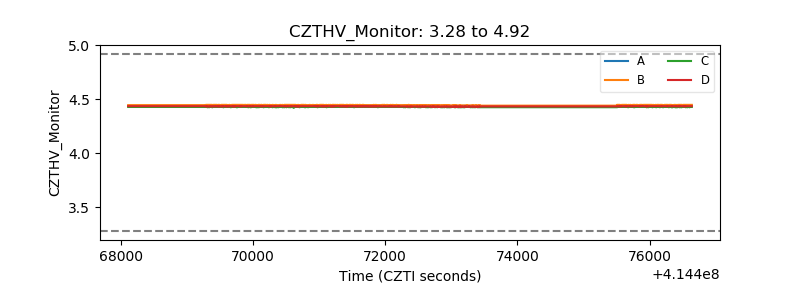 |
| D_VDD | 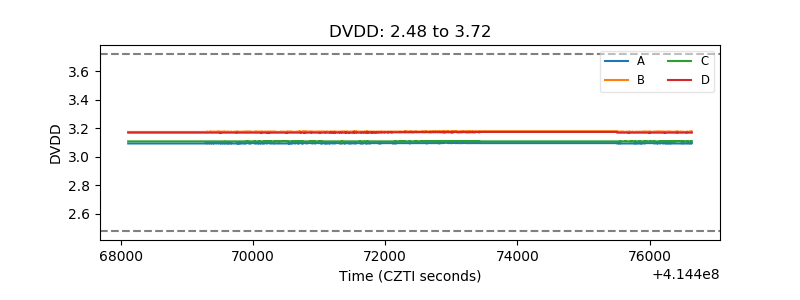 |
| Temperature 1 | 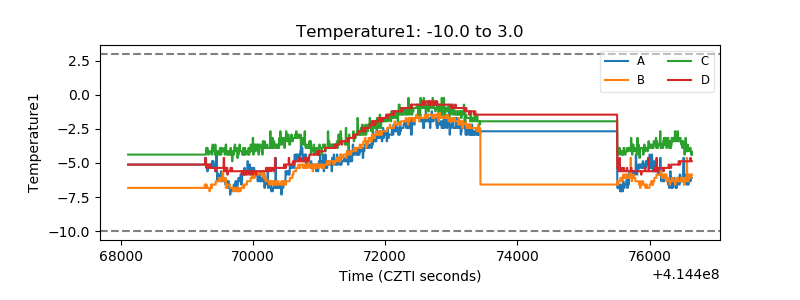 |
| Veto HV Monitor | 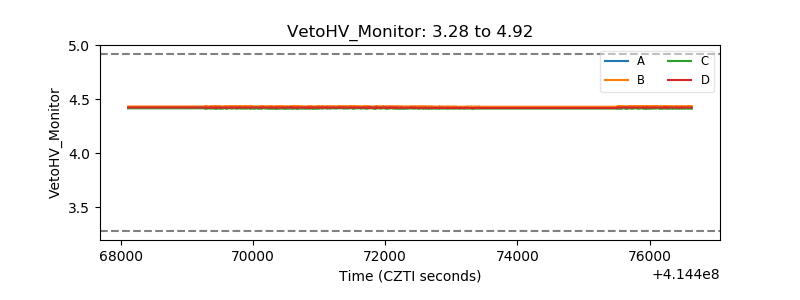 |
| Veto LLD | 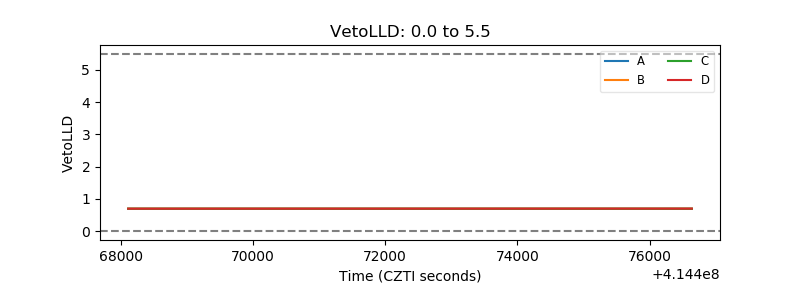 |
| Alpha Counter | 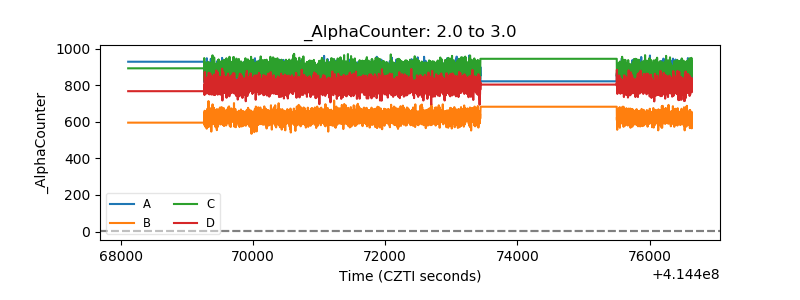 |
| _CPM_Rate | 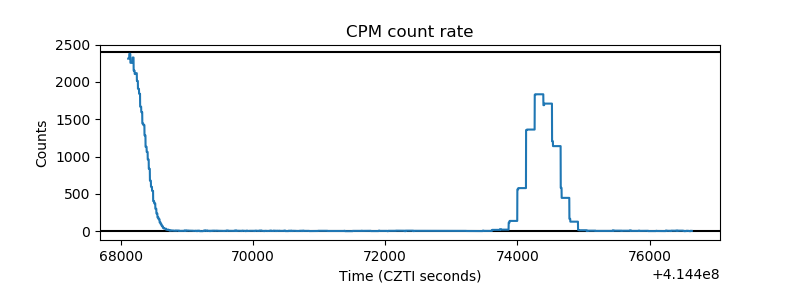 |
| CZT Counter | 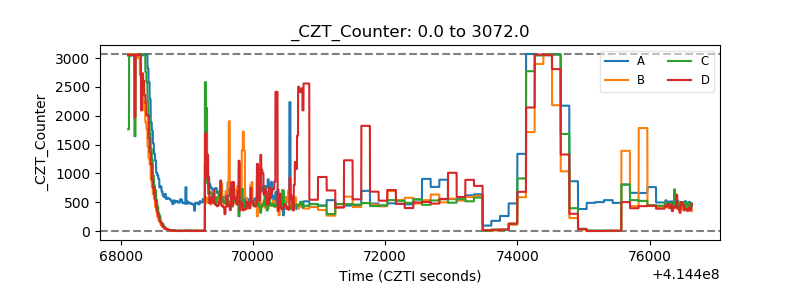 |
| +2.5 Volts monitor | 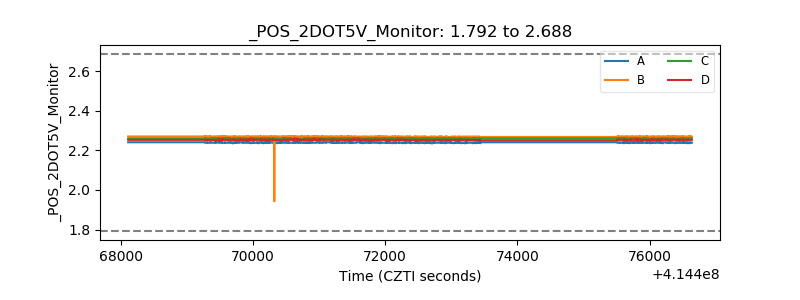 |
| +5 Volts monitor | 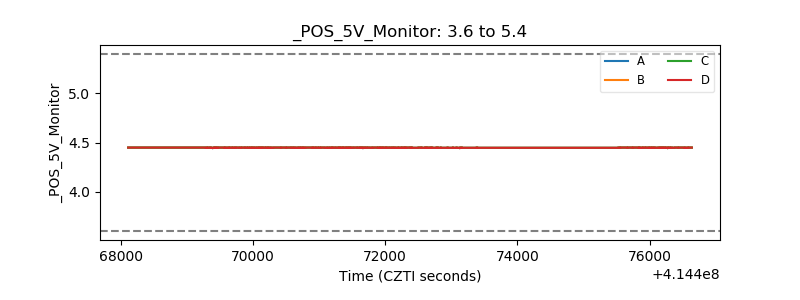 |
| _ROLL_ROT | 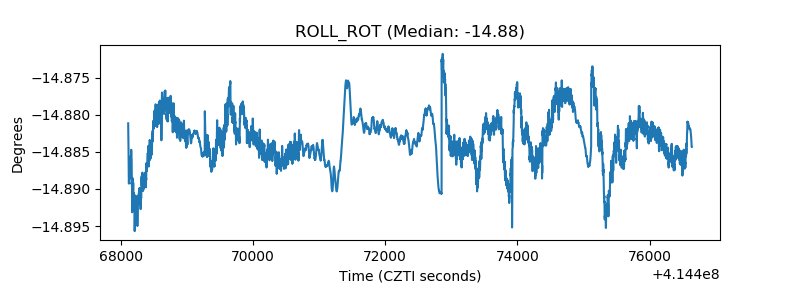 |
| _Roll_DEC | 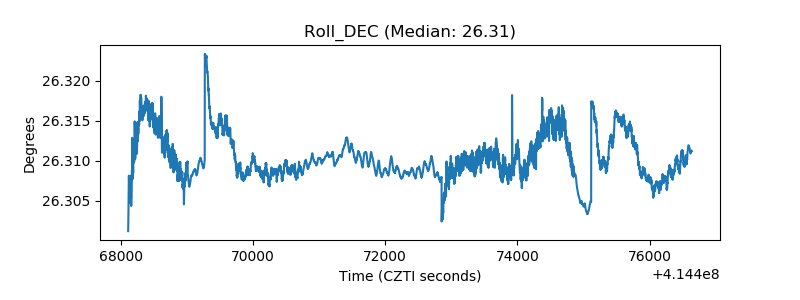 |
| _Roll_RA | 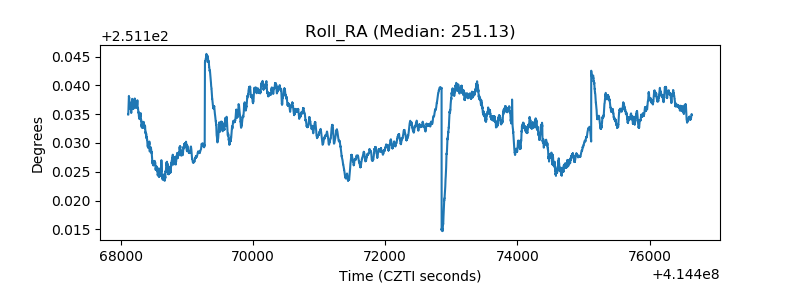 |
| Veto Counter | 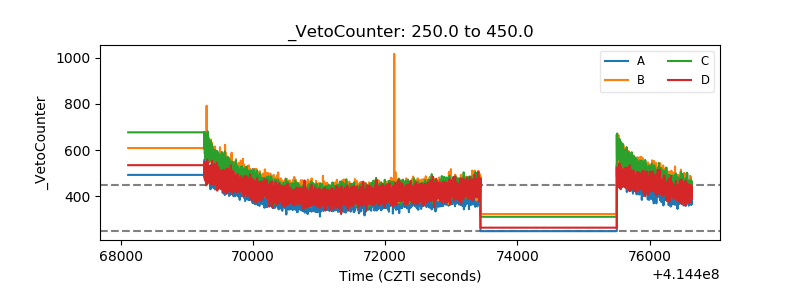 |