| Param | Original file | Final file |
|---|---|---|
| Filename | modeM0/AS1A12_054T03_9000005516_39983cztM0_level2.fits | modeM0/AS1A12_054T03_9000005516_39983cztM0_level2_quad_clean.evt |
| Size (bytes) | 294,261,120 | 93,358,080 |
| Size | 280.6 MB | 89.0 MB |
| Events in quadrant A | 2,789,444 | 630,469 |
| Events in quadrant B | 2,596,289 | 651,873 |
| Events in quadrant C | 2,669,812 | 616,988 |
| Events in quadrant D | 2,433,857 | 565,471 |
| Mode M9 | |||
|---|---|---|---|
| Quadrant | BADHDUFLAG | Total packets | Discarded packets |
| A | 0 | 24 | 0 |
| B | 0 | 24 | 0 |
| C | 0 | 24 | 0 |
| D | 0 | 25 | 0 |
| Mode SS | |||
|---|---|---|---|
| Quadrant | BADHDUFLAG | Total packets | Discarded packets |
| A | 0 | 106 | 0 |
| B | 0 | 106 | 0 |
| C | 0 | 106 | 0 |
| D | 0 | 106 | 0 |
| Mode M0 | |||
|---|---|---|---|
| Quadrant | BADHDUFLAG | Total packets | Discarded packets |
| A | 0 | 11367 | 3 |
| B | 0 | 11051 | 2 |
| C | 0 | 11048 | 2 |
| D | 0 | 10831 | 2 |
| Quadrant | Total seconds | Saturated seconds | Saturation percentage |
|---|---|---|---|
| A | 5169 | 10 | 0.193461% |
| B | 5169 | 54 | 1.044689% |
| C | 5169 | 46 | 0.889921% |
| D | 5169 | 10 | 0.193461% |
Noise dominated data is calculated using 1-second bins in cleaned event files. If a bin has >2000 counts, and if more than 50% of those come from <1% of pixels, then it is considered to be noise-dominated and hence unusable.
| Quadrant | # 1 sec bins | Bins with >0 counts | Bins with >2000 counts | High rate bins dominated by noise | Noise dominated (total time) | Noise dominated (detector-on time) | Marked lightcurve |
|---|---|---|---|---|---|---|---|
| A | 7291 | 5170 | 8 | 8 | 0.11% | 0.15% | 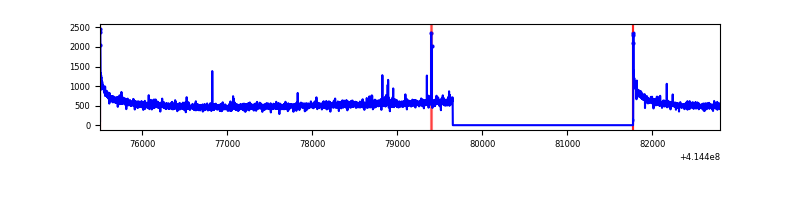 |
| B | 7291 | 5170 | 49 | 49 | 0.67% | 0.95% | 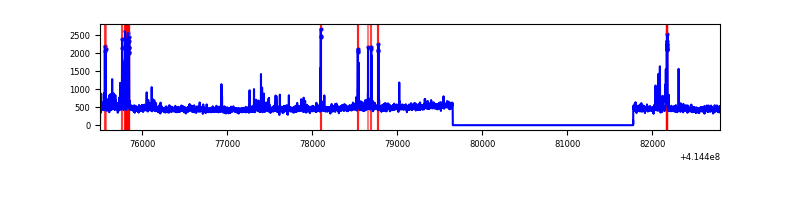 |
| C | 7291 | 5170 | 48 | 48 | 0.66% | 0.93% | 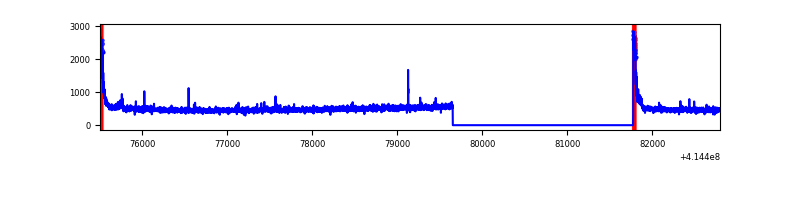 |
| D | 7291 | 5170 | 10 | 10 | 0.14% | 0.19% | 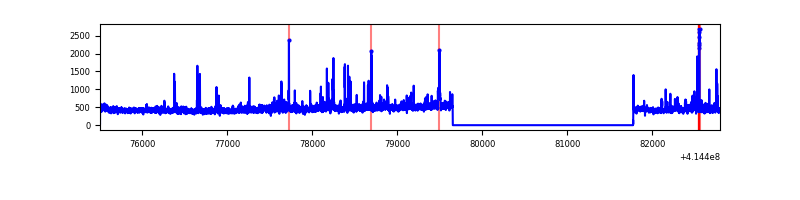 |
Top three noisy pixels from each quadrant. If the there are fewer than three noisy pixels in the level2.evt file, extra rows are filled as -1
| Pixel properties | Quadrant properties | ||||||
|---|---|---|---|---|---|---|---|
| Quadrant | DetID | PixID | Counts | Sigma | Mean | Median | Sigma |
| A | 10 | 83 | 458915 | 3809.72 | 594 | 584 | 120.3 |
| A | 13 | 248 | 13202 | 104.88 | 594 | 584 | 120.3 |
| A | 6 | 10 | 9778 | 76.42 | 594 | 584 | 120.3 |
| B | 4 | 171 | 200864 | 1777.8 | 590 | 575 | 112.7 |
| B | 5 | 255 | 36972 | 323.07 | 590 | 575 | 112.7 |
| B | 0 | 230 | 18049 | 155.1 | 590 | 575 | 112.7 |
| C | 15 | 214 | 215950 | 1629.11 | 577 | 583 | 132.2 |
| C | 0 | 10 | 171751 | 1294.77 | 577 | 583 | 132.2 |
| C | 10 | 20 | 9797 | 69.7 | 577 | 583 | 132.2 |
| D | 2 | 250 | 61385 | 428.36 | 576 | 559 | 142.0 |
| D | 13 | 171 | 31277 | 216.33 | 576 | 559 | 142.0 |
| D | 12 | 227 | 28678 | 198.03 | 576 | 559 | 142.0 |
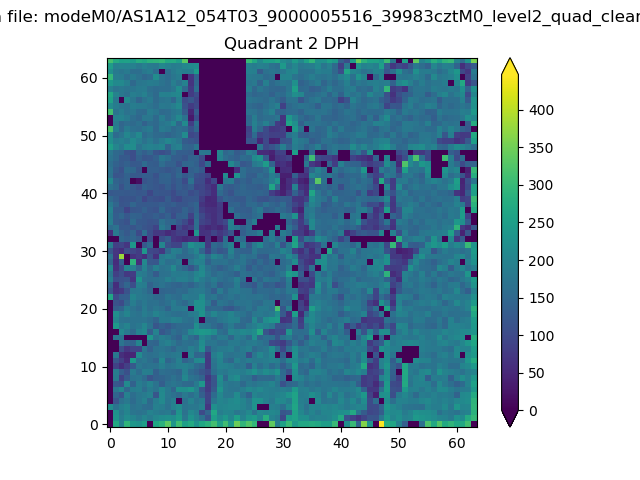
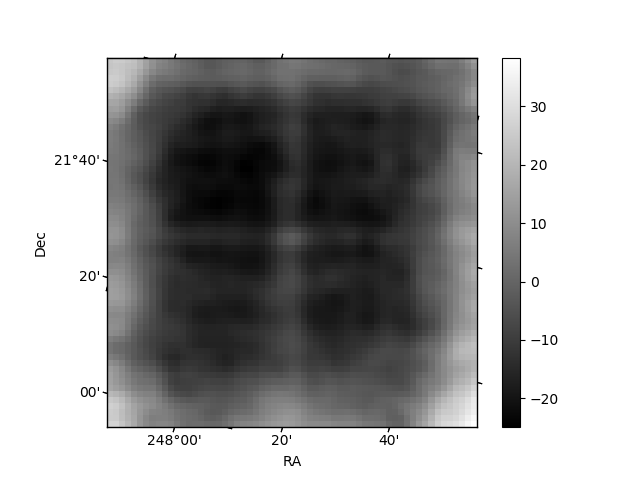
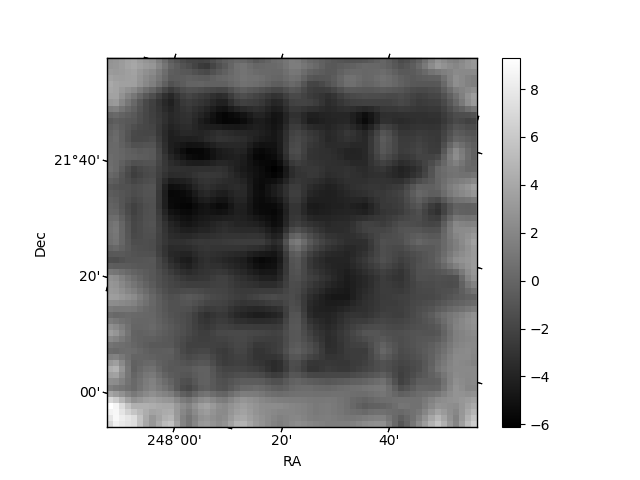
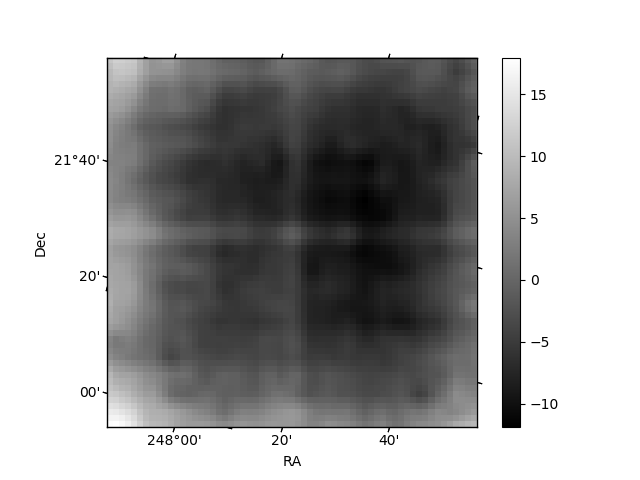
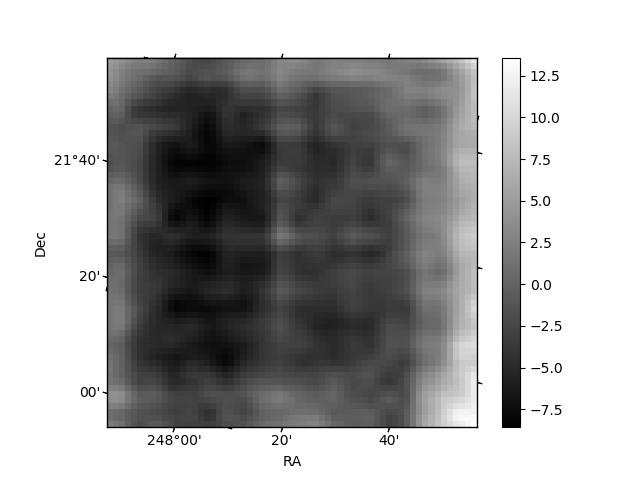
Histogram calculated using DETX and DETY for each event in the final _common_clean file
| Quadrant A | 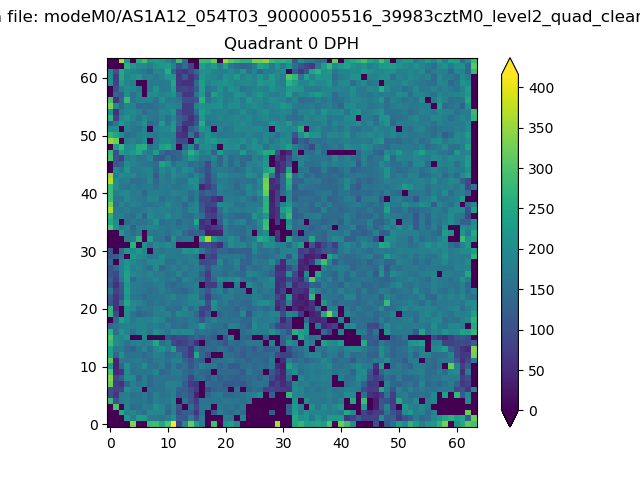 |
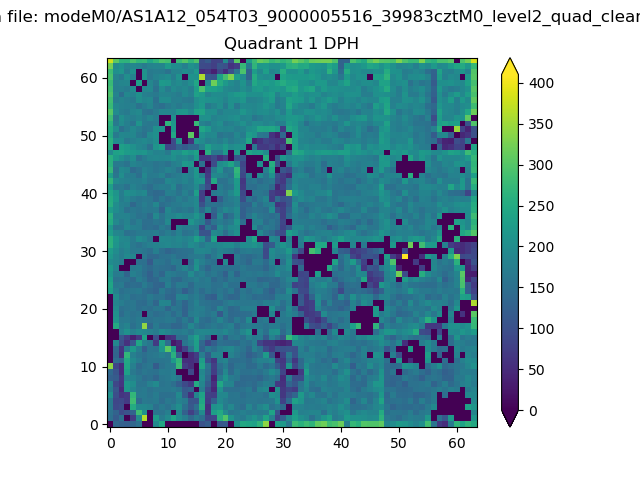 |
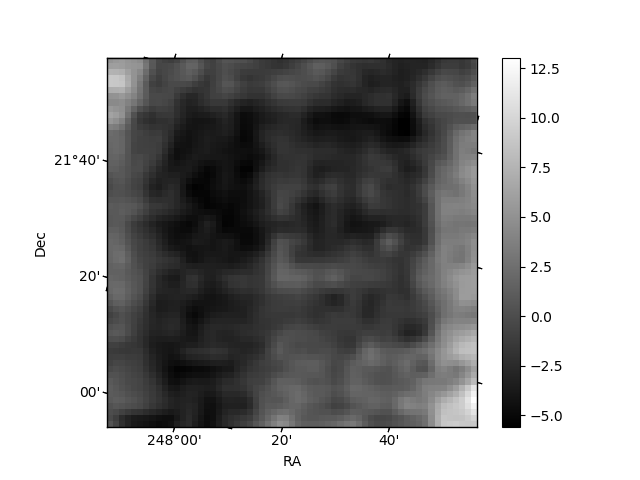
Quadrant B |
|---|---|---|---|
| Quadrant D | 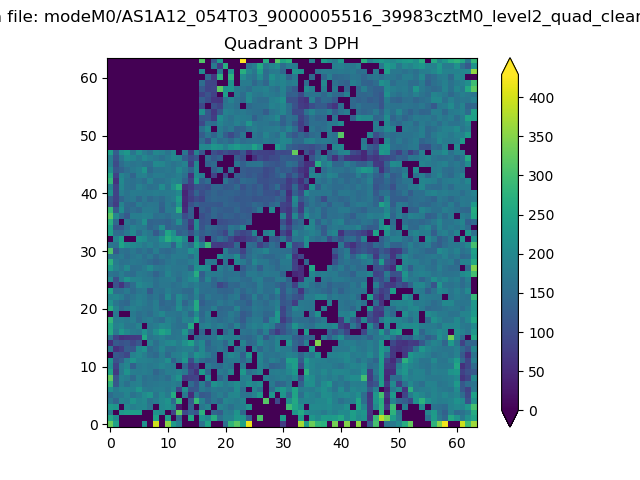 |
 |
Quadrant C |
| Plot type | Count rate plots | Images |
|---|---|---|
| Comparison with Poisson distribution Blue bars denote a histogram of data divided into 1 sec bins. Red curve is a Poisson curve with rate = median count rate of data. |
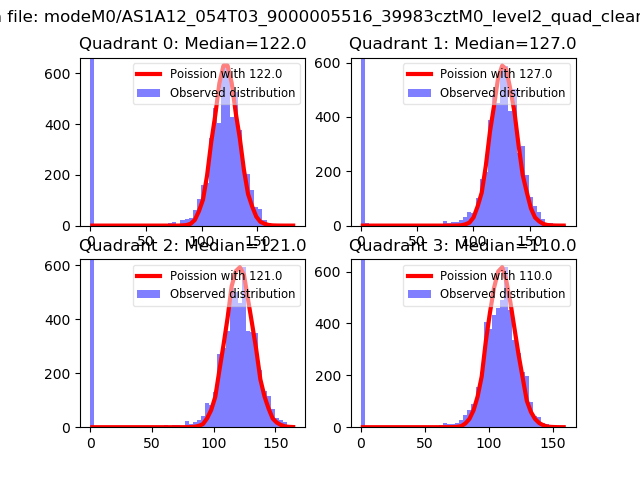 |
 |
| Quadrant-wise count rates Data is divided into 100 sec bins |
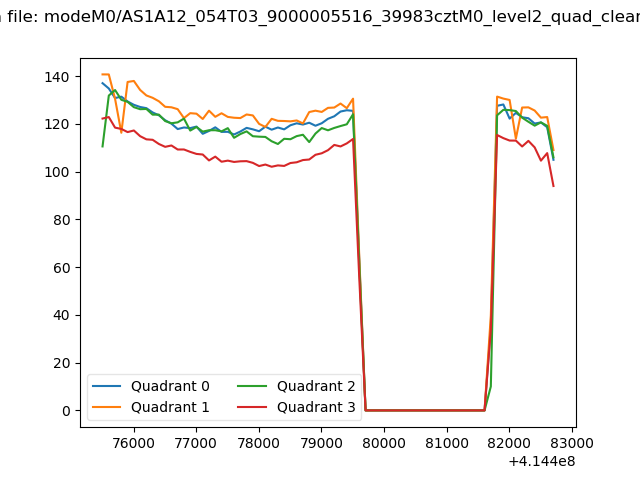 |
|
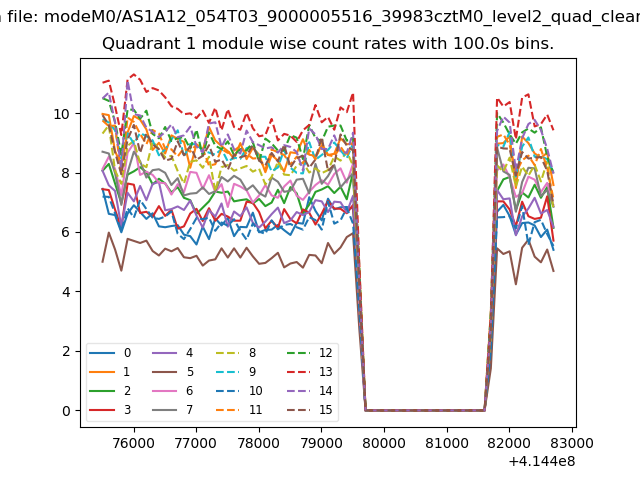
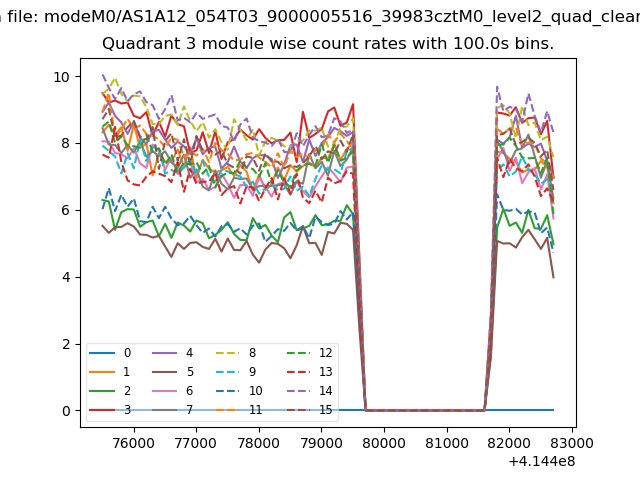
| Module-wise count rates for Quadrant A Data is divided into 100 sec bins |
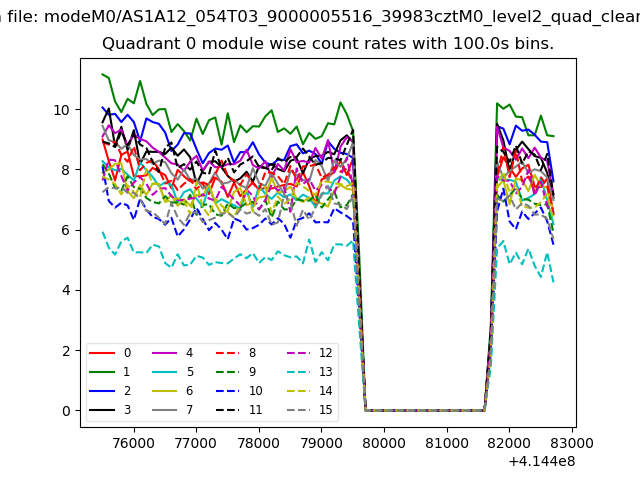 |
 |
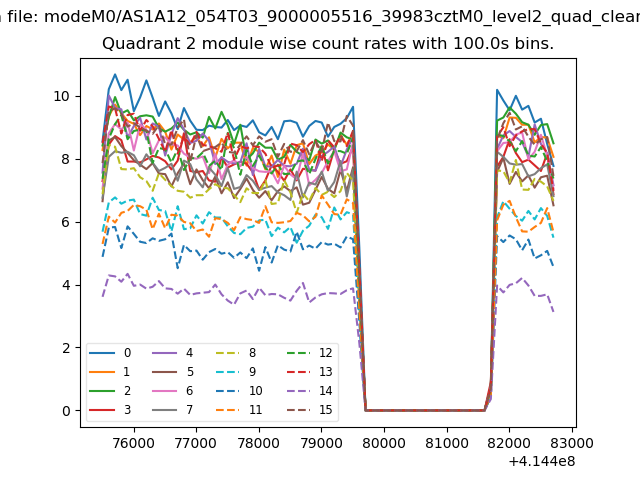
| Module-wise count rates for Quadrant B Data is divided into 100 sec bins |
 |
 |
| Module-wise count rates for Quadrant C Data is divided into 100 sec bins |
 |
 |
| Module-wise count rates for Quadrant D Data is divided into 100 sec bins |
 |
 |
| Parameter | Plot |
|---|---|
| CZT HV Monitor | 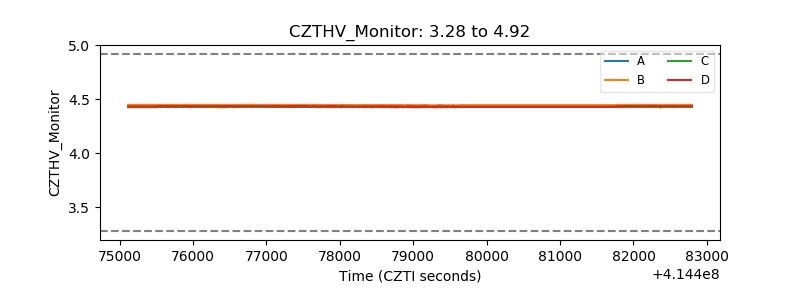 |
| D_VDD | 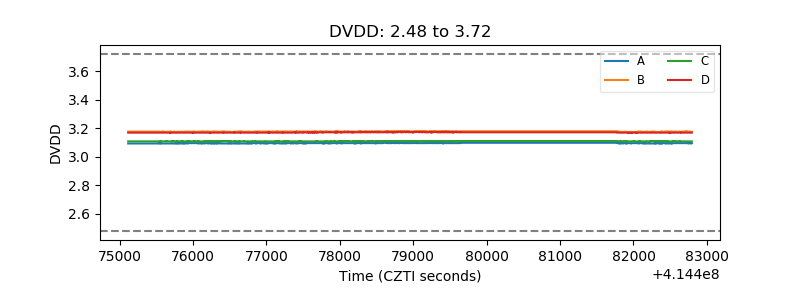 |
| Temperature 1 | 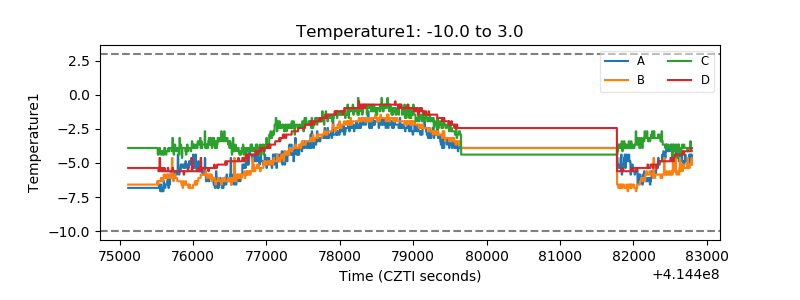 |
| Veto HV Monitor | 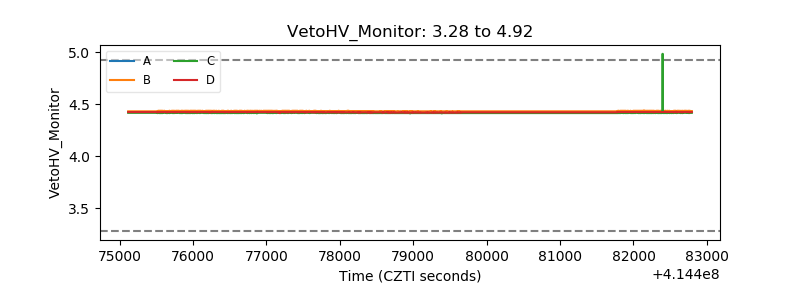 |
| Veto LLD | 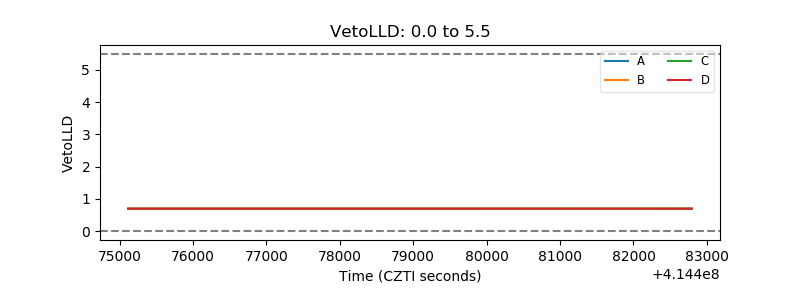 |
| Alpha Counter | 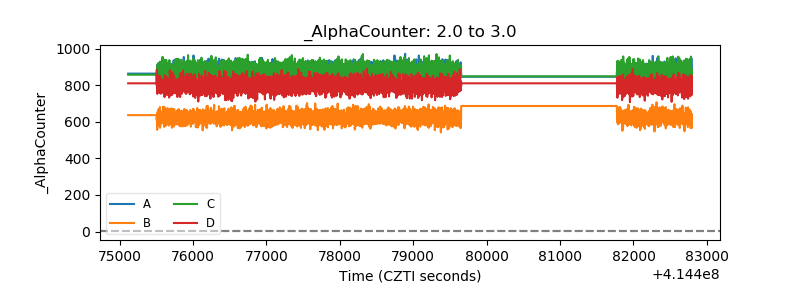 |
| _CPM_Rate | 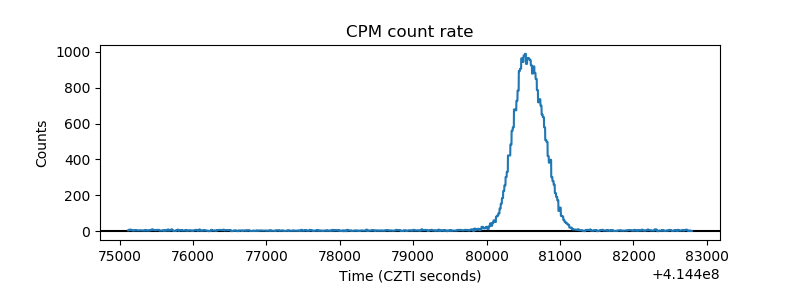 |
| CZT Counter | 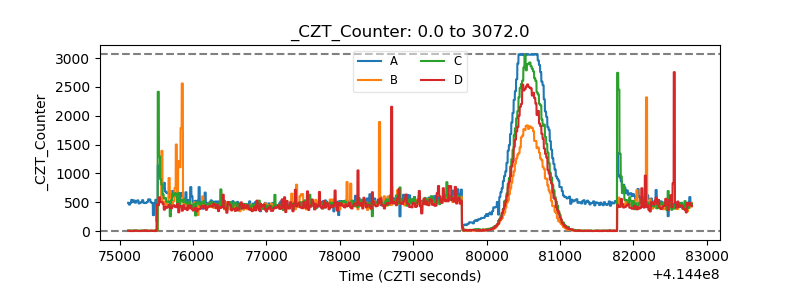 |
| +2.5 Volts monitor |  |
| +5 Volts monitor | 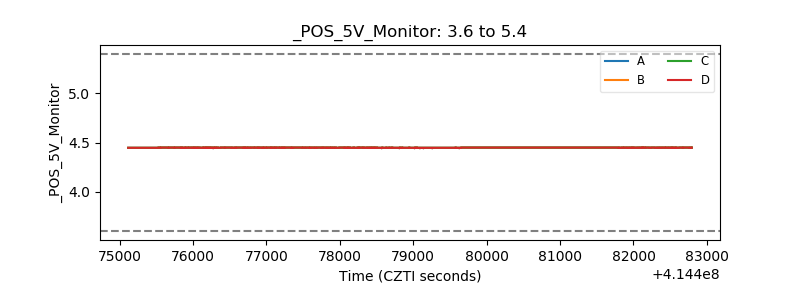 |
| _ROLL_ROT | 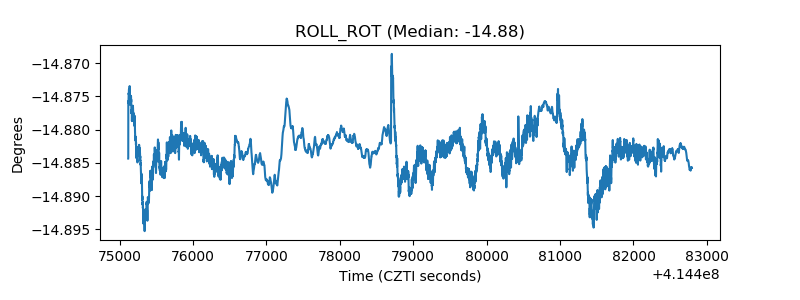 |
| _Roll_DEC | 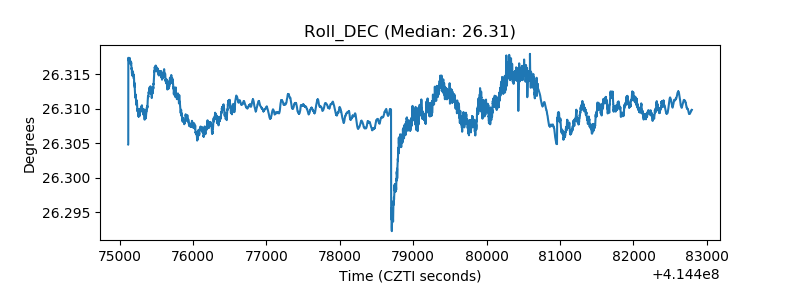 |
| _Roll_RA | 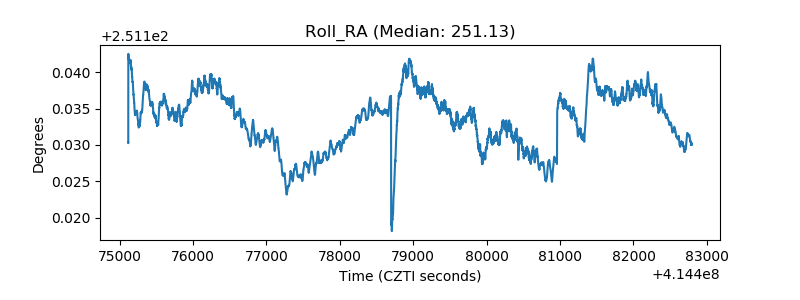 |
| Veto Counter | 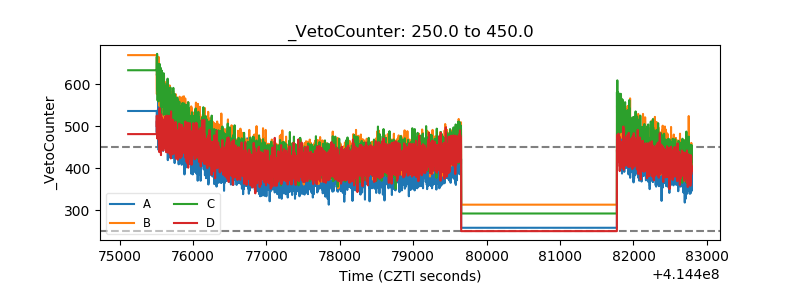 |