| Param | Original file | Final file |
|---|---|---|
| Filename | modeM0/AS1A12_054T03_9000005516_39984cztM0_level2.fits | modeM0/AS1A12_054T03_9000005516_39984cztM0_level2_quad_clean.evt |
| Size (bytes) | 300,925,440 | 88,309,440 |
| Size | 287.0 MB | 84.2 MB |
| Events in quadrant A | 2,823,727 | 595,680 |
| Events in quadrant B | 2,695,713 | 611,108 |
| Events in quadrant C | 2,660,913 | 579,566 |
| Events in quadrant D | 2,563,493 | 532,219 |
| Mode M9 | |||
|---|---|---|---|
| Quadrant | BADHDUFLAG | Total packets | Discarded packets |
| A | 0 | 30 | 0 |
| B | 0 | 30 | 0 |
| C | 0 | 30 | 0 |
| D | 0 | 31 | 0 |
| Mode SS | |||
|---|---|---|---|
| Quadrant | BADHDUFLAG | Total packets | Discarded packets |
| A | 0 | 104 | 0 |
| B | 0 | 104 | 0 |
| C | 0 | 104 | 0 |
| D | 0 | 104 | 0 |
| Mode M0 | |||
|---|---|---|---|
| Quadrant | BADHDUFLAG | Total packets | Discarded packets |
| A | 0 | 11314 | 3 |
| B | 0 | 11426 | 2 |
| C | 0 | 11035 | 2 |
| D | 0 | 11196 | 2 |
| Quadrant | Total seconds | Saturated seconds | Saturation percentage |
|---|---|---|---|
| A | 5071 | 18 | 0.354960% |
| B | 5071 | 64 | 1.262078% |
| C | 5071 | 71 | 1.400118% |
| D | 5071 | 23 | 0.453559% |
Noise dominated data is calculated using 1-second bins in cleaned event files. If a bin has >2000 counts, and if more than 50% of those come from <1% of pixels, then it is considered to be noise-dominated and hence unusable.
| Quadrant | # 1 sec bins | Bins with >0 counts | Bins with >2000 counts | High rate bins dominated by noise | Noise dominated (total time) | Noise dominated (detector-on time) | Marked lightcurve |
|---|---|---|---|---|---|---|---|
| A | 7193 | 5072 | 13 | 13 | 0.18% | 0.26% | 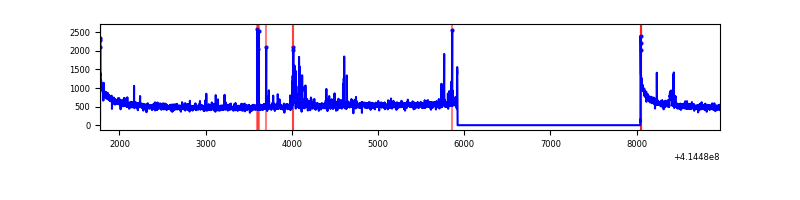 |
| B | 7193 | 5072 | 36 | 36 | 0.50% | 0.71% | 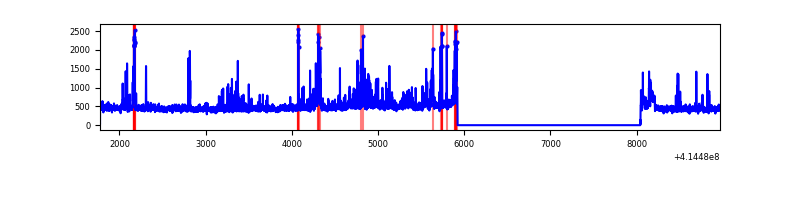 |
| C | 7193 | 5072 | 78 | 78 | 1.08% | 1.54% | 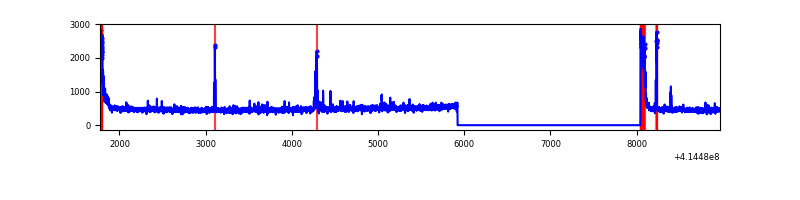 |
| D | 7193 | 5072 | 21 | 21 | 0.29% | 0.41% | 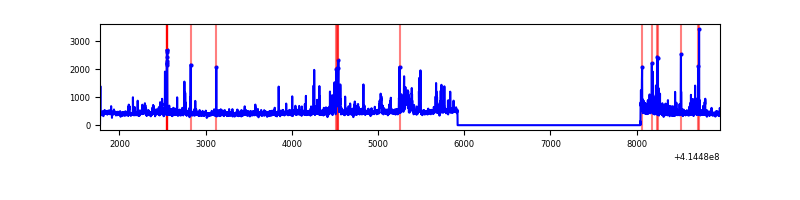 |
Top three noisy pixels from each quadrant. If the there are fewer than three noisy pixels in the level2.evt file, extra rows are filled as -1
| Pixel properties | Quadrant properties | ||||||
|---|---|---|---|---|---|---|---|
| Quadrant | DetID | PixID | Counts | Sigma | Mean | Median | Sigma |
| A | 10 | 83 | 469595 | 4028.43 | 573 | 563 | 116.4 |
| A | 13 | 248 | 64430 | 548.54 | 573 | 563 | 116.4 |
| A | 2 | 79 | 45471 | 385.71 | 573 | 563 | 116.4 |
| B | 4 | 171 | 299614 | 2748.17 | 567 | 553 | 108.8 |
| B | 5 | 255 | 110526 | 1010.58 | 567 | 553 | 108.8 |
| B | 0 | 221 | 26728 | 240.53 | 567 | 553 | 108.8 |
| C | 15 | 214 | 213053 | 1639.64 | 555 | 561 | 129.6 |
| C | 0 | 10 | 172716 | 1328.39 | 555 | 561 | 129.6 |
| C | 10 | 20 | 55116 | 420.96 | 555 | 561 | 129.6 |
| D | 2 | 250 | 146244 | 1062.3 | 558 | 543 | 137.2 |
| D | 9 | 19 | 134686 | 978.03 | 558 | 543 | 137.2 |
| D | 2 | 234 | 27821 | 198.88 | 558 | 543 | 137.2 |
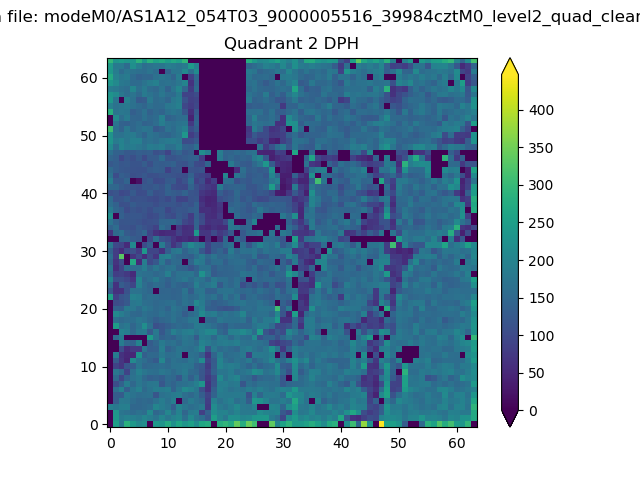
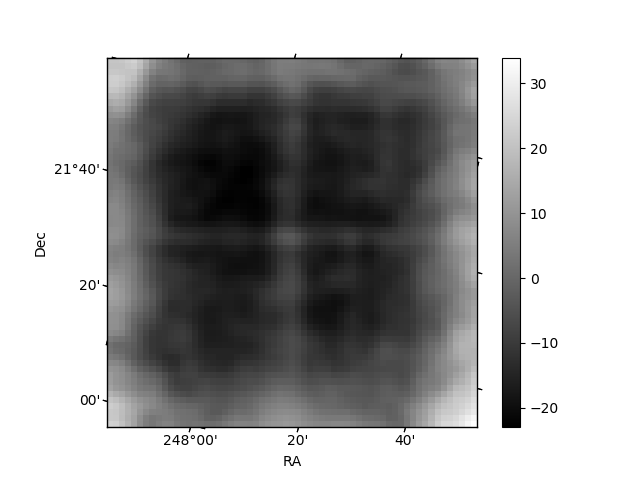
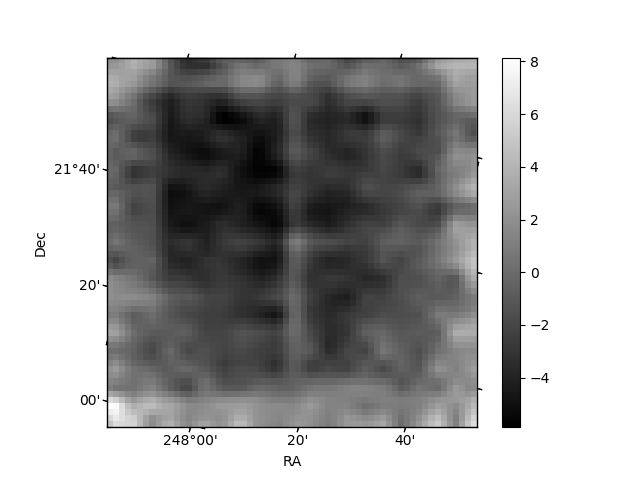
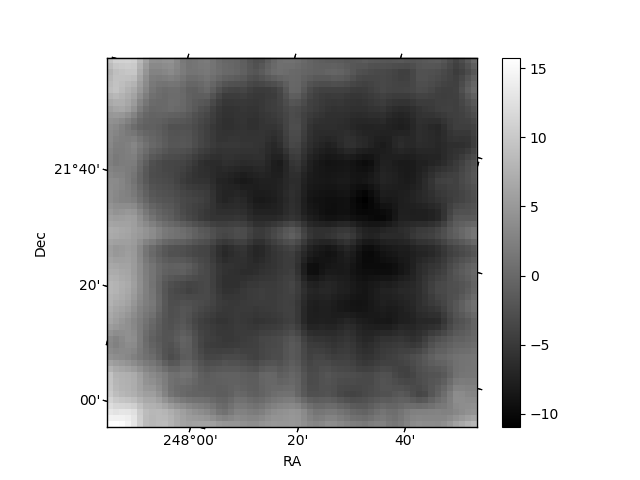
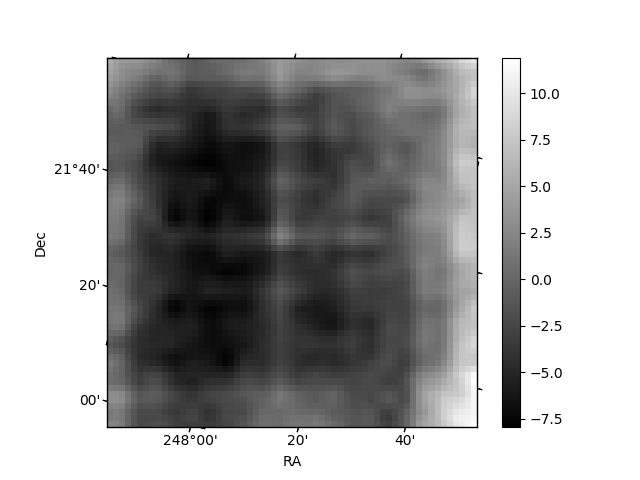
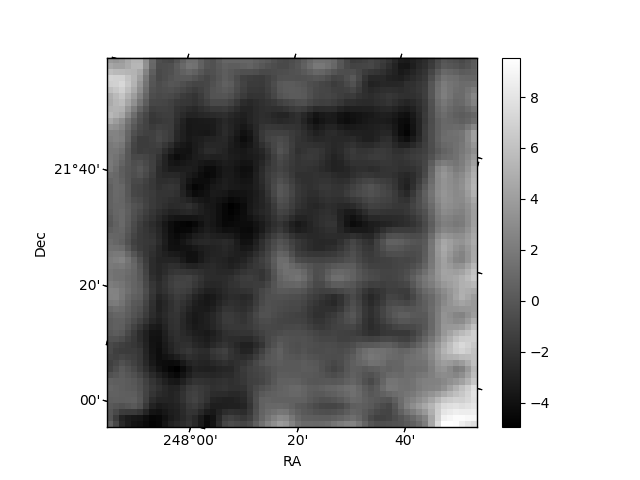
Histogram calculated using DETX and DETY for each event in the final _common_clean file
| Quadrant A | 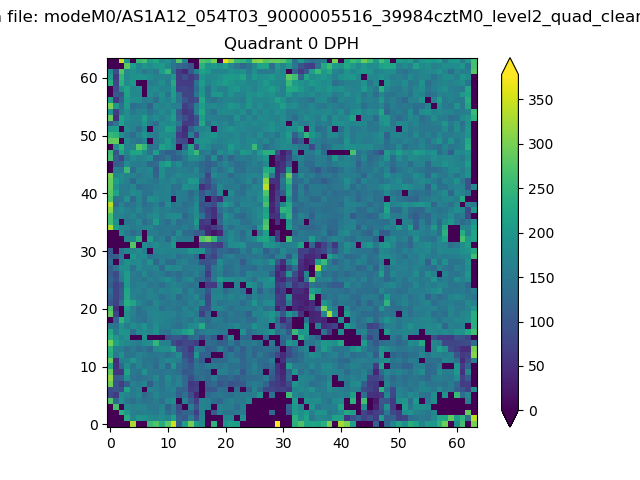 |
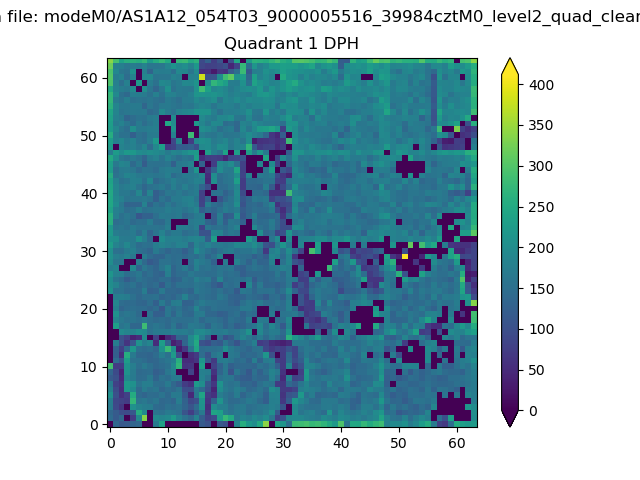 |
Quadrant B |
|---|---|---|---|
| Quadrant D | 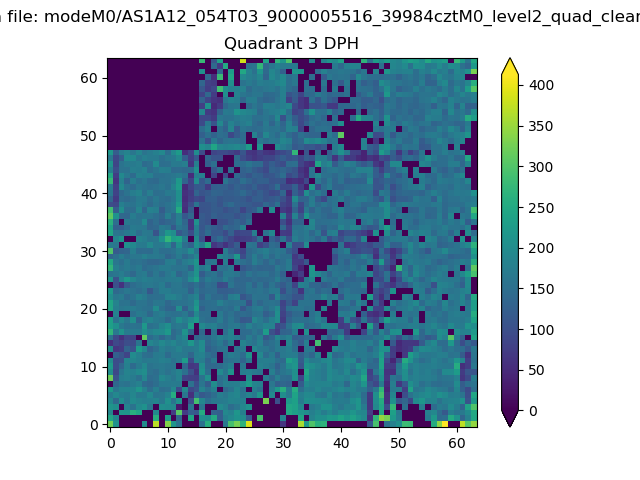 |
 |
Quadrant C |
| Plot type | Count rate plots | Images |
|---|---|---|
| Comparison with Poisson distribution Blue bars denote a histogram of data divided into 1 sec bins. Red curve is a Poisson curve with rate = median count rate of data. |
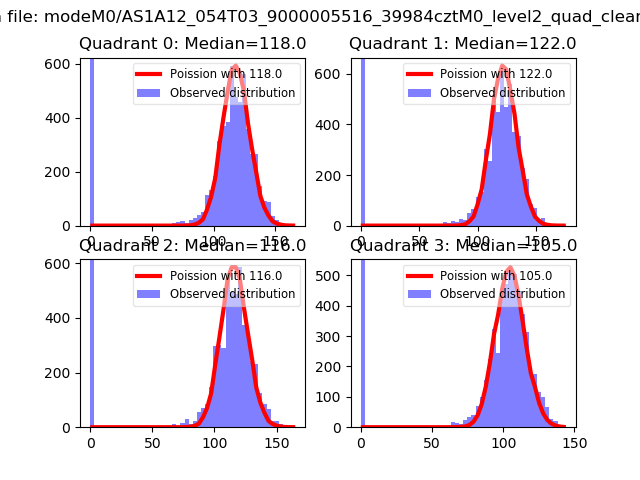 |
 |
| Quadrant-wise count rates Data is divided into 100 sec bins |
 |
|
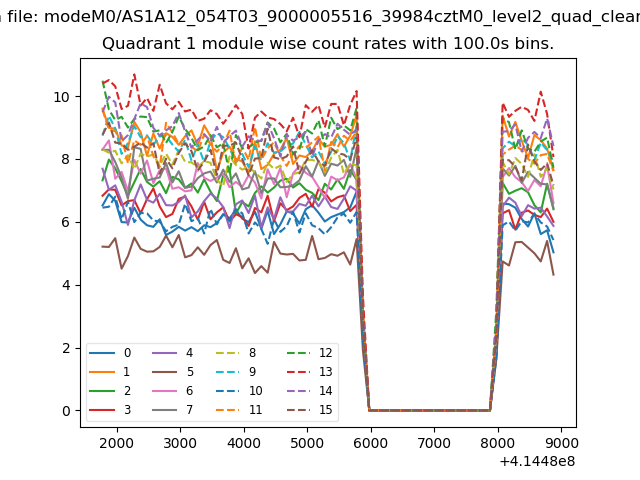
| Module-wise count rates for Quadrant A Data is divided into 100 sec bins |
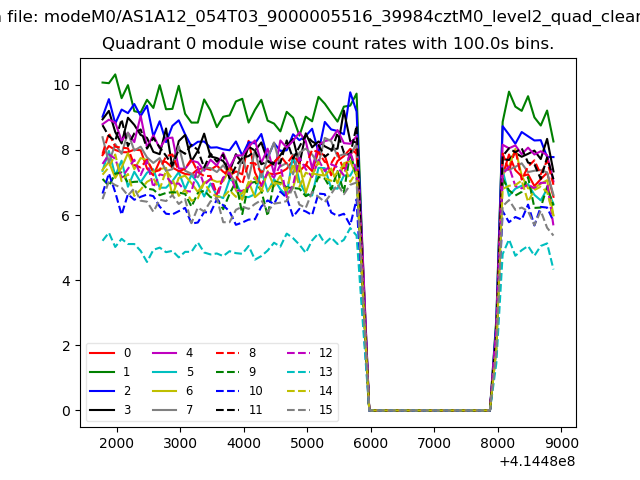 |
 |
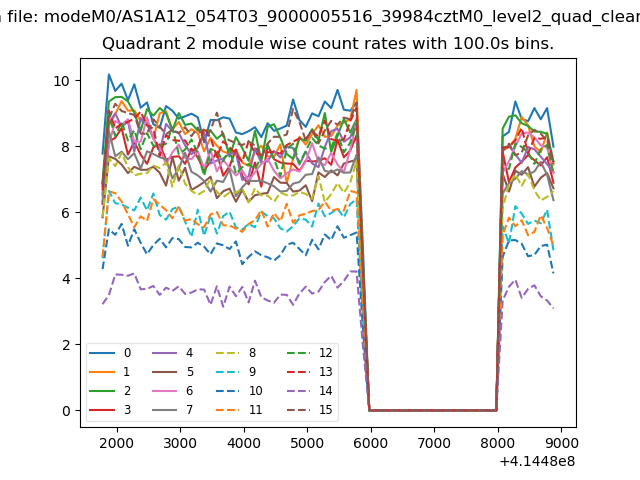
| Module-wise count rates for Quadrant B Data is divided into 100 sec bins |
 |
 |
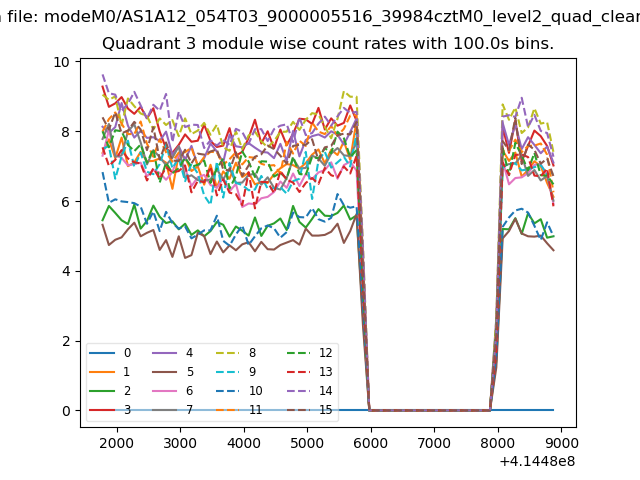
| Module-wise count rates for Quadrant C Data is divided into 100 sec bins |
 |
 |
| Module-wise count rates for Quadrant D Data is divided into 100 sec bins |
 |
 |
| Parameter | Plot |
|---|---|
| CZT HV Monitor |  |
| D_VDD | 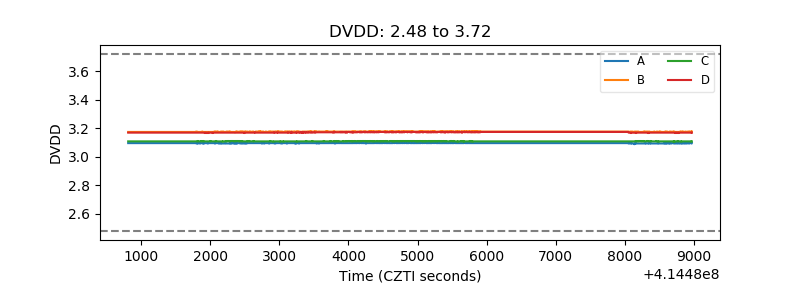 |
| Temperature 1 | 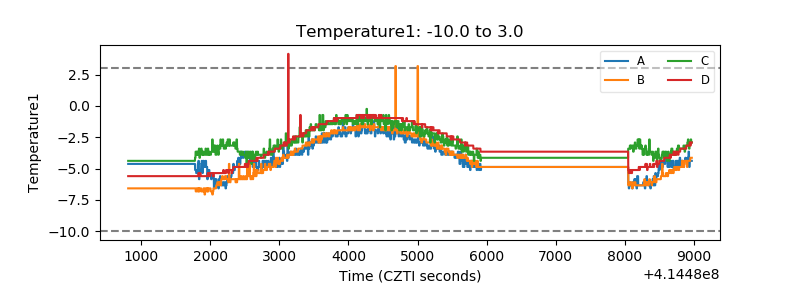 |
| Veto HV Monitor | 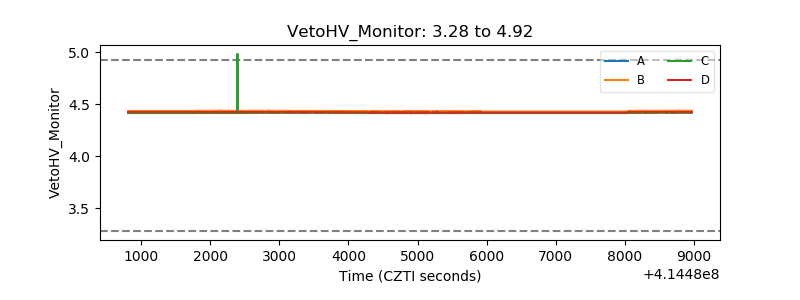 |
| Veto LLD | 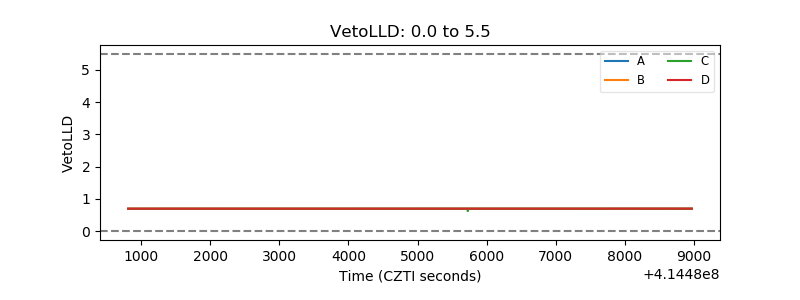 |
| Alpha Counter | 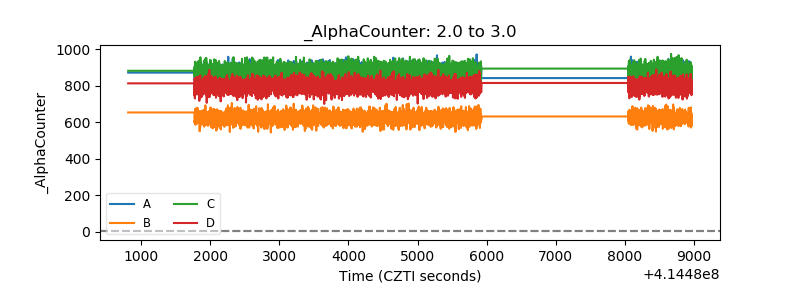 |
| _CPM_Rate | 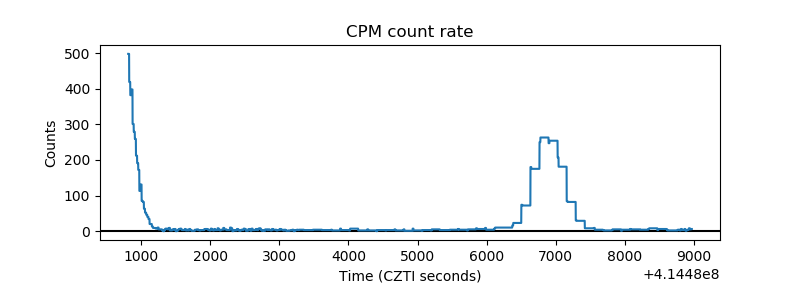 |
| CZT Counter | 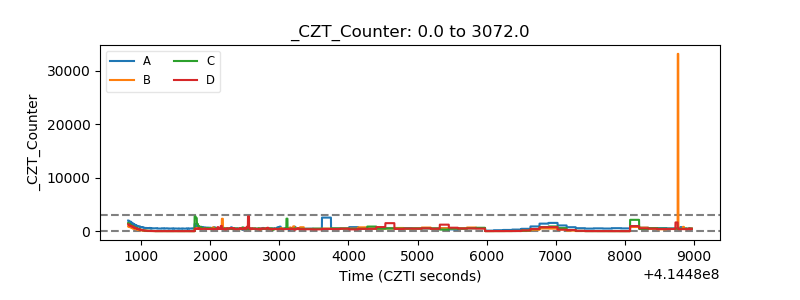 |
| +2.5 Volts monitor | 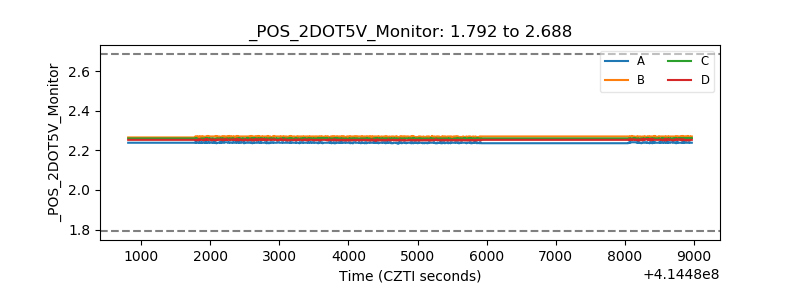 |
| +5 Volts monitor | 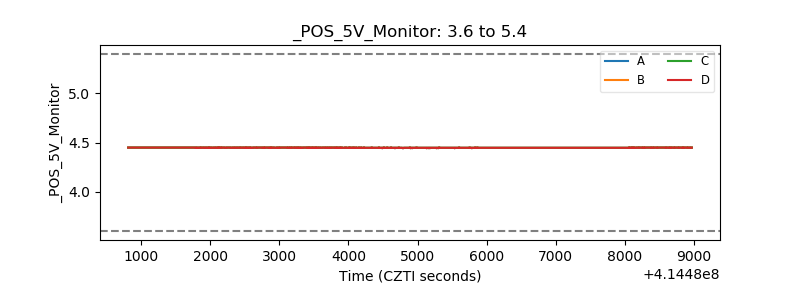 |
| _ROLL_ROT | 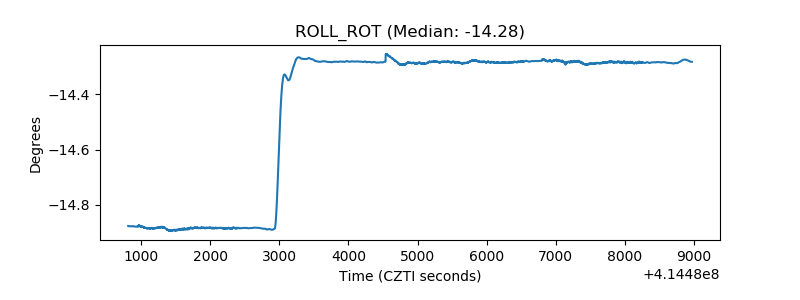 |
| _Roll_DEC | 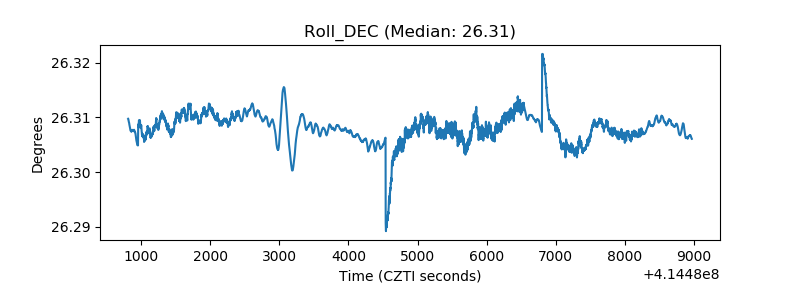 |
| _Roll_RA | 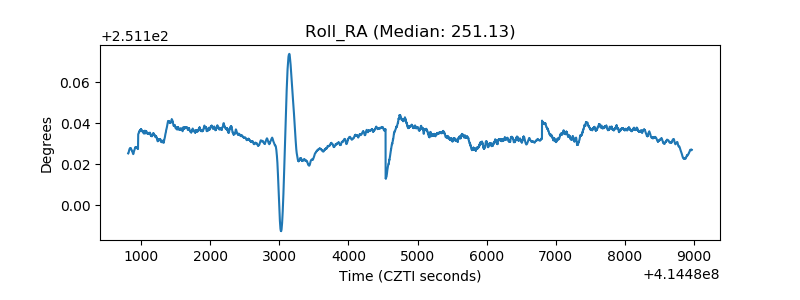 |
| Veto Counter | 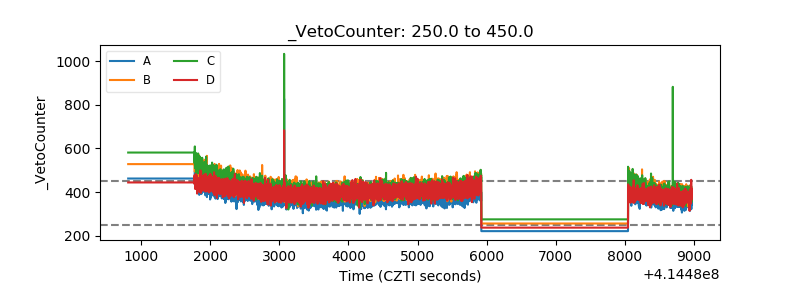 |