| Param | Original file | Final file |
|---|---|---|
| Filename | modeM0/AS1A12_054T03_9000005516_39985cztM0_level2.fits | modeM0/AS1A12_054T03_9000005516_39985cztM0_level2_quad_clean.evt |
| Size (bytes) | 314,066,880 | 85,999,680 |
| Size | 299.5 MB | 82.0 MB |
| Events in quadrant A | 2,830,824 | 575,195 |
| Events in quadrant B | 2,568,287 | 596,920 |
| Events in quadrant C | 2,583,667 | 565,156 |
| Events in quadrant D | 3,243,188 | 507,450 |
| Mode M9 | |||
|---|---|---|---|
| Quadrant | BADHDUFLAG | Total packets | Discarded packets |
| A | 0 | 30 | 0 |
| B | 0 | 30 | 0 |
| C | 0 | 30 | 0 |
| D | 0 | 31 | 0 |
| Mode SS | |||
|---|---|---|---|
| Quadrant | BADHDUFLAG | Total packets | Discarded packets |
| A | 0 | 104 | 0 |
| B | 0 | 104 | 0 |
| C | 0 | 104 | 0 |
| D | 0 | 104 | 0 |
| Mode M0 | |||
|---|---|---|---|
| Quadrant | BADHDUFLAG | Total packets | Discarded packets |
| A | 0 | 11354 | 2 |
| B | 0 | 11006 | 1 |
| C | 0 | 10840 | 1 |
| D | 0 | 13203 | 1 |
| Quadrant | Total seconds | Saturated seconds | Saturation percentage |
|---|---|---|---|
| A | 5131 | 32 | 0.623660% |
| B | 5131 | 20 | 0.389788% |
| C | 5131 | 50 | 0.974469% |
| D | 5131 | 194 | 3.780939% |
Noise dominated data is calculated using 1-second bins in cleaned event files. If a bin has >2000 counts, and if more than 50% of those come from <1% of pixels, then it is considered to be noise-dominated and hence unusable.
| Quadrant | # 1 sec bins | Bins with >0 counts | Bins with >2000 counts | High rate bins dominated by noise | Noise dominated (total time) | Noise dominated (detector-on time) | Marked lightcurve |
|---|---|---|---|---|---|---|---|
| A | 7104 | 5132 | 22 | 22 | 0.31% | 0.43% | 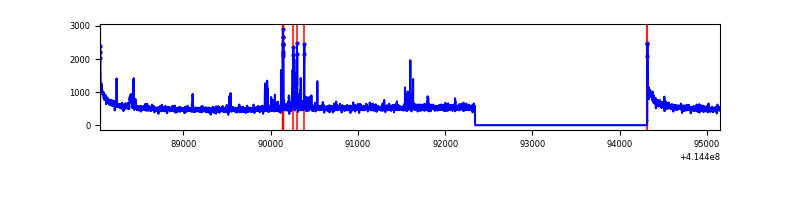 |
| B | 7104 | 5132 | 7 | 7 | 0.10% | 0.14% | 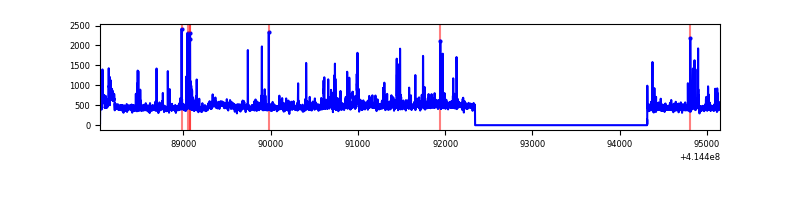 |
| C | 7104 | 5132 | 52 | 52 | 0.73% | 1.01% | 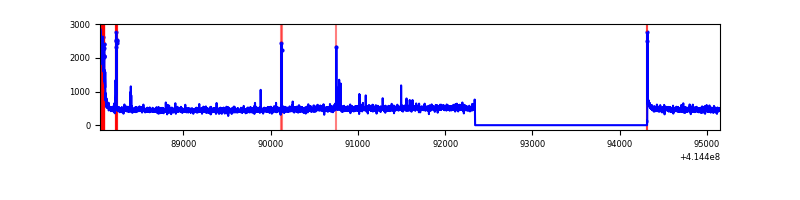 |
| D | 7104 | 5132 | 177 | 177 | 2.49% | 3.45% | 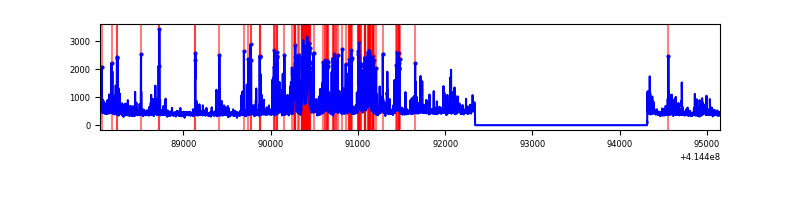 |
Top three noisy pixels from each quadrant. If the there are fewer than three noisy pixels in the level2.evt file, extra rows are filled as -1
| Pixel properties | Quadrant properties | ||||||
|---|---|---|---|---|---|---|---|
| Quadrant | DetID | PixID | Counts | Sigma | Mean | Median | Sigma |
| A | 10 | 83 | 463474 | 3992.42 | 571 | 560 | 115.9 |
| A | 13 | 248 | 86754 | 743.38 | 571 | 560 | 115.9 |
| A | 2 | 79 | 46250 | 394.05 | 571 | 560 | 115.9 |
| B | 4 | 171 | 191879 | 1738.96 | 568 | 554 | 110.0 |
| B | 5 | 255 | 80619 | 727.71 | 568 | 554 | 110.0 |
| B | 5 | 32 | 17989 | 158.47 | 568 | 554 | 110.0 |
| C | 15 | 214 | 217510 | 1657.59 | 558 | 561 | 130.9 |
| C | 0 | 10 | 95384 | 724.49 | 558 | 561 | 130.9 |
| C | 10 | 20 | 54426 | 411.55 | 558 | 561 | 130.9 |
| D | 12 | 227 | 489336 | 3612.32 | 551 | 534 | 135.3 |
| D | 2 | 250 | 390653 | 2883.04 | 551 | 534 | 135.3 |
| D | 13 | 249 | 82061 | 602.49 | 551 | 534 | 135.3 |
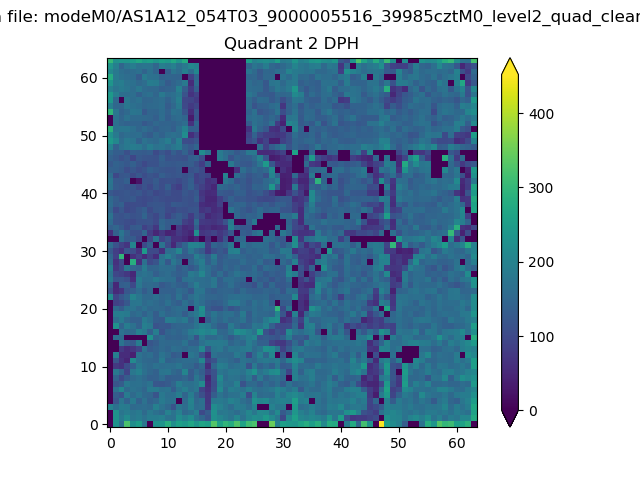
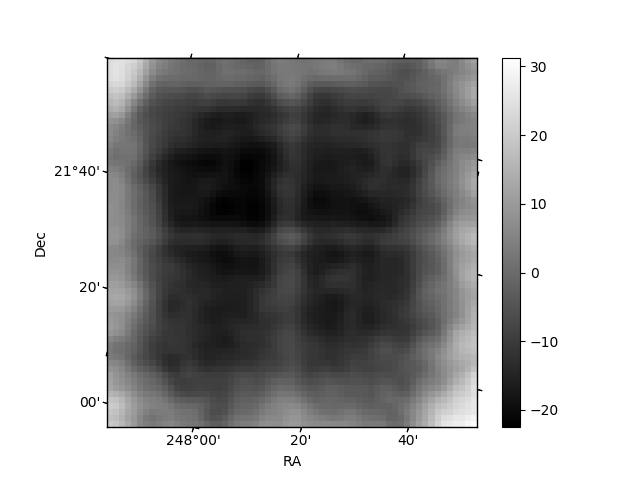
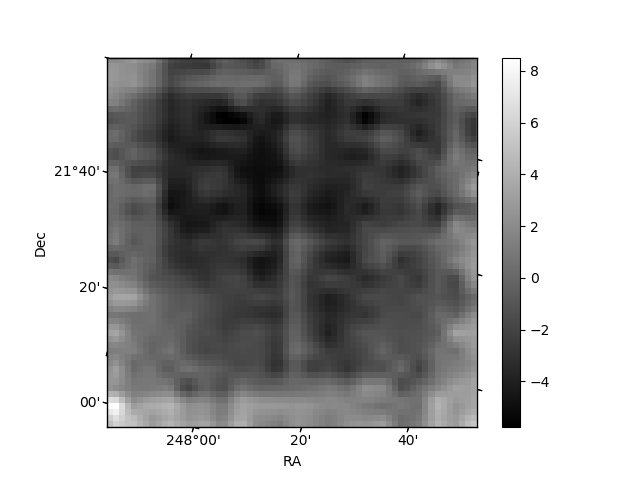
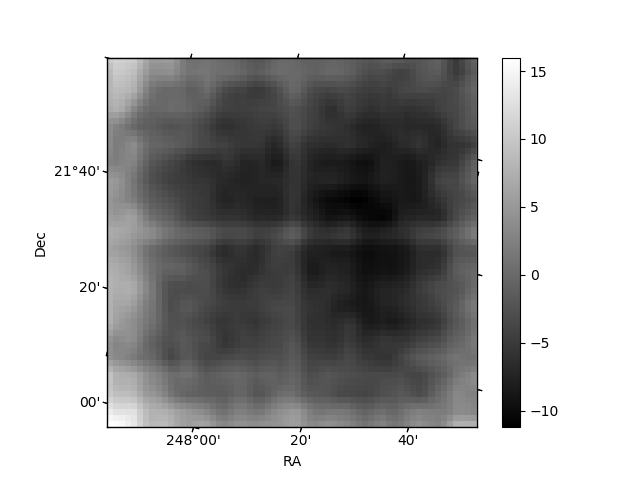
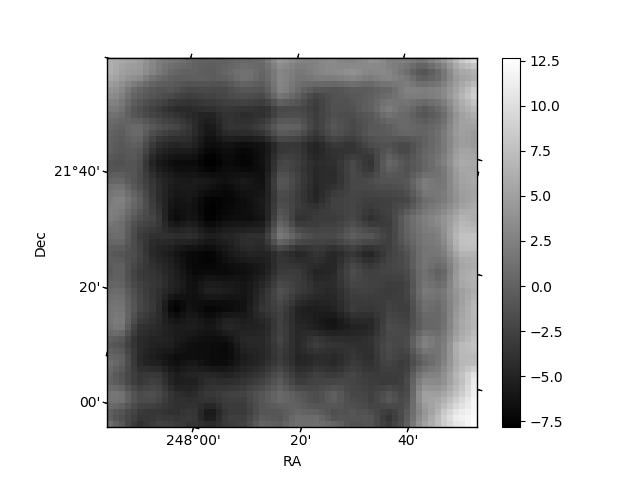
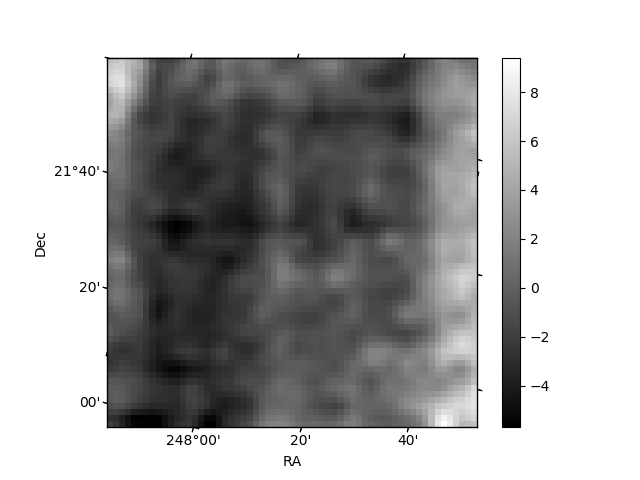
Histogram calculated using DETX and DETY for each event in the final _common_clean file
| Quadrant A | 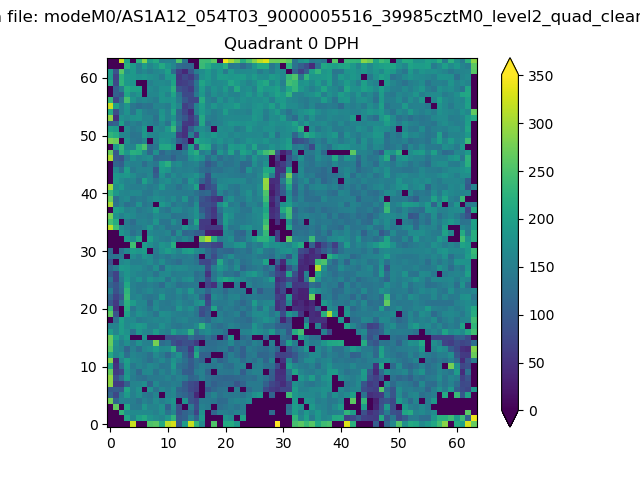 |
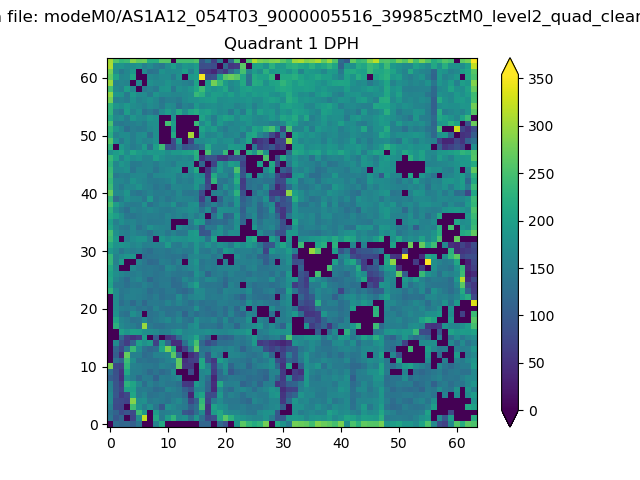 |
Quadrant B |
|---|---|---|---|
| Quadrant D | 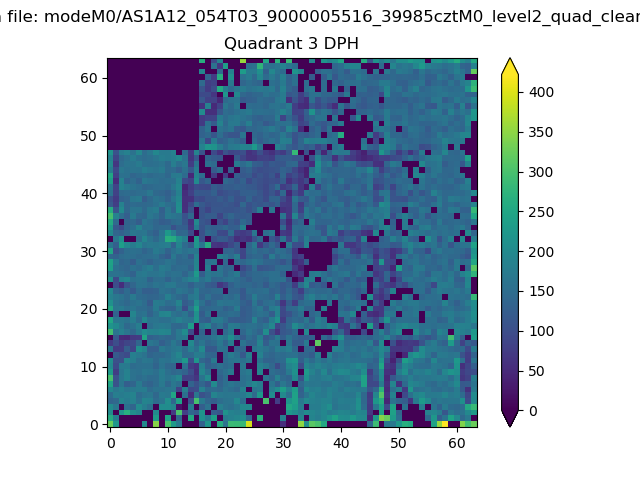 |
 |
Quadrant C |
| Plot type | Count rate plots | Images |
|---|---|---|
| Comparison with Poisson distribution Blue bars denote a histogram of data divided into 1 sec bins. Red curve is a Poisson curve with rate = median count rate of data. |
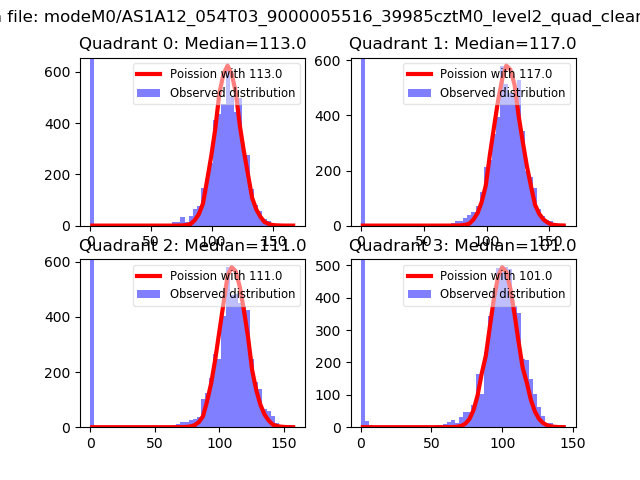 |
 |
| Quadrant-wise count rates Data is divided into 100 sec bins |
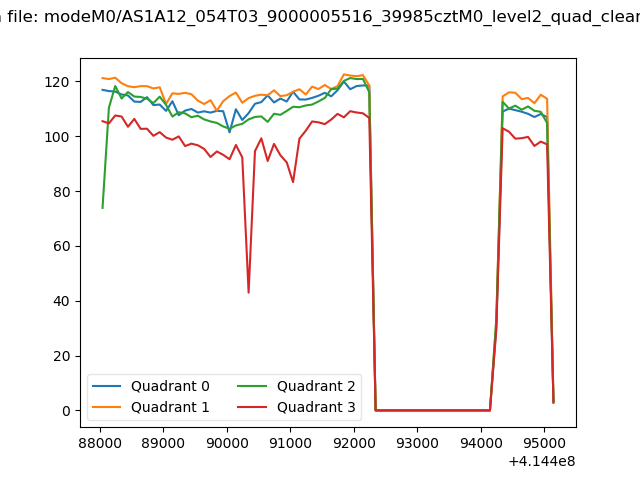 |
|
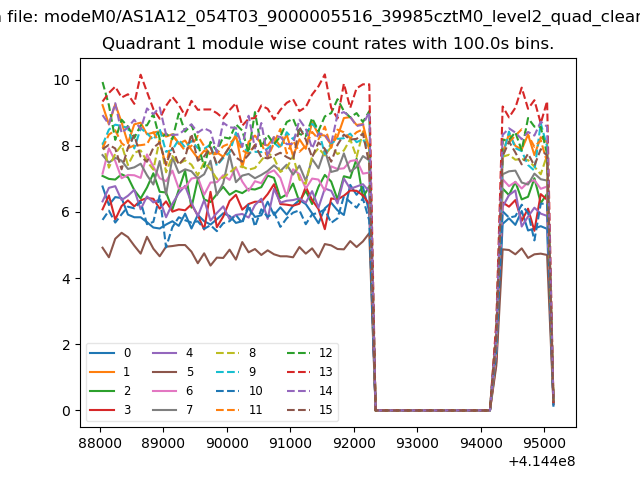
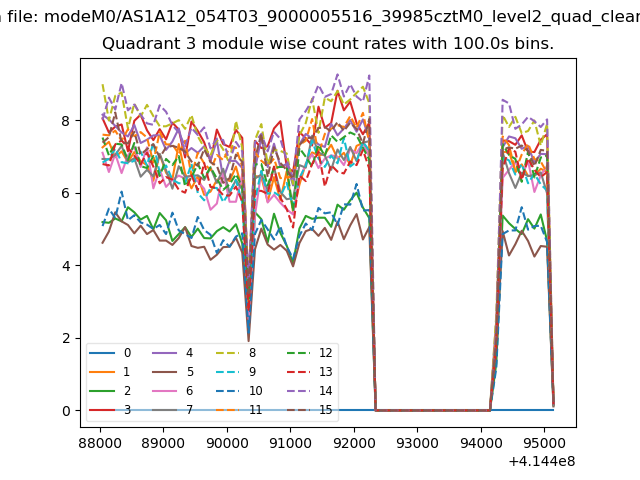
| Module-wise count rates for Quadrant A Data is divided into 100 sec bins |
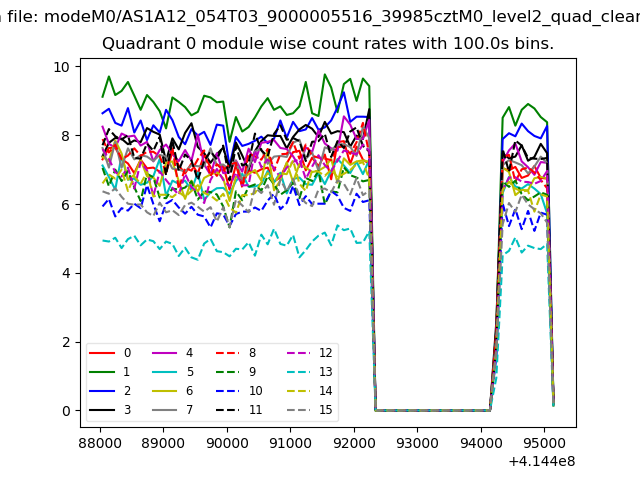 |
 |
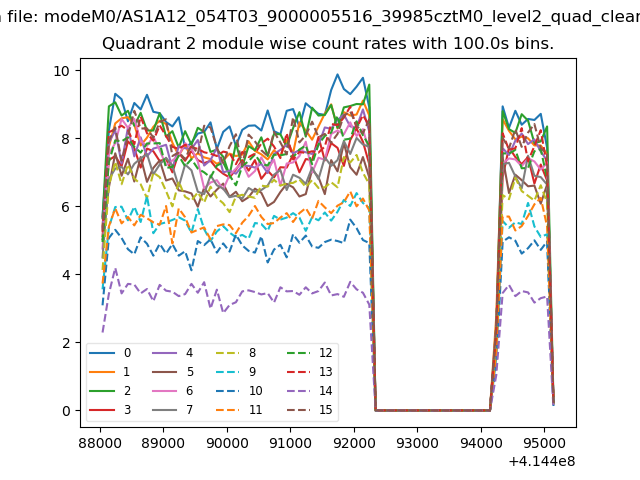
| Module-wise count rates for Quadrant B Data is divided into 100 sec bins |
 |
 |
| Module-wise count rates for Quadrant C Data is divided into 100 sec bins |
 |
 |
| Module-wise count rates for Quadrant D Data is divided into 100 sec bins |
 |
 |
| Parameter | Plot |
|---|---|
| CZT HV Monitor | 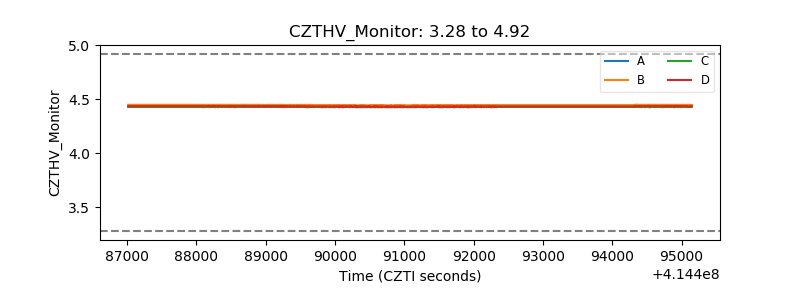 |
| D_VDD | 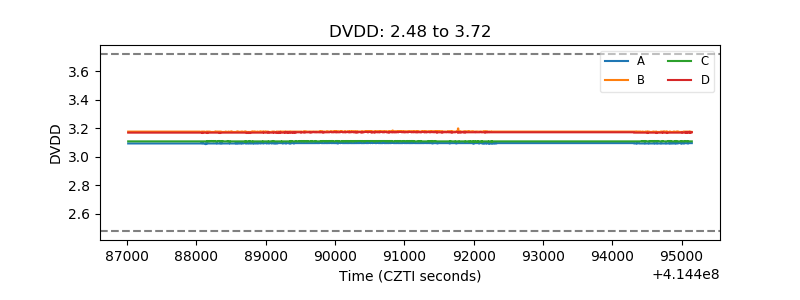 |
| Temperature 1 | 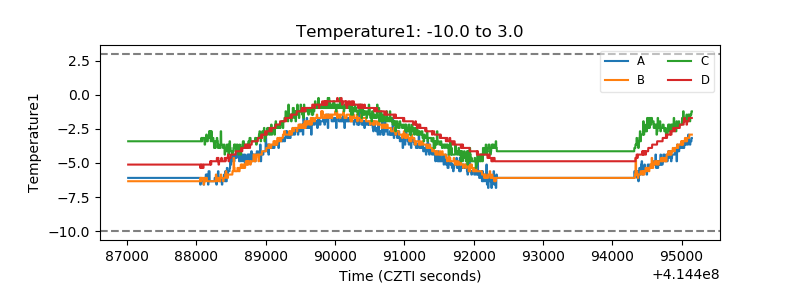 |
| Veto HV Monitor | 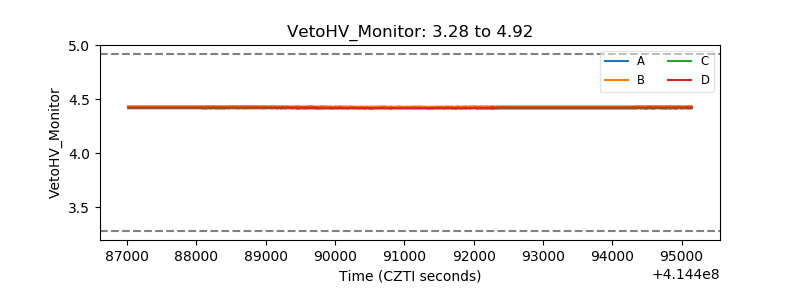 |
| Veto LLD | 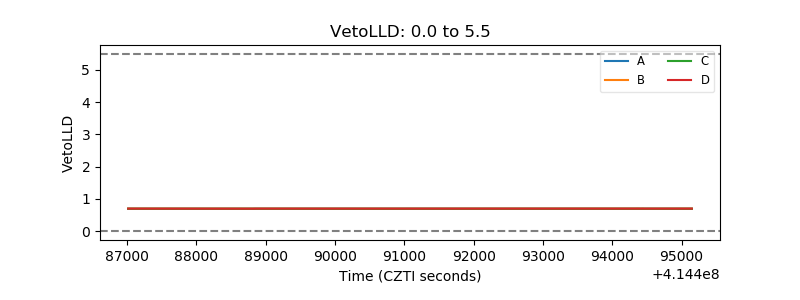 |
| Alpha Counter | 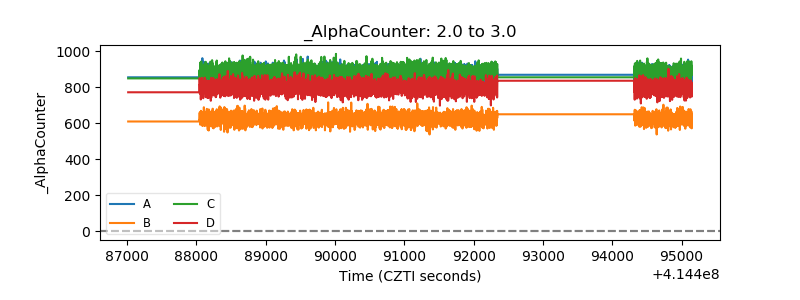 |
| _CPM_Rate | 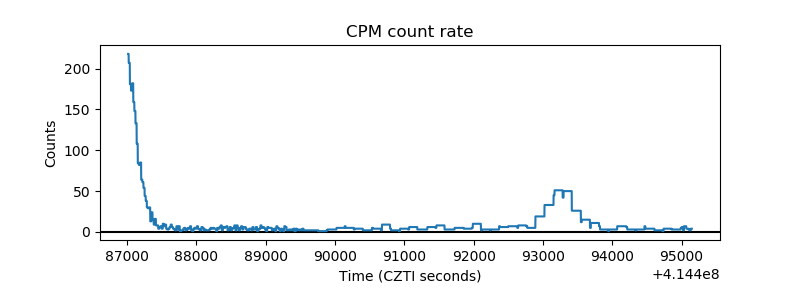 |
| CZT Counter | 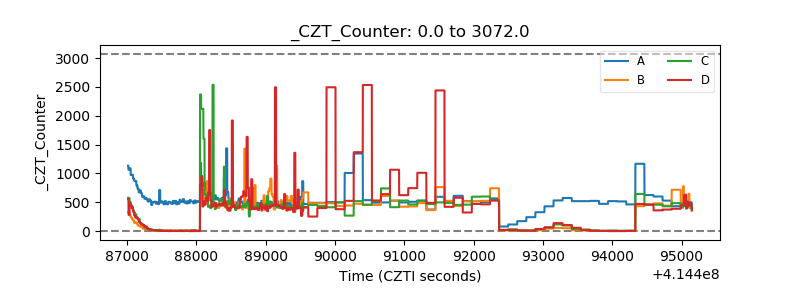 |
| +2.5 Volts monitor | 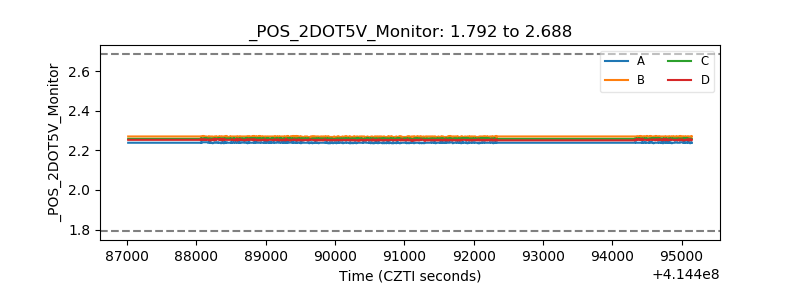 |
| +5 Volts monitor | 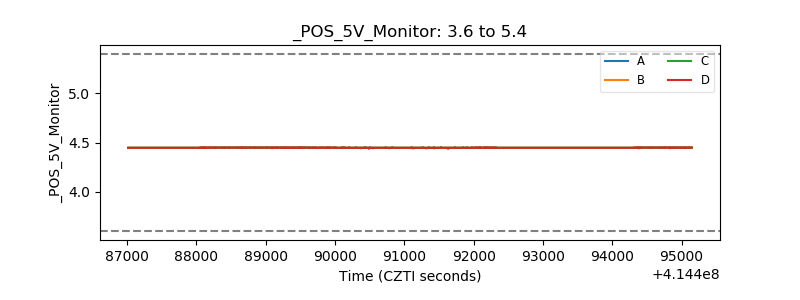 |
| _ROLL_ROT | 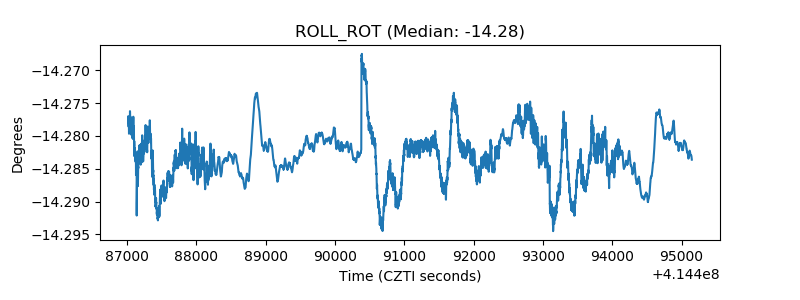 |
| _Roll_DEC | 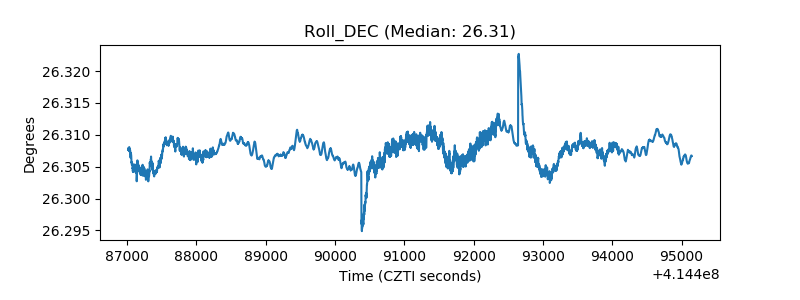 |
| _Roll_RA | 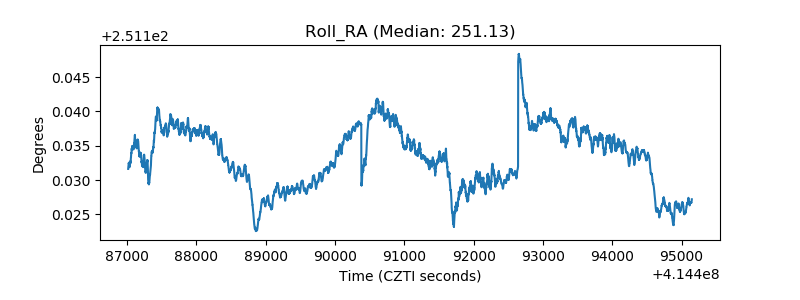 |
| Veto Counter | 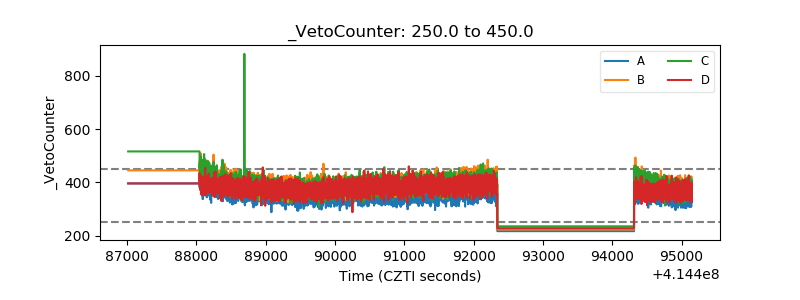 |