| Param | Original file | Final file |
|---|---|---|
| Filename | modeM0/AS1A12_054T03_9000005516_39986cztM0_level2.fits | modeM0/AS1A12_054T03_9000005516_39986cztM0_level2_quad_clean.evt |
| Size (bytes) | 381,853,440 | 85,631,040 |
| Size | 364.2 MB | 81.7 MB |
| Events in quadrant A | 2,921,644 | 591,197 |
| Events in quadrant B | 3,242,451 | 597,518 |
| Events in quadrant C | 2,584,657 | 580,912 |
| Events in quadrant D | 4,965,932 | 445,996 |
| Mode M9 | |||
|---|---|---|---|
| Quadrant | BADHDUFLAG | Total packets | Discarded packets |
| A | 0 | 27 | 0 |
| B | 0 | 27 | 0 |
| C | 0 | 27 | 0 |
| D | 0 | 28 | 0 |
| Mode SS | |||
|---|---|---|---|
| Quadrant | BADHDUFLAG | Total packets | Discarded packets |
| A | 0 | 108 | 0 |
| B | 0 | 108 | 0 |
| C | 0 | 108 | 0 |
| D | 0 | 108 | 0 |
| Mode M0 | |||
|---|---|---|---|
| Quadrant | BADHDUFLAG | Total packets | Discarded packets |
| A | 0 | 11824 | 2 |
| B | 0 | 13243 | 1 |
| C | 0 | 11012 | 1 |
| D | 0 | 18479 | 1 |
| Quadrant | Total seconds | Saturated seconds | Saturation percentage |
|---|---|---|---|
| A | 5394 | 21 | 0.389321% |
| B | 5394 | 184 | 3.411198% |
| C | 5394 | 15 | 0.278087% |
| D | 5394 | 944 | 17.500927% |
Noise dominated data is calculated using 1-second bins in cleaned event files. If a bin has >2000 counts, and if more than 50% of those come from <1% of pixels, then it is considered to be noise-dominated and hence unusable.
| Quadrant | # 1 sec bins | Bins with >0 counts | Bins with >2000 counts | High rate bins dominated by noise | Noise dominated (total time) | Noise dominated (detector-on time) | Marked lightcurve |
|---|---|---|---|---|---|---|---|
| A | 7068 | 5395 | 18 | 18 | 0.25% | 0.33% | 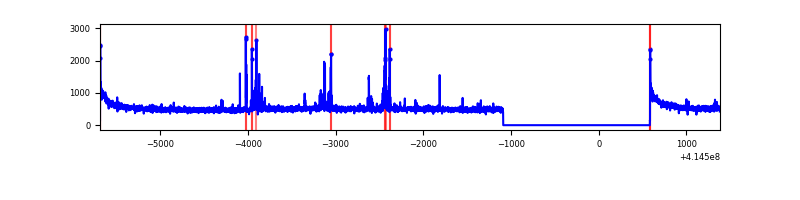 |
| B | 7068 | 5395 | 127 | 127 | 1.80% | 2.35% | 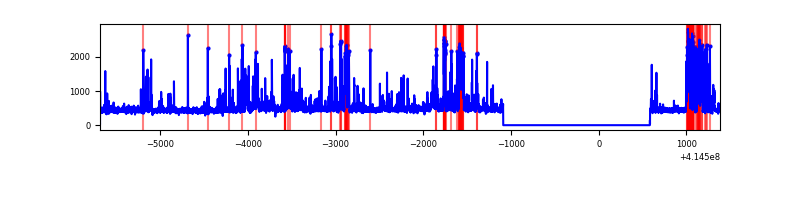 |
| C | 7068 | 5395 | 10 | 10 | 0.14% | 0.19% | 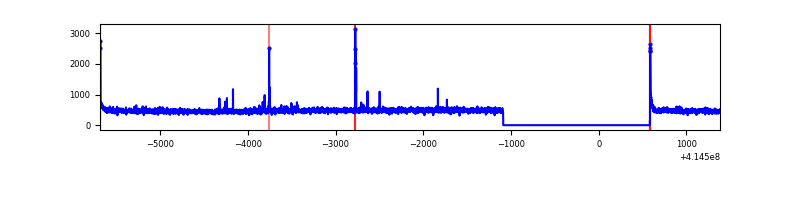 |
| D | 7068 | 5395 | 918 | 918 | 12.99% | 17.02% | 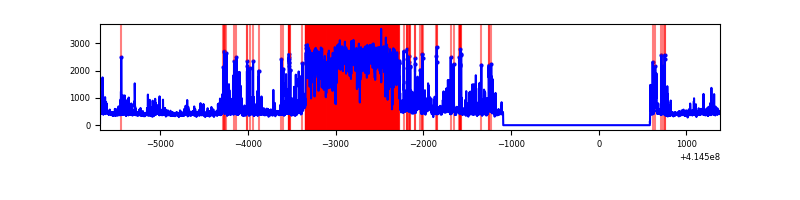 |
Top three noisy pixels from each quadrant. If the there are fewer than three noisy pixels in the level2.evt file, extra rows are filled as -1
| Pixel properties | Quadrant properties | ||||||
|---|---|---|---|---|---|---|---|
| Quadrant | DetID | PixID | Counts | Sigma | Mean | Median | Sigma |
| A | 10 | 83 | 481745 | 3911.49 | 595 | 582 | 123.0 |
| A | 13 | 248 | 82054 | 662.31 | 595 | 582 | 123.0 |
| A | 15 | 223 | 44345 | 355.76 | 595 | 582 | 123.0 |
| B | 4 | 171 | 762229 | 6577.16 | 587 | 570 | 115.8 |
| B | 5 | 255 | 71948 | 616.37 | 587 | 570 | 115.8 |
| B | 0 | 230 | 38786 | 330.01 | 587 | 570 | 115.8 |
| C | 15 | 214 | 229018 | 1666.57 | 583 | 586 | 137.1 |
| C | 0 | 10 | 35169 | 252.31 | 583 | 586 | 137.1 |
| C | 15 | 208 | 19742 | 139.76 | 583 | 586 | 137.1 |
| D | 2 | 249 | 2031237 | 15376.01 | 532 | 516 | 132.1 |
| D | 12 | 227 | 505392 | 3822.77 | 532 | 516 | 132.1 |
| D | 2 | 250 | 179704 | 1356.76 | 532 | 516 | 132.1 |
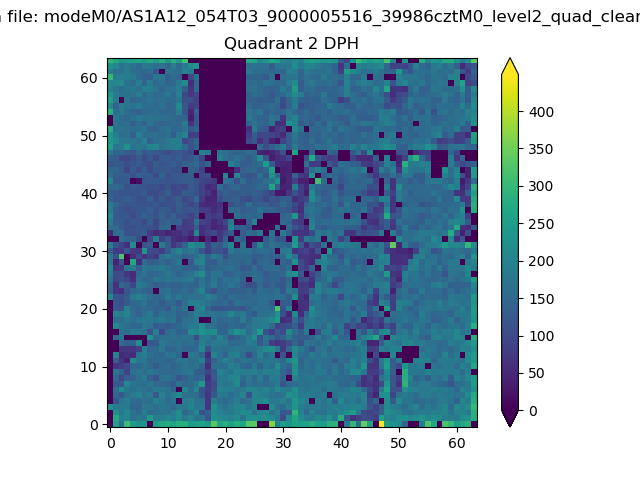
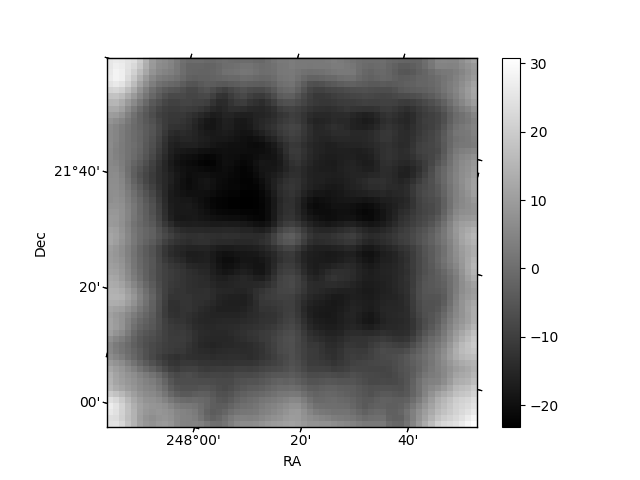
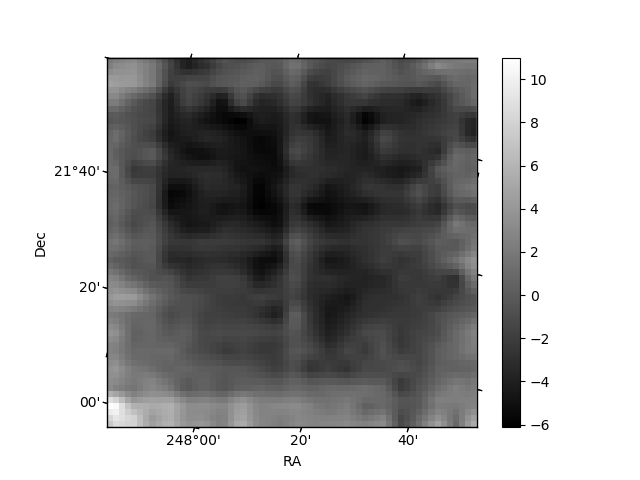
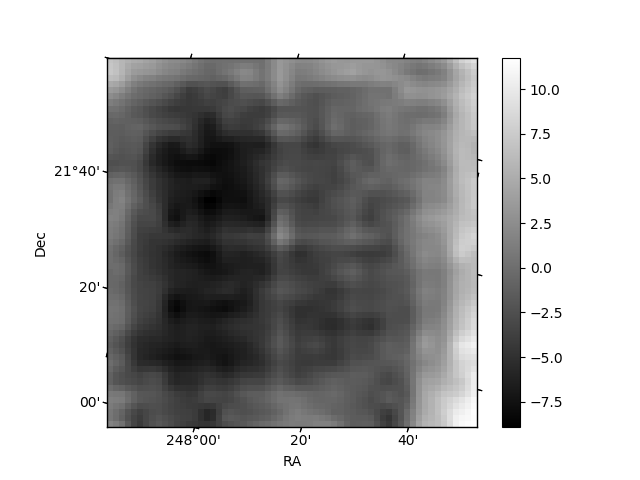
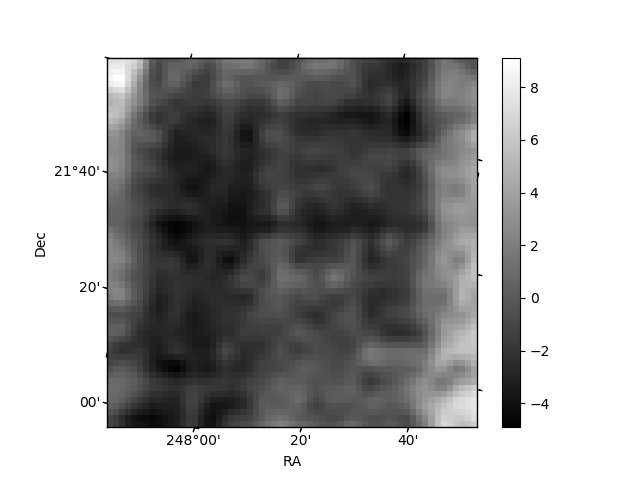
Histogram calculated using DETX and DETY for each event in the final _common_clean file
| Quadrant A | 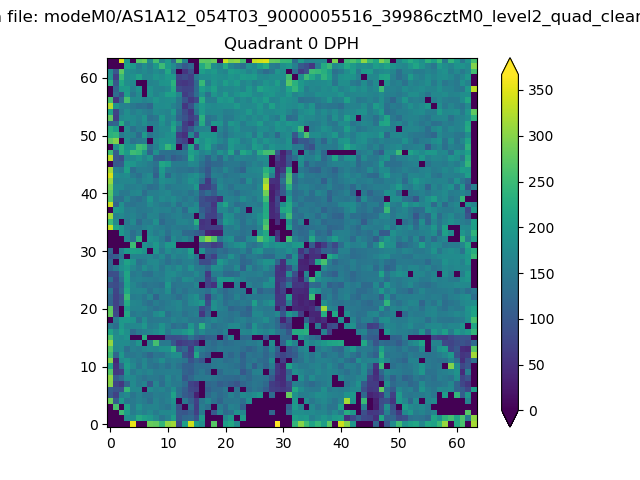 |
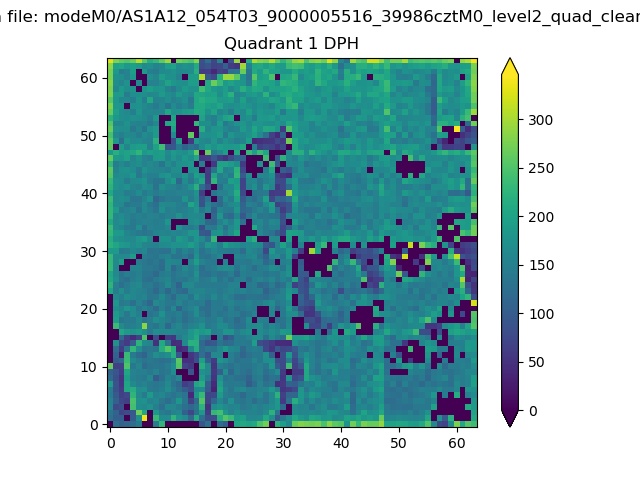 |
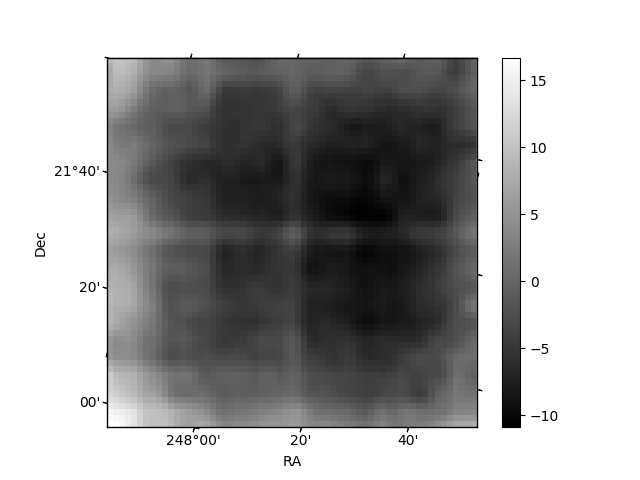
Quadrant B |
|---|---|---|---|
| Quadrant D | 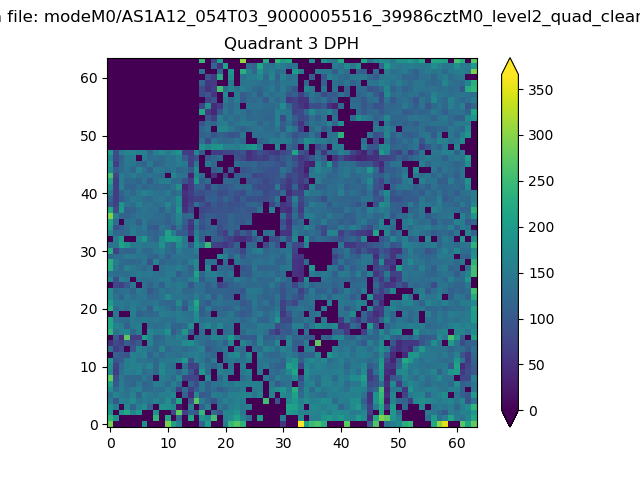 |
 |
Quadrant C |
| Plot type | Count rate plots | Images |
|---|---|---|
| Comparison with Poisson distribution Blue bars denote a histogram of data divided into 1 sec bins. Red curve is a Poisson curve with rate = median count rate of data. |
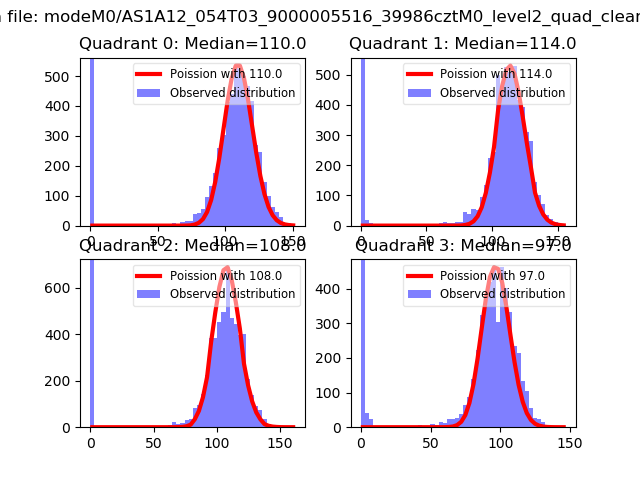 |
 |
| Quadrant-wise count rates Data is divided into 100 sec bins |
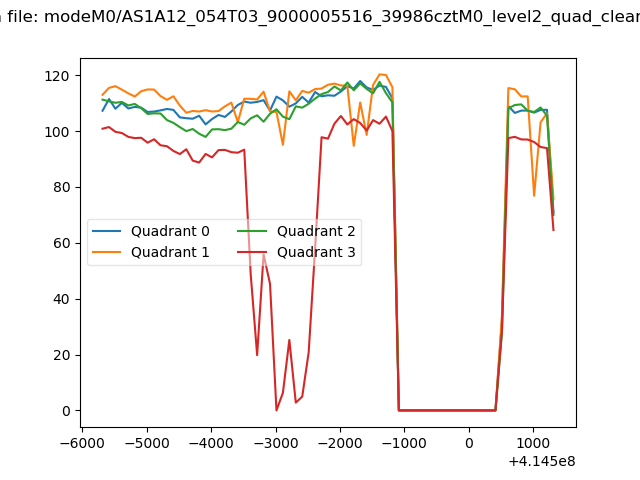 |
|
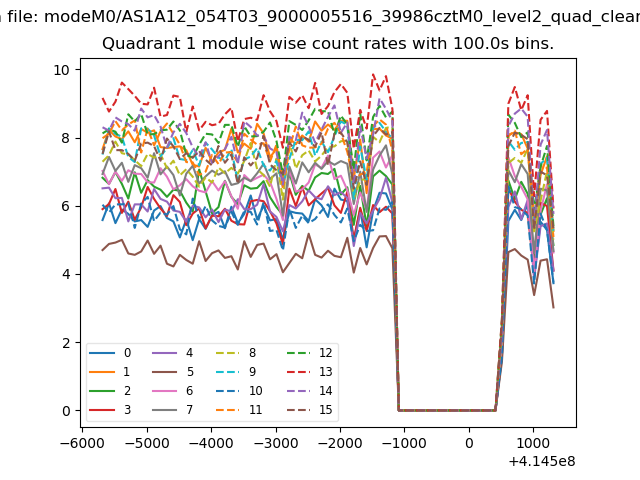
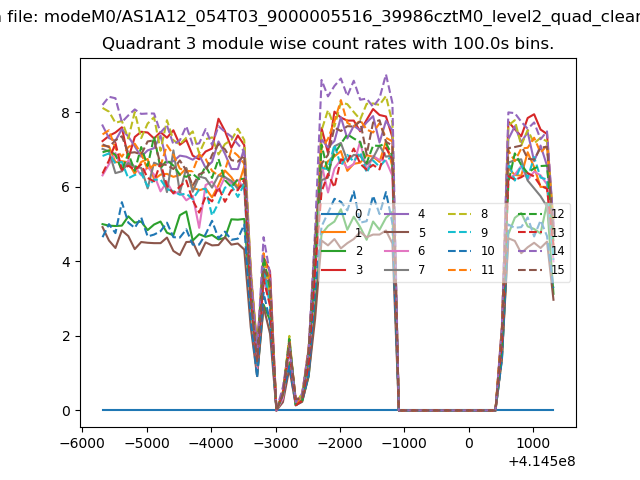
| Module-wise count rates for Quadrant A Data is divided into 100 sec bins |
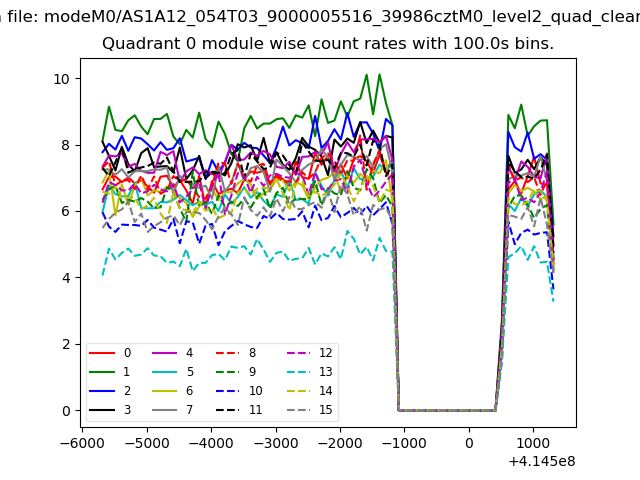 |
 |
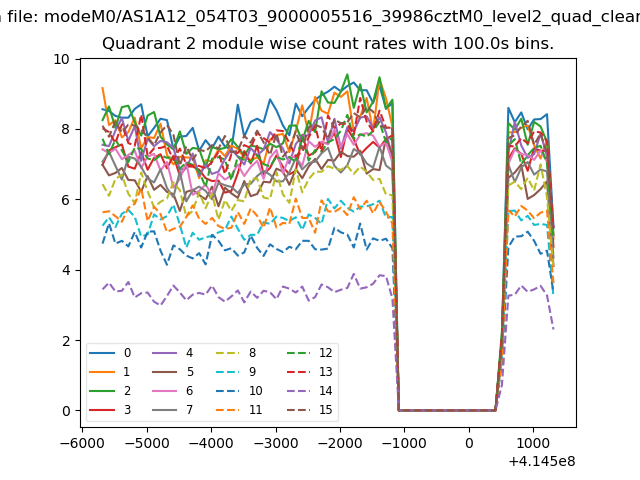
| Module-wise count rates for Quadrant B Data is divided into 100 sec bins |
 |
 |
| Module-wise count rates for Quadrant C Data is divided into 100 sec bins |
 |
 |
| Module-wise count rates for Quadrant D Data is divided into 100 sec bins |
 |
 |
| Parameter | Plot |
|---|---|
| CZT HV Monitor | 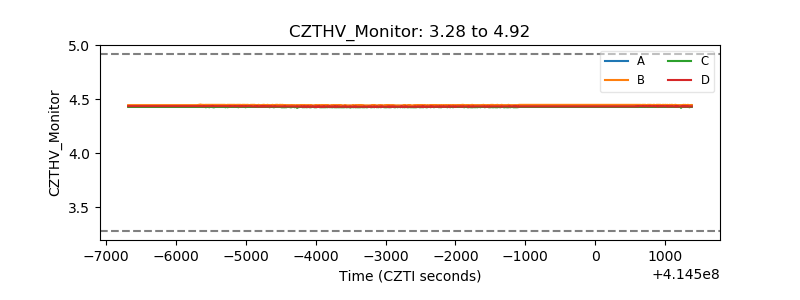 |
| D_VDD | 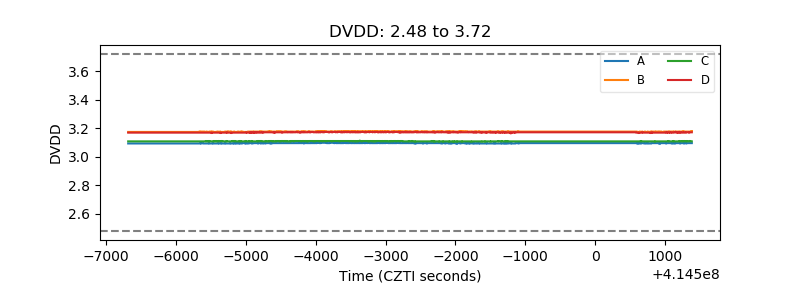 |
| Temperature 1 | 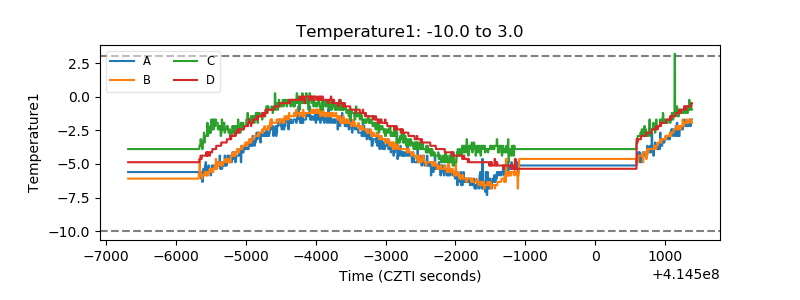 |
| Veto HV Monitor | 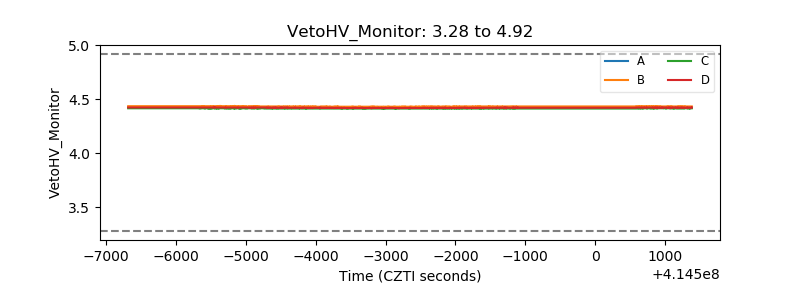 |
| Veto LLD | 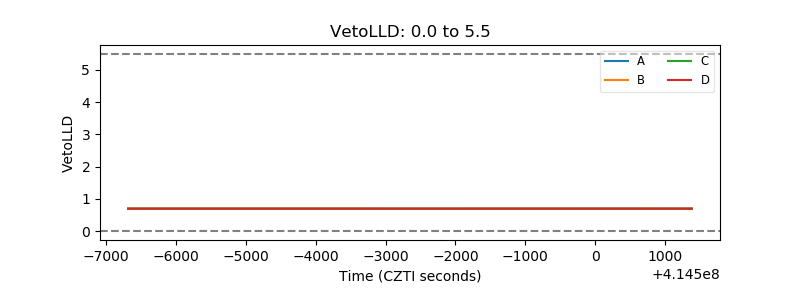 |
| Alpha Counter | 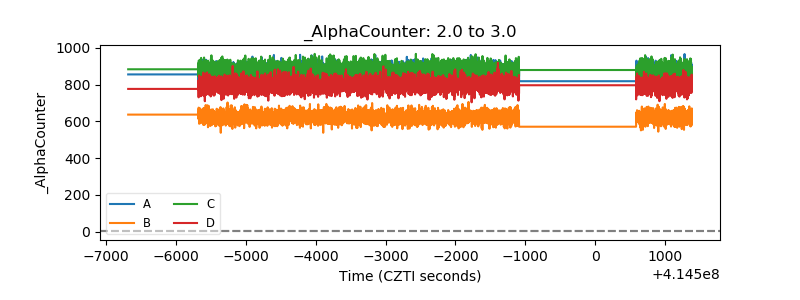 |
| _CPM_Rate | 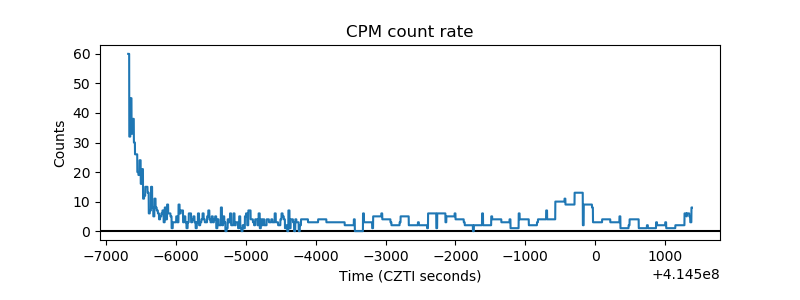 |
| CZT Counter | 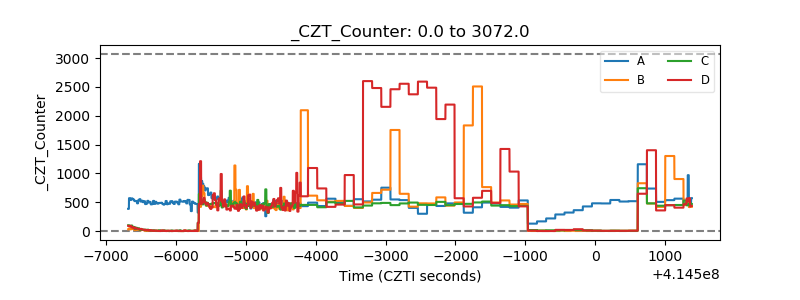 |
| +2.5 Volts monitor | 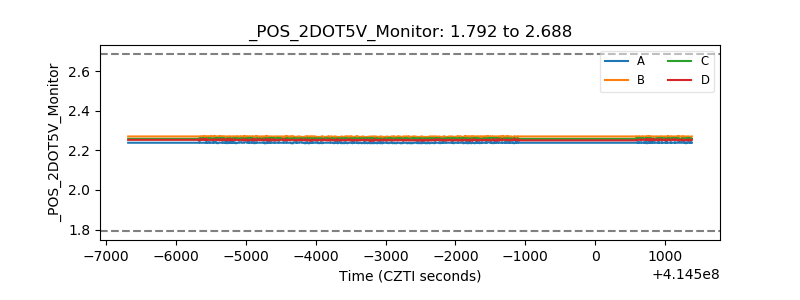 |
| +5 Volts monitor |  |
| _ROLL_ROT | 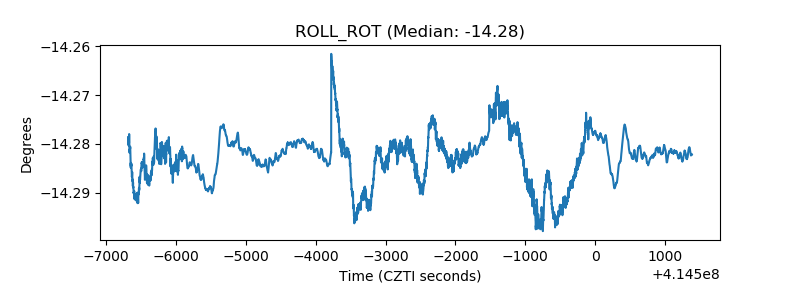 |
| _Roll_DEC | 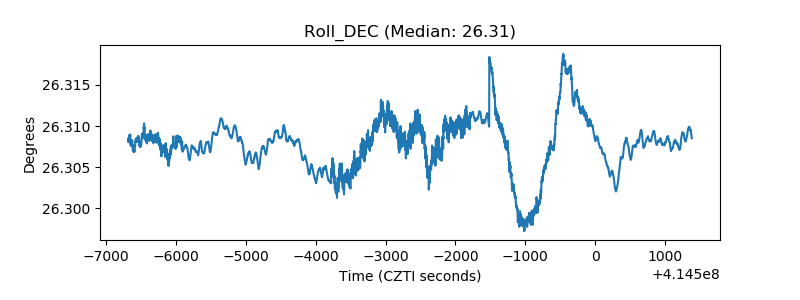 |
| _Roll_RA | 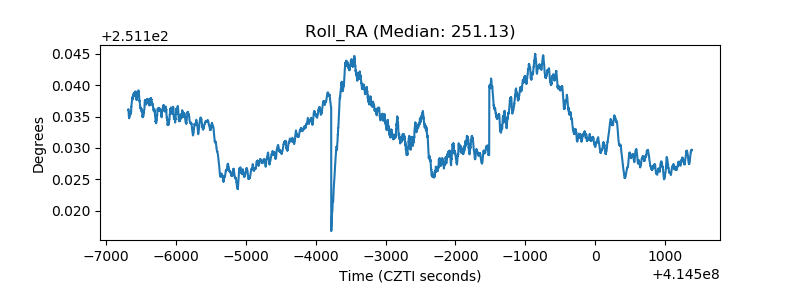 |
| Veto Counter | 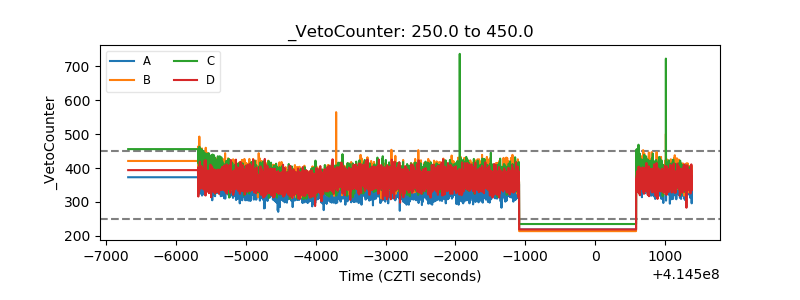 |