| Param | Original file | Final file |
|---|---|---|
| Filename | modeM0/AS1A12_054T03_9000005516_39987cztM0_level2.fits | modeM0/AS1A12_054T03_9000005516_39987cztM0_level2_quad_clean.evt |
| Size (bytes) | 385,709,760 | 90,938,880 |
| Size | 367.8 MB | 86.7 MB |
| Events in quadrant A | 3,019,121 | 618,567 |
| Events in quadrant B | 3,158,069 | 629,386 |
| Events in quadrant C | 2,730,264 | 606,956 |
| Events in quadrant D | 4,926,057 | 499,752 |
| Mode M9 | |||
|---|---|---|---|
| Quadrant | BADHDUFLAG | Total packets | Discarded packets |
| A | 0 | 14 | 0 |
| B | 0 | 14 | 0 |
| C | 0 | 14 | 0 |
| D | 0 | 14 | 0 |
| Mode SS | |||
|---|---|---|---|
| Quadrant | BADHDUFLAG | Total packets | Discarded packets |
| A | 0 | 116 | 0 |
| B | 0 | 116 | 0 |
| C | 0 | 116 | 0 |
| D | 0 | 116 | 0 |
| Mode M0 | |||
|---|---|---|---|
| Quadrant | BADHDUFLAG | Total packets | Discarded packets |
| A | 0 | 12274 | 3 |
| B | 0 | 13157 | 2 |
| C | 0 | 11655 | 2 |
| D | 0 | 18604 | 2 |
| Quadrant | Total seconds | Saturated seconds | Saturation percentage |
|---|---|---|---|
| A | 5703 | 10 | 0.175346% |
| B | 5703 | 129 | 2.261967% |
| C | 5703 | 8 | 0.140277% |
| D | 5704 | 740 | 12.973352% |
Noise dominated data is calculated using 1-second bins in cleaned event files. If a bin has >2000 counts, and if more than 50% of those come from <1% of pixels, then it is considered to be noise-dominated and hence unusable.
| Quadrant | # 1 sec bins | Bins with >0 counts | Bins with >2000 counts | High rate bins dominated by noise | Noise dominated (total time) | Noise dominated (detector-on time) | Marked lightcurve |
|---|---|---|---|---|---|---|---|
| A | 7106 | 5704 | 9 | 9 | 0.13% | 0.16% |  |
| B | 7106 | 5704 | 89 | 89 | 1.25% | 1.56% |  |
| C | 7106 | 5704 | 8 | 8 | 0.11% | 0.14% |  |
| D | 7107 | 5705 | 723 | 723 | 10.17% | 12.67% |  |
Top three noisy pixels from each quadrant. If the there are fewer than three noisy pixels in the level2.evt file, extra rows are filled as -1
| Pixel properties | Quadrant properties | ||||||
|---|---|---|---|---|---|---|---|
| Quadrant | DetID | PixID | Counts | Sigma | Mean | Median | Sigma |
| A | 10 | 83 | 511819 | 3925.77 | 629 | 616 | 130.2 |
| A | 13 | 248 | 56838 | 431.75 | 629 | 616 | 130.2 |
| A | 7 | 3 | 10781 | 78.06 | 629 | 616 | 130.2 |
| B | 4 | 171 | 511413 | 4207.32 | 622 | 605 | 121.4 |
| B | 5 | 255 | 77783 | 635.68 | 622 | 605 | 121.4 |
| B | 0 | 230 | 47617 | 387.22 | 622 | 605 | 121.4 |
| C | 15 | 214 | 242170 | 1665.76 | 614 | 618 | 145.0 |
| C | 10 | 20 | 33503 | 226.78 | 614 | 618 | 145.0 |
| C | 0 | 10 | 28473 | 192.09 | 614 | 618 | 145.0 |
| D | 2 | 249 | 1499626 | 10272.44 | 579 | 561 | 145.9 |
| D | 12 | 227 | 584491 | 4001.42 | 579 | 561 | 145.9 |
| D | 2 | 250 | 198740 | 1358.03 | 579 | 561 | 145.9 |
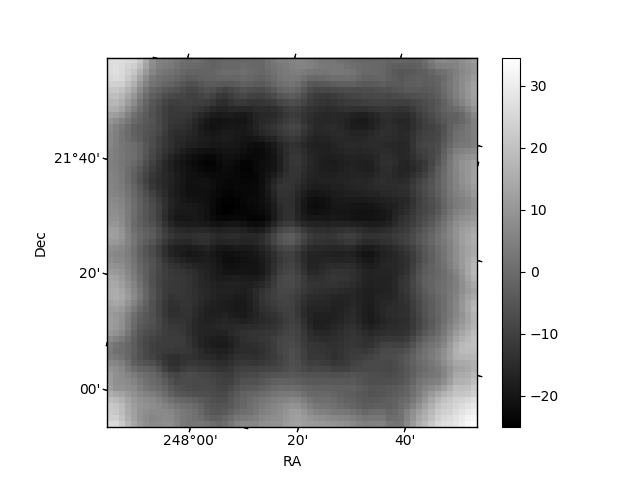
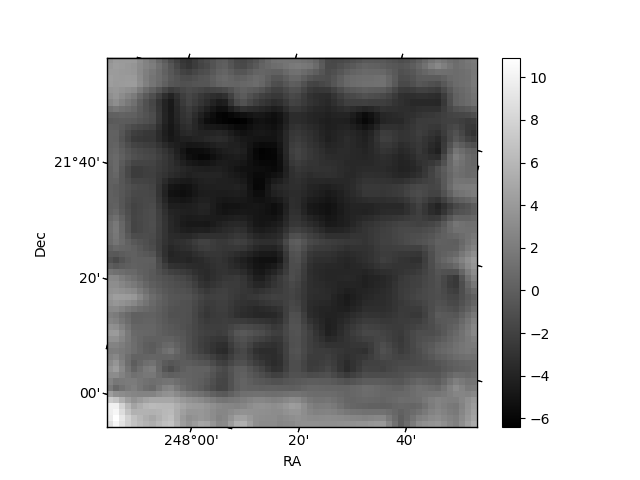
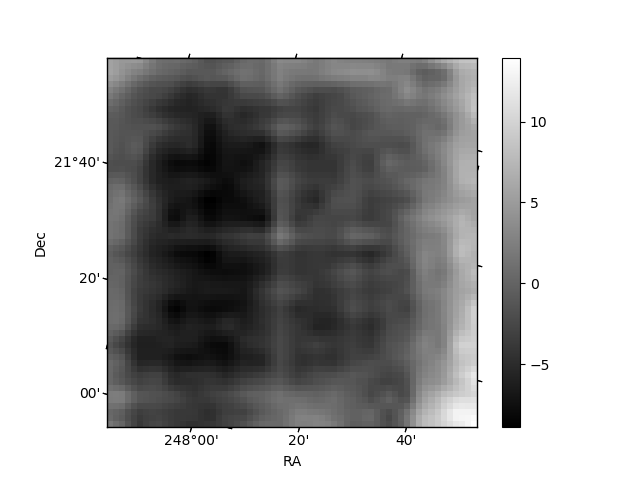
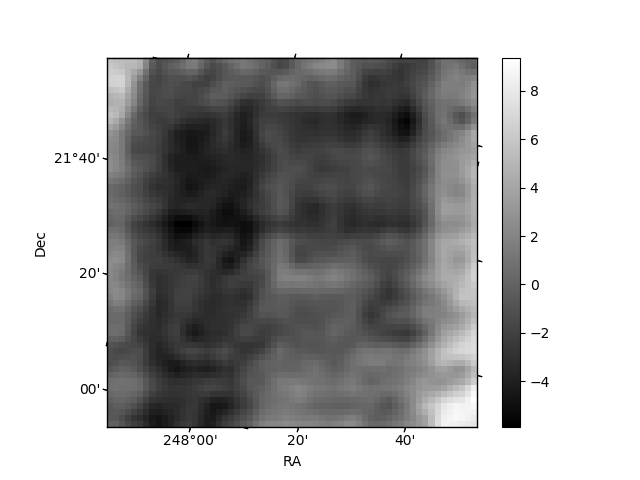
Histogram calculated using DETX and DETY for each event in the final _common_clean file
| Quadrant A | 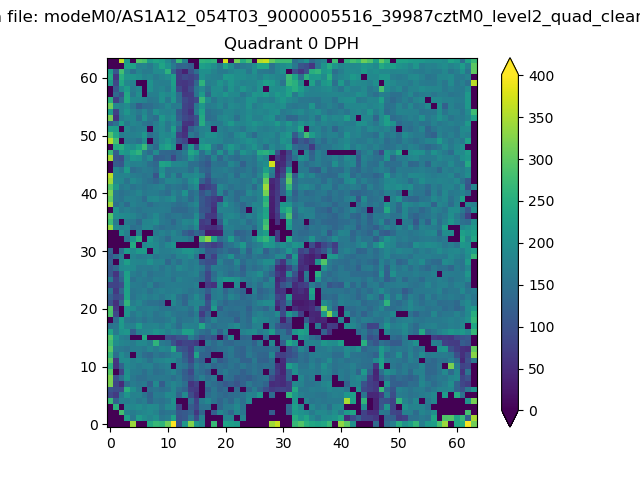 |
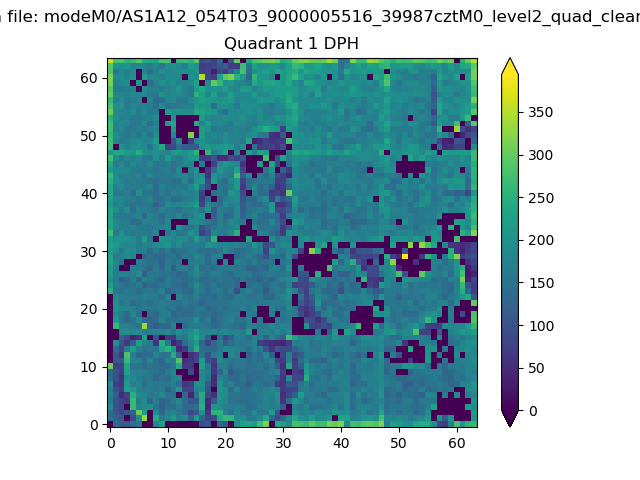 |
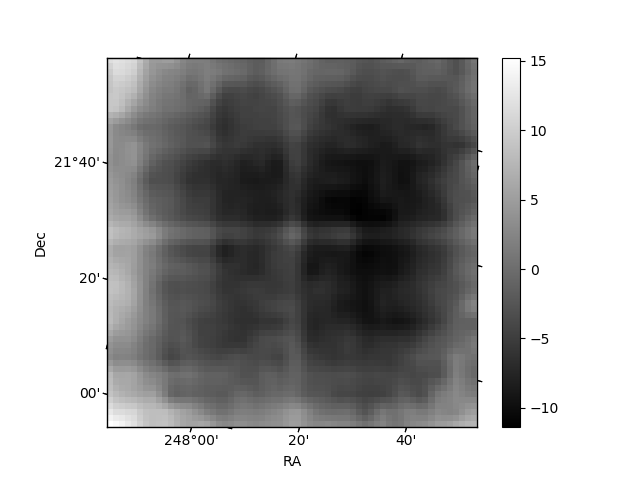
Quadrant B |
|---|---|---|---|
| Quadrant D | 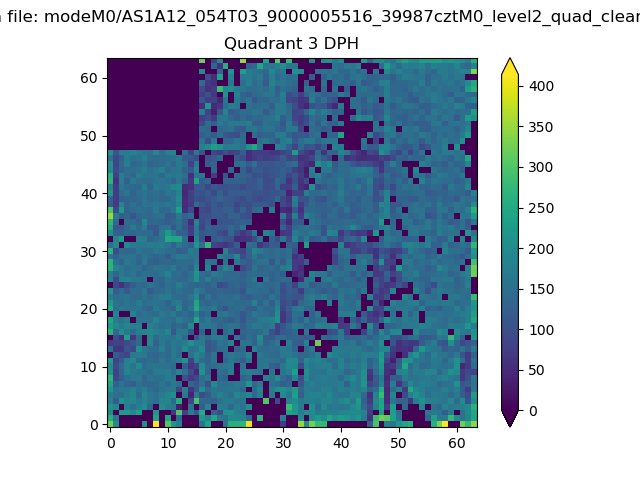 |
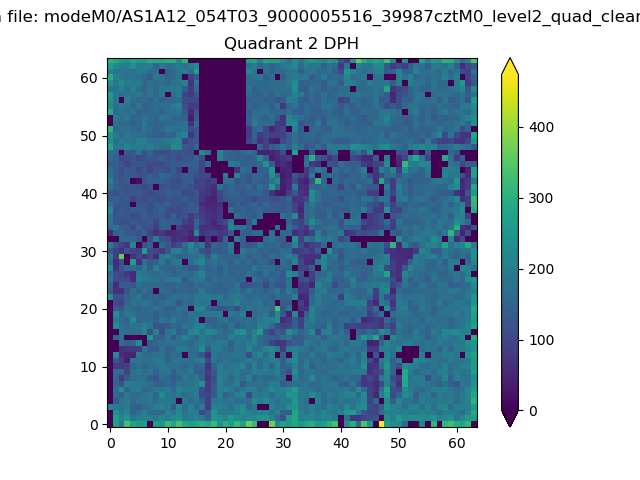 |
Quadrant C |
| Plot type | Count rate plots | Images |
|---|---|---|
| Comparison with Poisson distribution Blue bars denote a histogram of data divided into 1 sec bins. Red curve is a Poisson curve with rate = median count rate of data. |
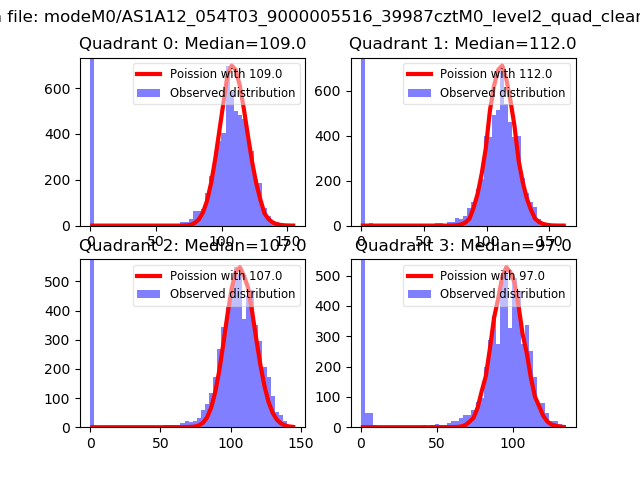 |
 |
| Quadrant-wise count rates Data is divided into 100 sec bins |
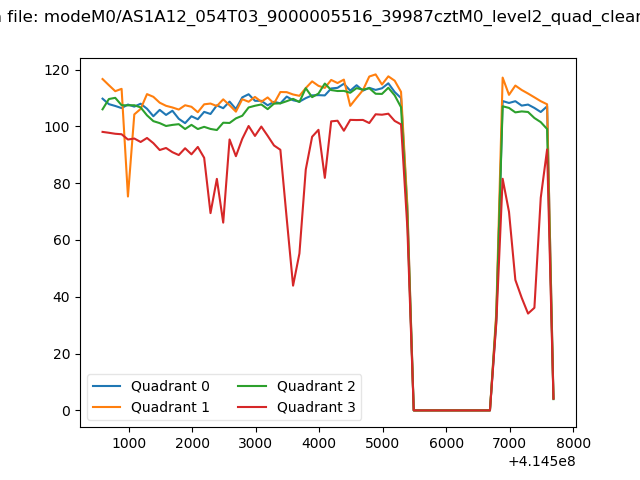 |
|
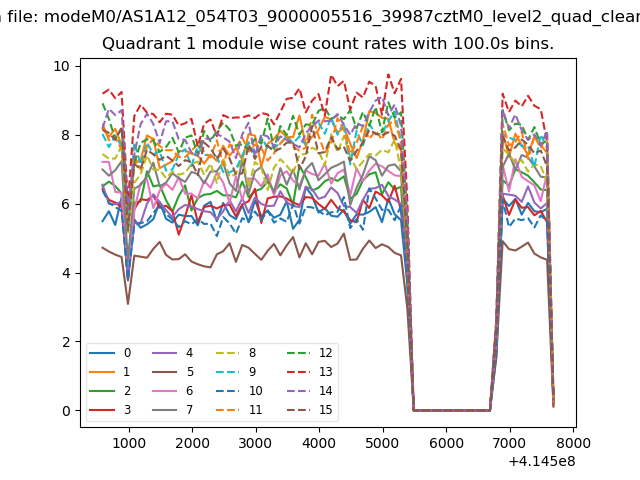
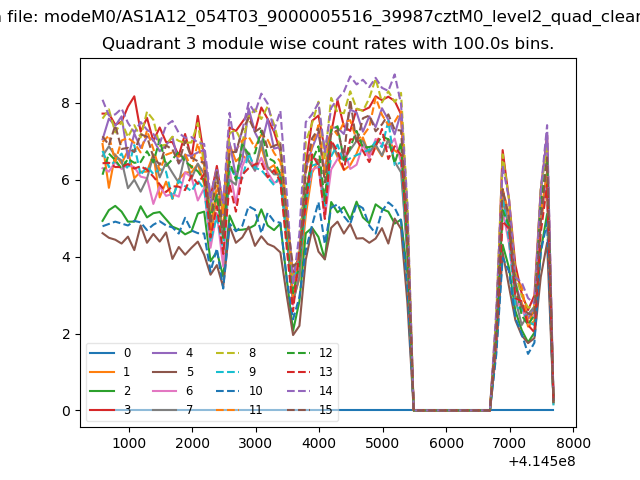
| Module-wise count rates for Quadrant A Data is divided into 100 sec bins |
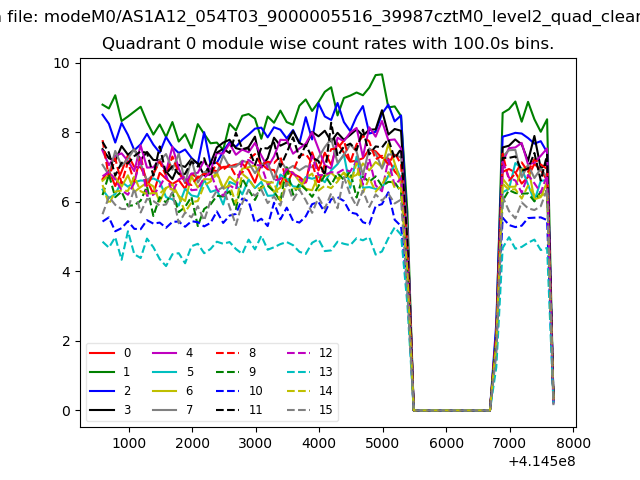 |
 |
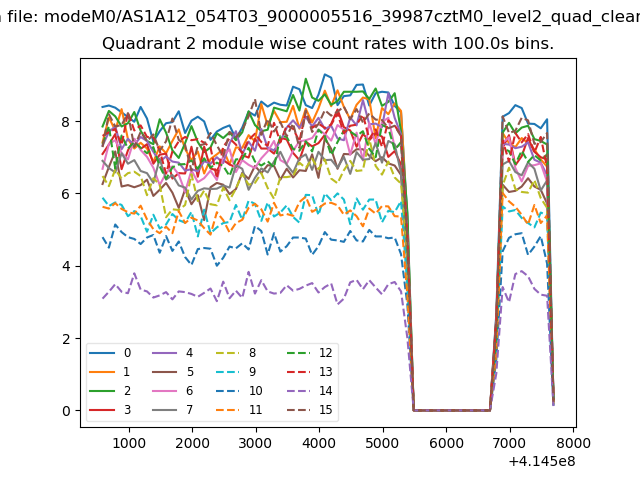
| Module-wise count rates for Quadrant B Data is divided into 100 sec bins |
 |
 |
| Module-wise count rates for Quadrant C Data is divided into 100 sec bins |
 |
 |
| Module-wise count rates for Quadrant D Data is divided into 100 sec bins |
 |
 |
| Parameter | Plot |
|---|---|
| CZT HV Monitor | 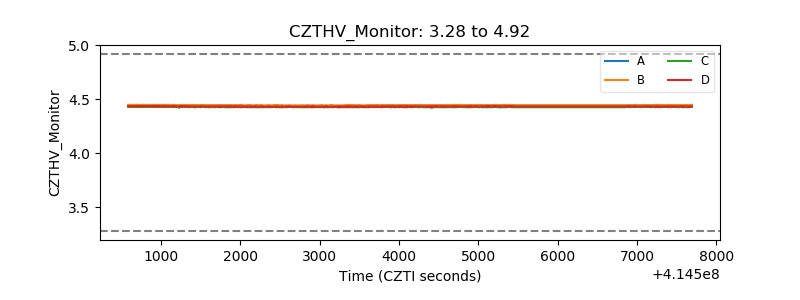 |
| D_VDD | 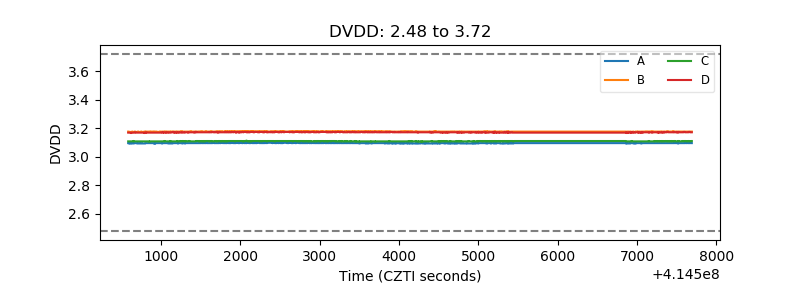 |
| Temperature 1 | 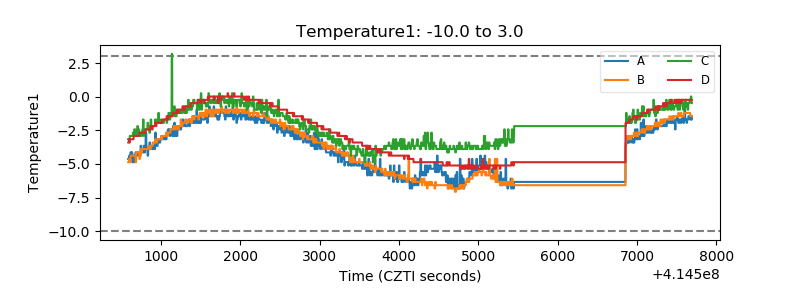 |
| Veto HV Monitor | 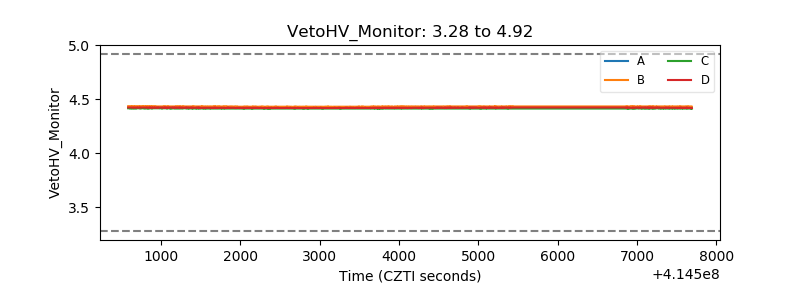 |
| Veto LLD | 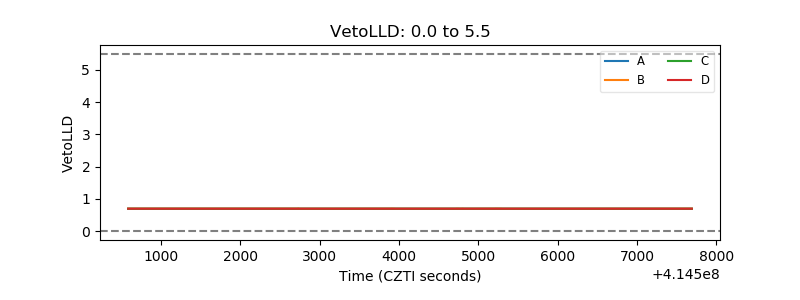 |
| Alpha Counter | 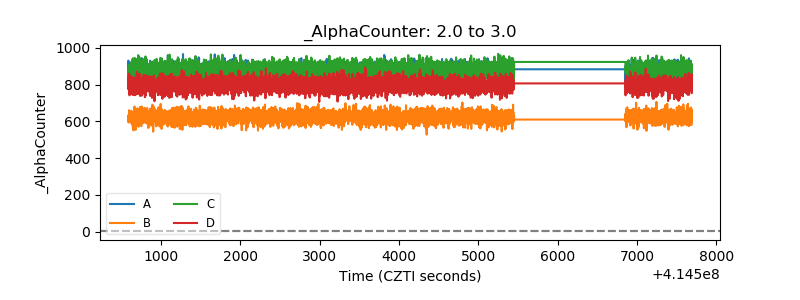 |
| _CPM_Rate | 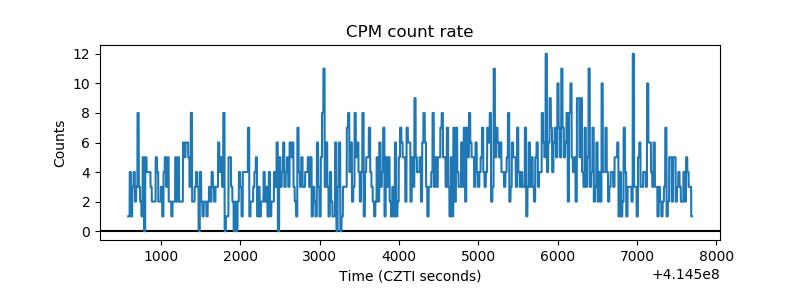 |
| CZT Counter | 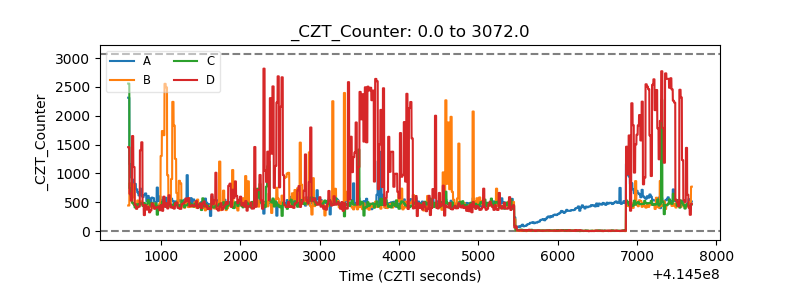 |
| +2.5 Volts monitor |  |
| +5 Volts monitor | 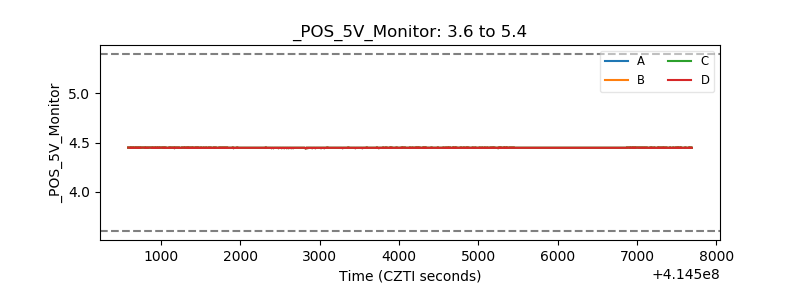 |
| _ROLL_ROT | 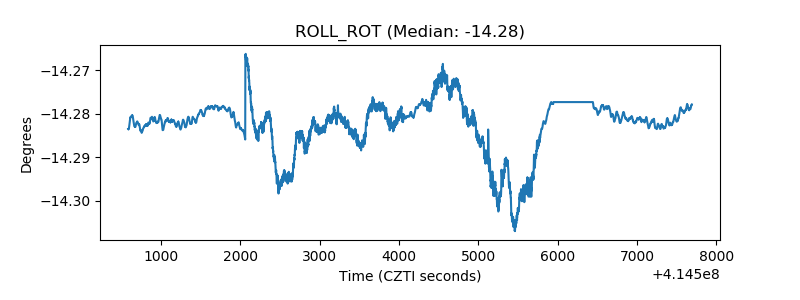 |
| _Roll_DEC | 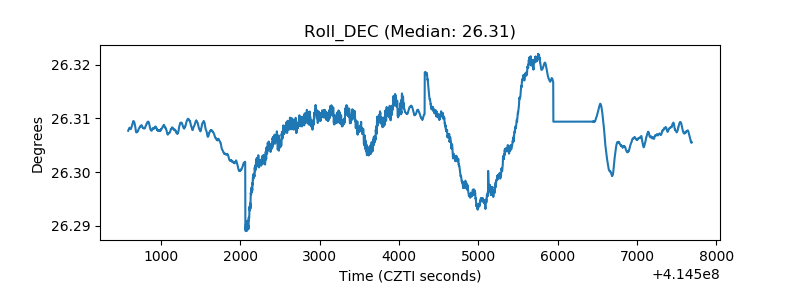 |
| _Roll_RA | 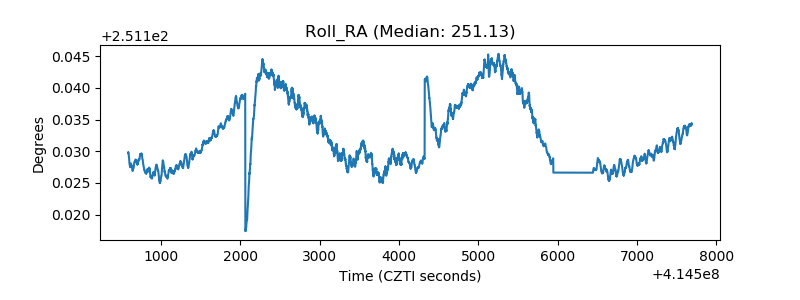 |
| Veto Counter | 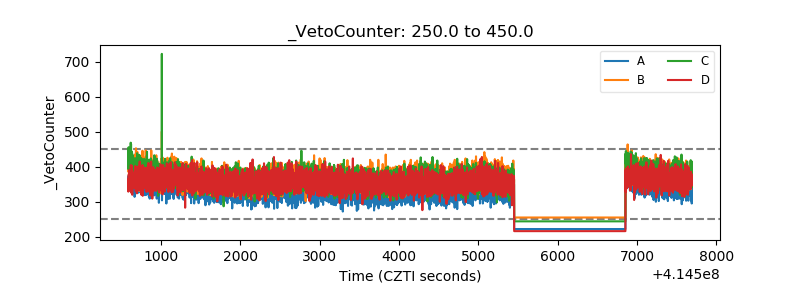 |