| Param | Original file | Final file |
|---|---|---|
| Filename | modeM0/AS1A12_054T03_9000005516_39988cztM0_level2.fits | modeM0/AS1A12_054T03_9000005516_39988cztM0_level2_quad_clean.evt |
| Size (bytes) | 485,614,080 | 91,978,560 |
| Size | 463.1 MB | 87.7 MB |
| Events in quadrant A | 3,189,082 | 642,052 |
| Events in quadrant B | 3,317,996 | 650,681 |
| Events in quadrant C | 2,801,274 | 626,049 |
| Events in quadrant D | 8,206,500 | 452,116 |
| Mode M9 | |||
|---|---|---|---|
| Quadrant | BADHDUFLAG | Total packets | Discarded packets |
| A | 0 | 17 | 0 |
| B | 0 | 17 | 0 |
| C | 0 | 17 | 0 |
| D | 0 | 18 | 0 |
| Mode SS | |||
|---|---|---|---|
| Quadrant | BADHDUFLAG | Total packets | Discarded packets |
| A | 0 | 118 | 0 |
| B | 0 | 118 | 0 |
| C | 0 | 118 | 0 |
| D | 0 | 118 | 0 |
| Mode M0 | |||
|---|---|---|---|
| Quadrant | BADHDUFLAG | Total packets | Discarded packets |
| A | 0 | 12997 | 3 |
| B | 0 | 13804 | 2 |
| C | 0 | 12066 | 2 |
| D | 0 | 28470 | 2 |
| Quadrant | Total seconds | Saturated seconds | Saturation percentage |
|---|---|---|---|
| A | 5932 | 30 | 0.505732% |
| B | 5932 | 122 | 2.056642% |
| C | 5932 | 12 | 0.202293% |
| D | 5932 | 1608 | 27.107215% |
Noise dominated data is calculated using 1-second bins in cleaned event files. If a bin has >2000 counts, and if more than 50% of those come from <1% of pixels, then it is considered to be noise-dominated and hence unusable.
| Quadrant | # 1 sec bins | Bins with >0 counts | Bins with >2000 counts | High rate bins dominated by noise | Noise dominated (total time) | Noise dominated (detector-on time) | Marked lightcurve |
|---|---|---|---|---|---|---|---|
| A | 7245 | 5933 | 21 | 21 | 0.29% | 0.35% | 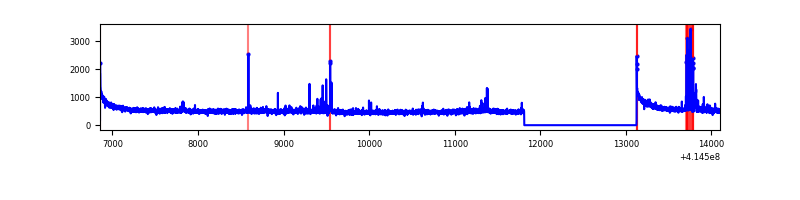 |
| B | 7245 | 5933 | 74 | 74 | 1.02% | 1.25% | 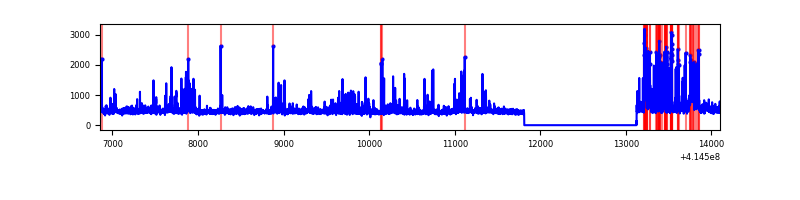 |
| C | 7245 | 5933 | 13 | 13 | 0.18% | 0.22% | 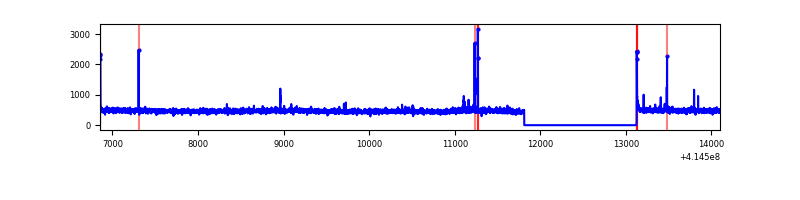 |
| D | 7245 | 5933 | 1638 | 1638 | 22.61% | 27.61% | 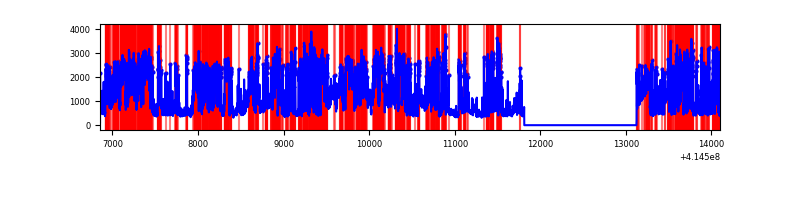 |
Top three noisy pixels from each quadrant. If the there are fewer than three noisy pixels in the level2.evt file, extra rows are filled as -1
| Pixel properties | Quadrant properties | ||||||
|---|---|---|---|---|---|---|---|
| Quadrant | DetID | PixID | Counts | Sigma | Mean | Median | Sigma |
| A | 10 | 83 | 522500 | 3854.96 | 654 | 639 | 135.4 |
| A | 13 | 248 | 105989 | 778.21 | 654 | 639 | 135.4 |
| A | 2 | 79 | 16029 | 113.69 | 654 | 639 | 135.4 |
| B | 4 | 171 | 375615 | 2943.6 | 647 | 629 | 127.4 |
| B | 5 | 255 | 280483 | 2196.82 | 647 | 629 | 127.4 |
| B | 15 | 85 | 41380 | 319.89 | 647 | 629 | 127.4 |
| C | 15 | 214 | 249384 | 1654.1 | 637 | 638 | 150.4 |
| C | 14 | 254 | 27619 | 179.42 | 637 | 638 | 150.4 |
| C | 0 | 10 | 22636 | 146.28 | 637 | 638 | 150.4 |
| D | 12 | 227 | 4249607 | 29963.18 | 569 | 551 | 141.8 |
| D | 2 | 249 | 1036360 | 7304.24 | 569 | 551 | 141.8 |
| D | 13 | 249 | 316600 | 2228.69 | 569 | 551 | 141.8 |
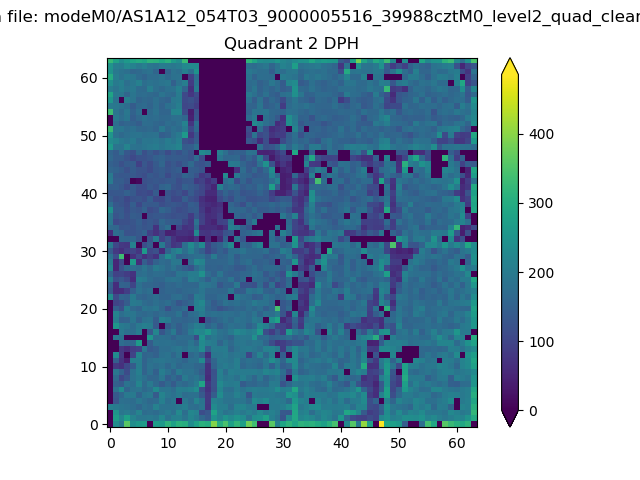
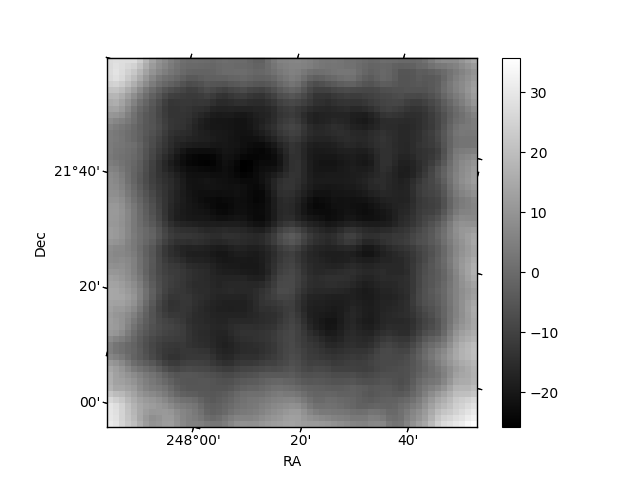
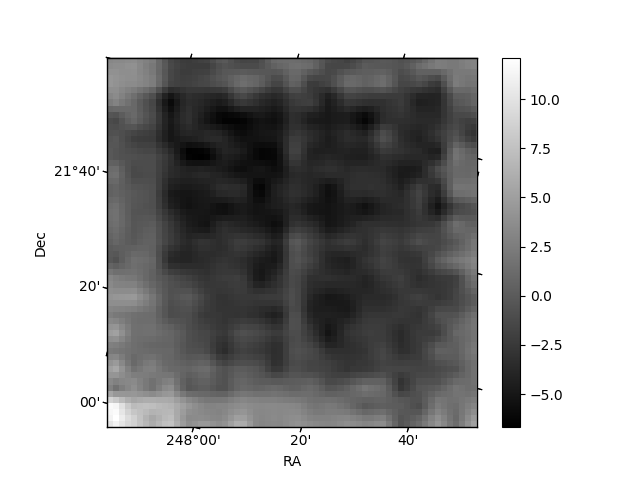
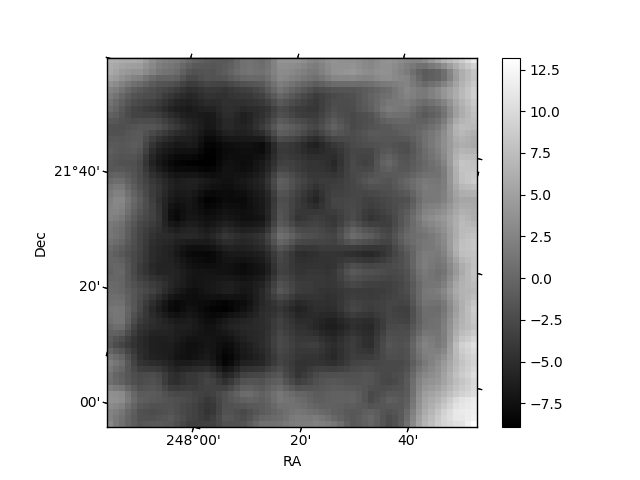
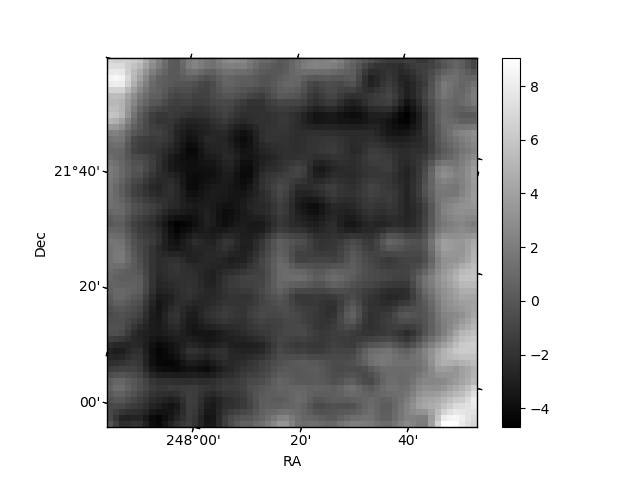
Histogram calculated using DETX and DETY for each event in the final _common_clean file
| Quadrant A | 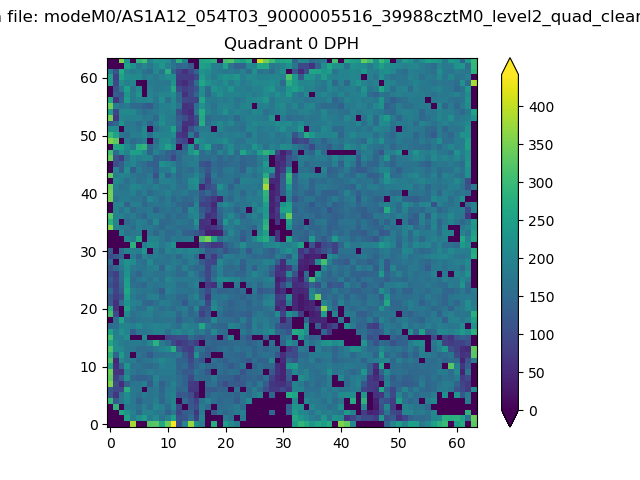 |
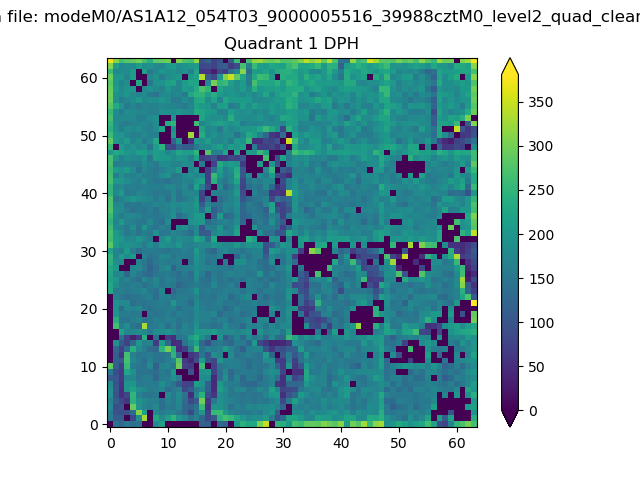 |
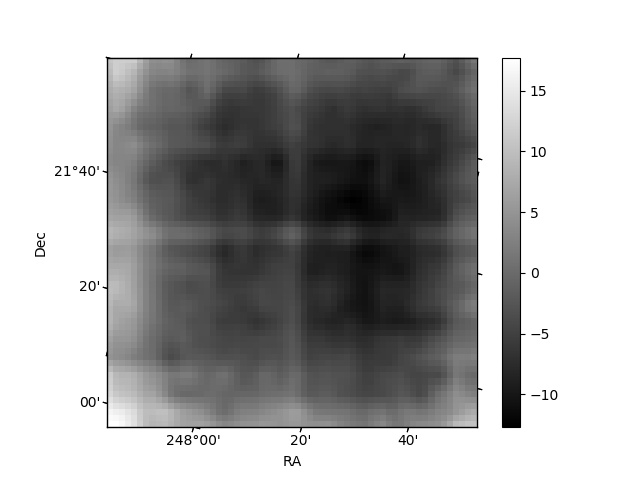
Quadrant B |
|---|---|---|---|
| Quadrant D | 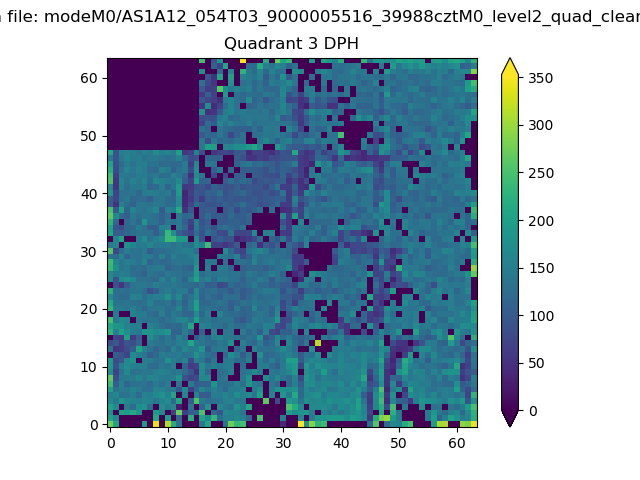 |
 |
Quadrant C |
| Plot type | Count rate plots | Images |
|---|---|---|
| Comparison with Poisson distribution Blue bars denote a histogram of data divided into 1 sec bins. Red curve is a Poisson curve with rate = median count rate of data. |
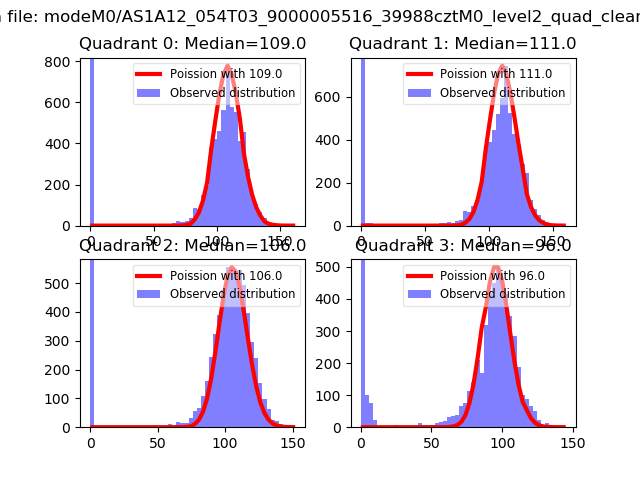 |
 |
| Quadrant-wise count rates Data is divided into 100 sec bins |
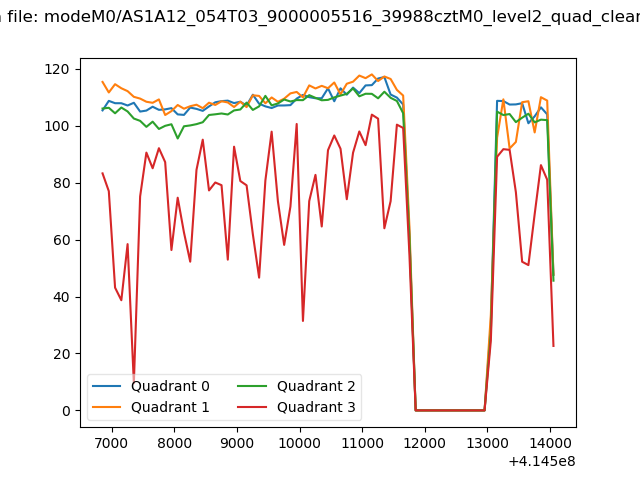 |
|
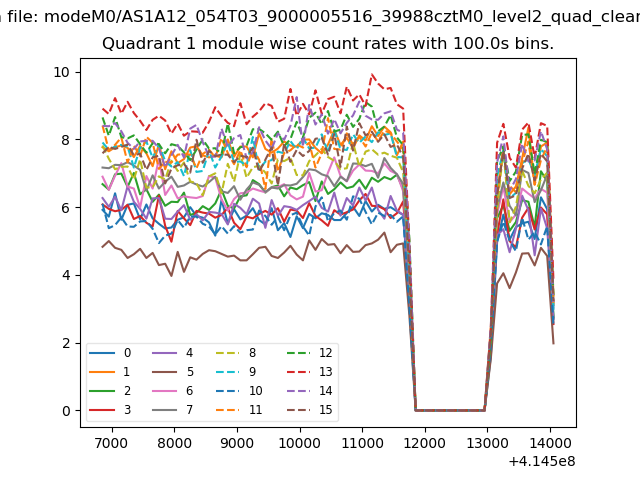
| Module-wise count rates for Quadrant A Data is divided into 100 sec bins |
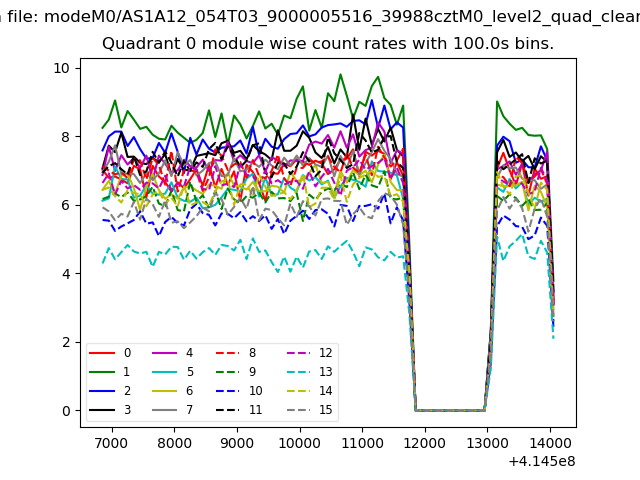 |
 |
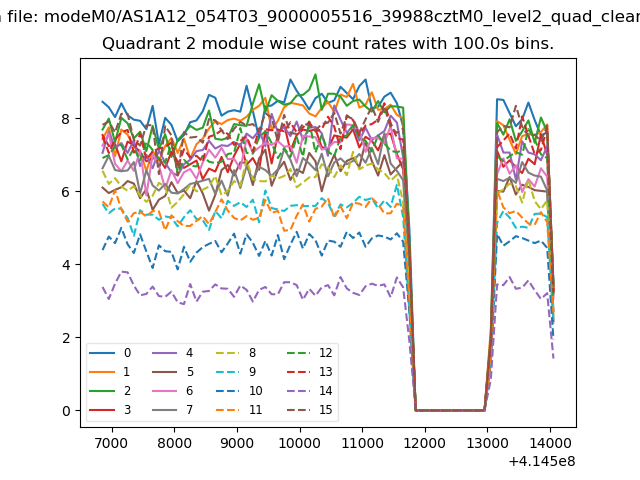
| Module-wise count rates for Quadrant B Data is divided into 100 sec bins |
 |
 |
| Module-wise count rates for Quadrant C Data is divided into 100 sec bins |
 |
 |
| Module-wise count rates for Quadrant D Data is divided into 100 sec bins |
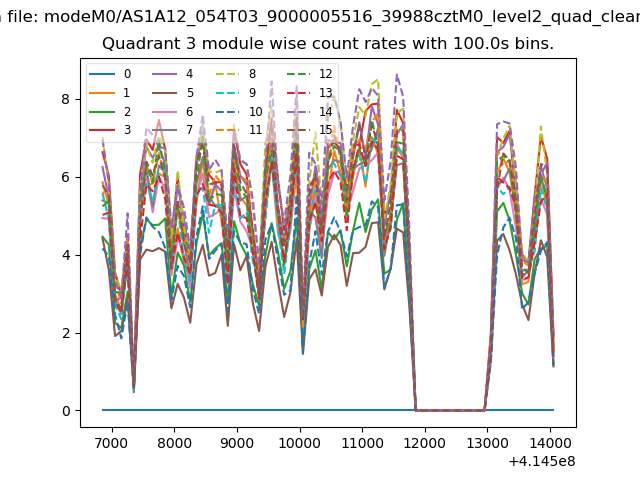 |
 |
| Parameter | Plot |
|---|---|
| CZT HV Monitor | 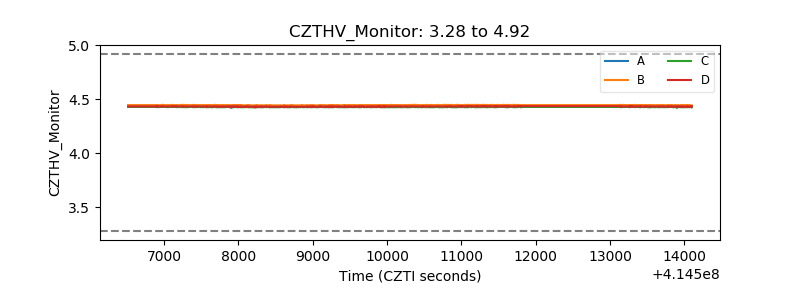 |
| D_VDD | 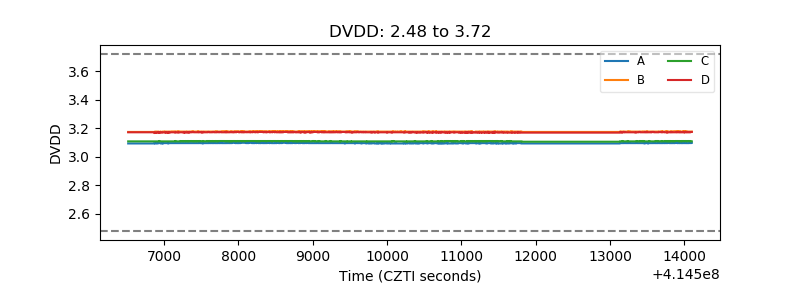 |
| Temperature 1 | 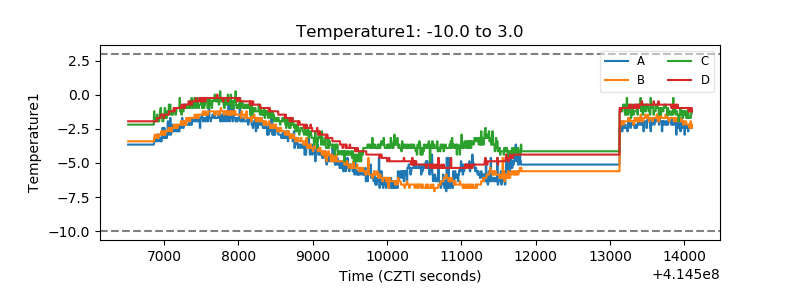 |
| Veto HV Monitor | 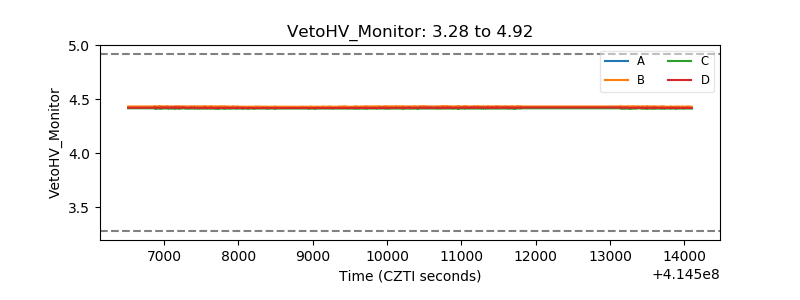 |
| Veto LLD | 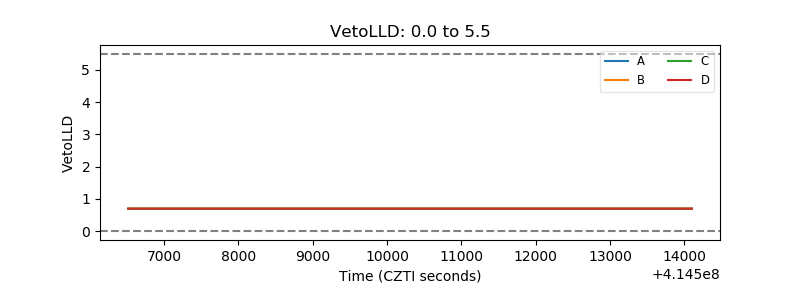 |
| Alpha Counter | 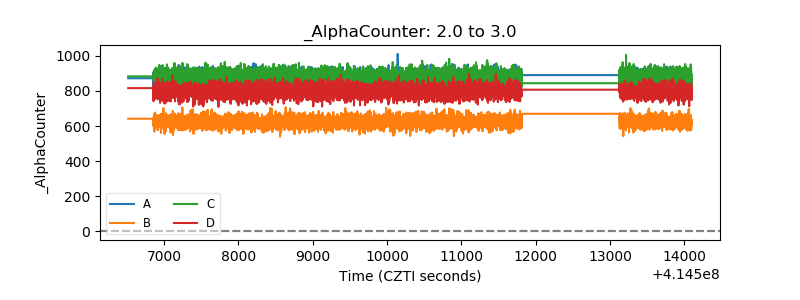 |
| _CPM_Rate | 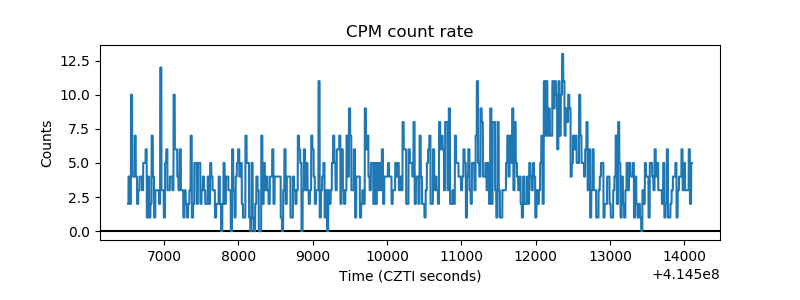 |
| CZT Counter | 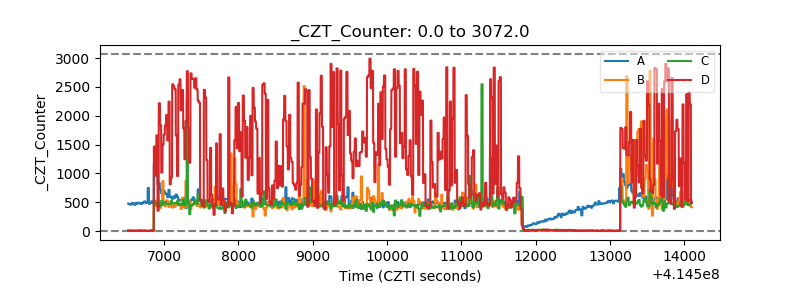 |
| +2.5 Volts monitor | 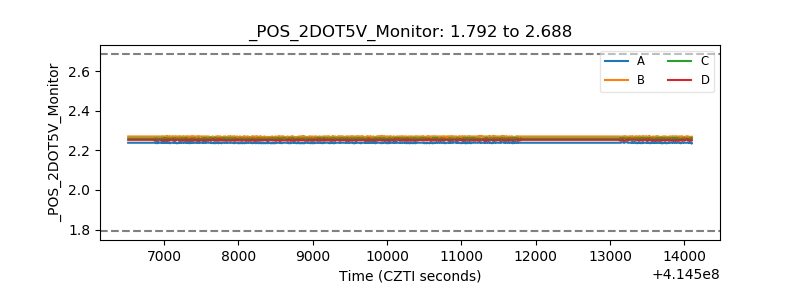 |
| +5 Volts monitor | 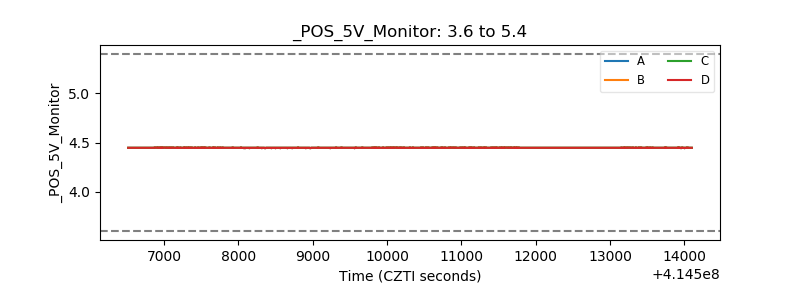 |
| _ROLL_ROT | 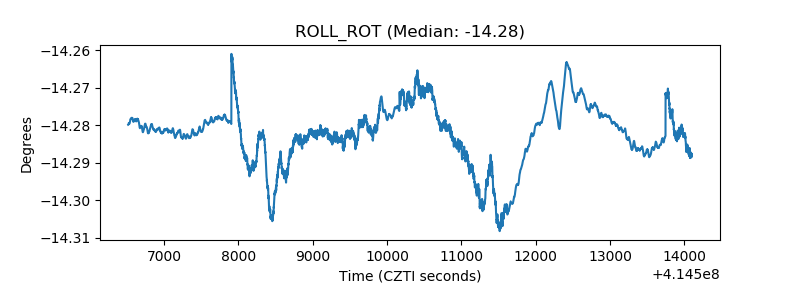 |
| _Roll_DEC | 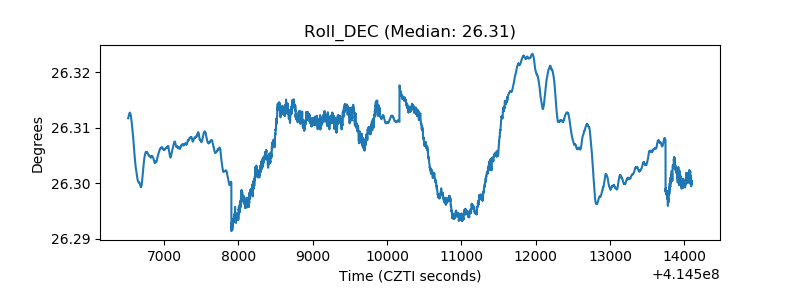 |
| _Roll_RA | 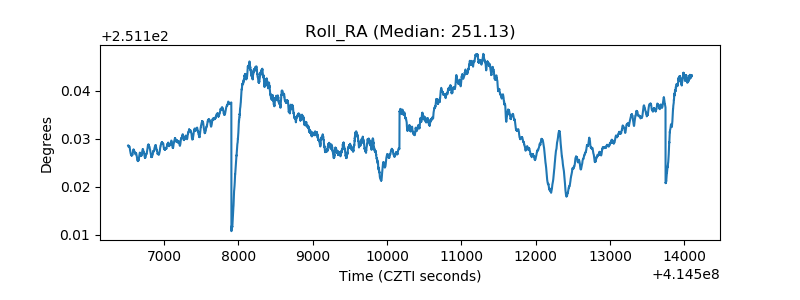 |
| Veto Counter | 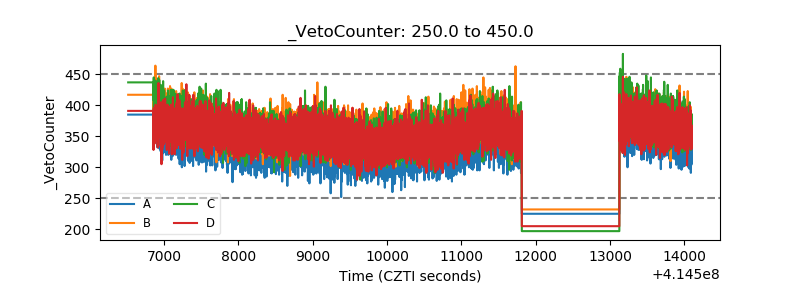 |