| Param | Original file | Final file |
|---|---|---|
| Filename | modeM0/AS1A12_054T03_9000005516_39991cztM0_level2.fits | modeM0/AS1A12_054T03_9000005516_39991cztM0_level2_quad_clean.evt |
| Size (bytes) | 1,014,534,720 | 242,688,960 |
| Size | 967.5 MB | 231.4 MB |
| Events in quadrant A | 8,121,804 | 1,637,997 |
| Events in quadrant B | 8,964,599 | 1,655,052 |
| Events in quadrant C | 7,221,414 | 1,623,779 |
| Events in quadrant D | 12,053,338 | 1,367,627 |
| Mode M9 | |||
|---|---|---|---|
| Quadrant | BADHDUFLAG | Total packets | Discarded packets |
| A | 0 | 52 | 0 |
| B | 0 | 52 | 0 |
| C | 0 | 52 | 0 |
| D | 0 | 53 | 0 |
| Mode SS | |||
|---|---|---|---|
| Quadrant | BADHDUFLAG | Total packets | Discarded packets |
| A | 0 | 314 | 0 |
| B | 0 | 314 | 0 |
| C | 0 | 314 | 0 |
| D | 0 | 314 | 0 |
| Mode M0 | |||
|---|---|---|---|
| Quadrant | BADHDUFLAG | Total packets | Discarded packets |
| A | 0 | 33778 | 5 |
| B | 0 | 37052 | 4 |
| C | 0 | 31284 | 4 |
| D | 0 | 46944 | 4 |
| Quadrant | Total seconds | Saturated seconds | Saturation percentage |
|---|---|---|---|
| A | 15409 | 113 | 0.733338% |
| B | 15409 | 476 | 3.089104% |
| C | 15409 | 26 | 0.168733% |
| D | 15409 | 1350 | 8.761114% |
Noise dominated data is calculated using 1-second bins in cleaned event files. If a bin has >2000 counts, and if more than 50% of those come from <1% of pixels, then it is considered to be noise-dominated and hence unusable.
| Quadrant | # 1 sec bins | Bins with >0 counts | Bins with >2000 counts | High rate bins dominated by noise | Noise dominated (total time) | Noise dominated (detector-on time) | Marked lightcurve |
|---|---|---|---|---|---|---|---|
| A | 19679 | 15412 | 74 | 74 | 0.38% | 0.48% | 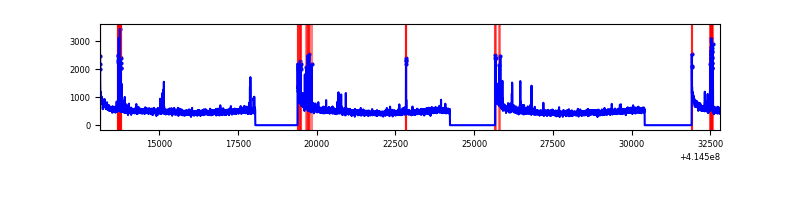 |
| B | 19679 | 15412 | 340 | 340 | 1.73% | 2.21% | 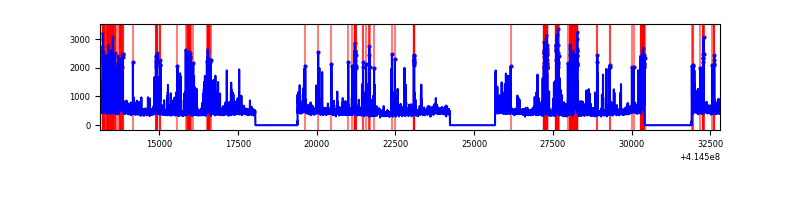 |
| C | 19679 | 15412 | 20 | 20 | 0.10% | 0.13% | 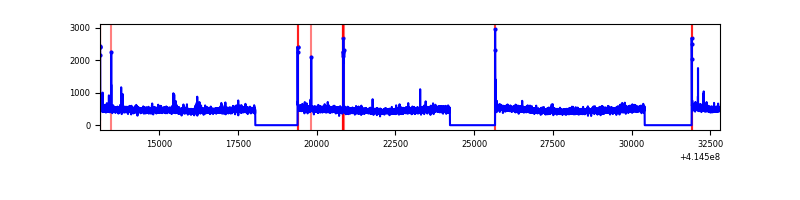 |
| D | 19679 | 15412 | 1196 | 1196 | 6.08% | 7.76% | 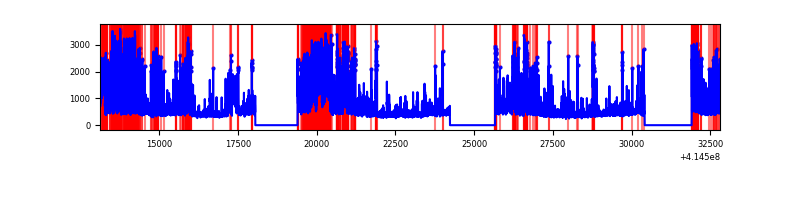 |
Top three noisy pixels from each quadrant. If the there are fewer than three noisy pixels in the level2.evt file, extra rows are filled as -1
| Pixel properties | Quadrant properties | ||||||
|---|---|---|---|---|---|---|---|
| Quadrant | DetID | PixID | Counts | Sigma | Mean | Median | Sigma |
| A | 10 | 83 | 1207186 | 3517.33 | 1685 | 1648 | 342.7 |
| A | 13 | 248 | 310784 | 901.95 | 1685 | 1648 | 342.7 |
| A | 2 | 79 | 34898 | 97.01 | 1685 | 1648 | 342.7 |
| B | 4 | 171 | 1499303 | 4677.1 | 1665 | 1618 | 320.2 |
| B | 5 | 255 | 679472 | 2116.86 | 1665 | 1618 | 320.2 |
| B | 0 | 230 | 73177 | 223.47 | 1665 | 1618 | 320.2 |
| C | 15 | 214 | 632553 | 1632.58 | 1654 | 1665 | 386.4 |
| C | 0 | 10 | 51890 | 129.97 | 1654 | 1665 | 386.4 |
| C | 14 | 254 | 25404 | 61.43 | 1654 | 1665 | 386.4 |
| D | 12 | 227 | 2726590 | 7004.37 | 1592 | 1547 | 389.0 |
| D | 12 | 233 | 1311607 | 3367.34 | 1592 | 1547 | 389.0 |
| D | 2 | 250 | 939285 | 2410.33 | 1592 | 1547 | 389.0 |
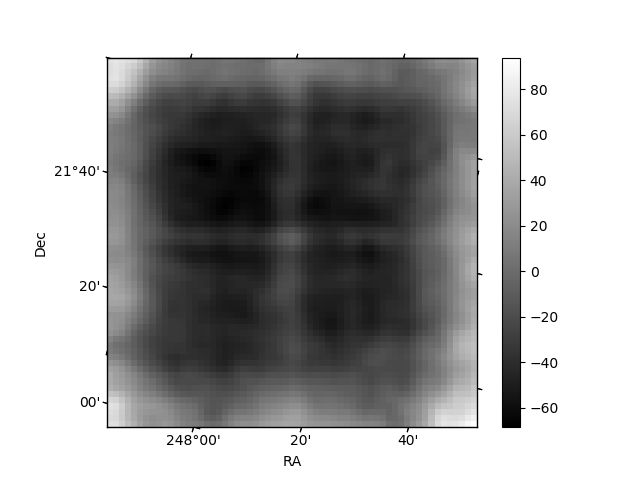
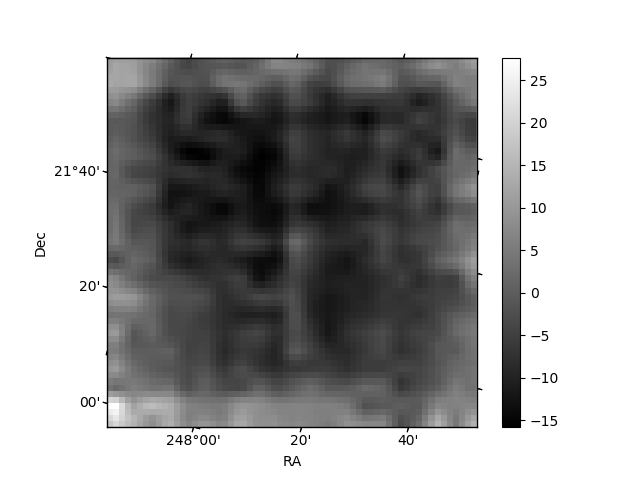
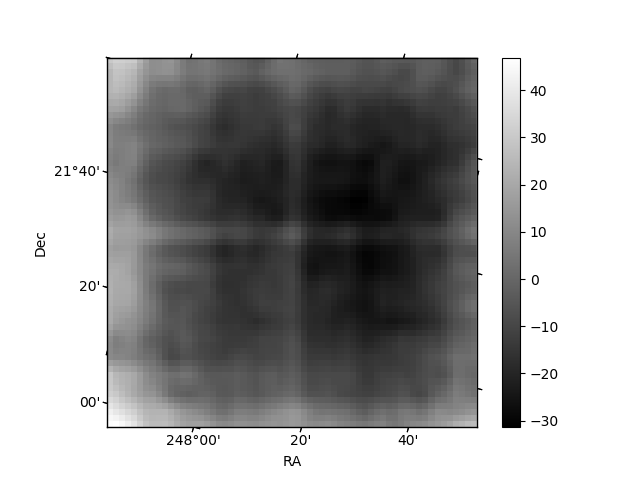
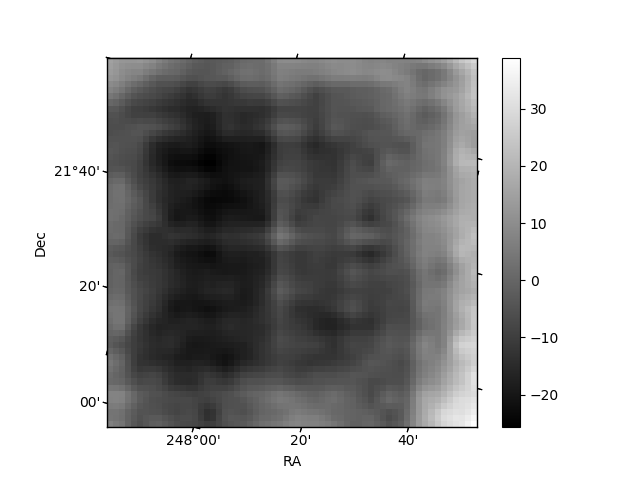
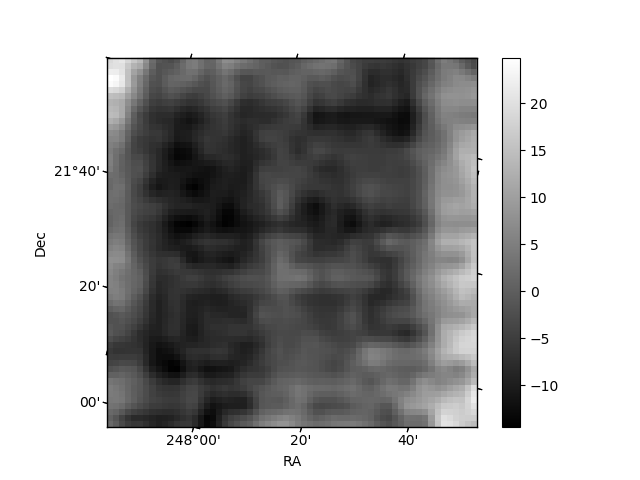
Histogram calculated using DETX and DETY for each event in the final _common_clean file
| Quadrant A | 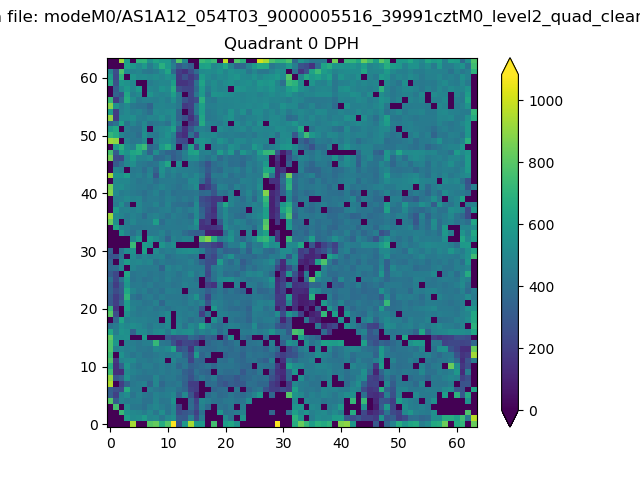 |
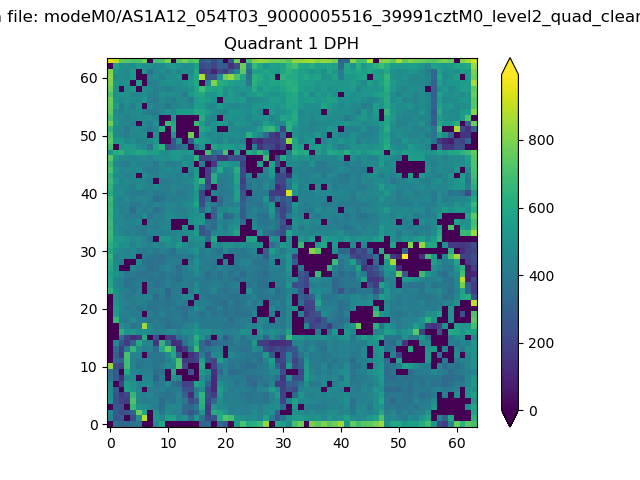 |
Quadrant B |
|---|---|---|---|
| Quadrant D | 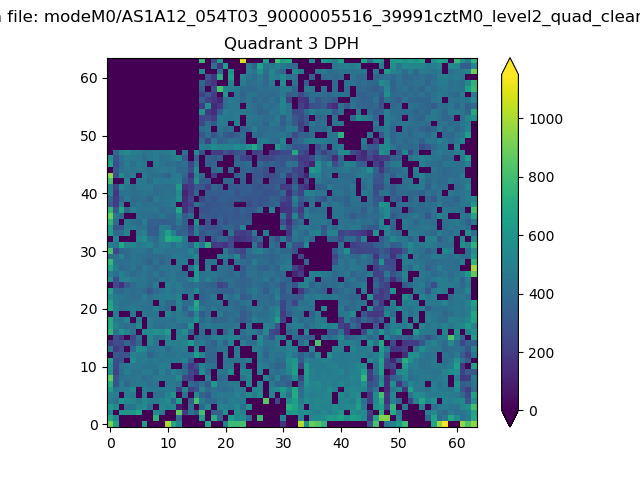 |
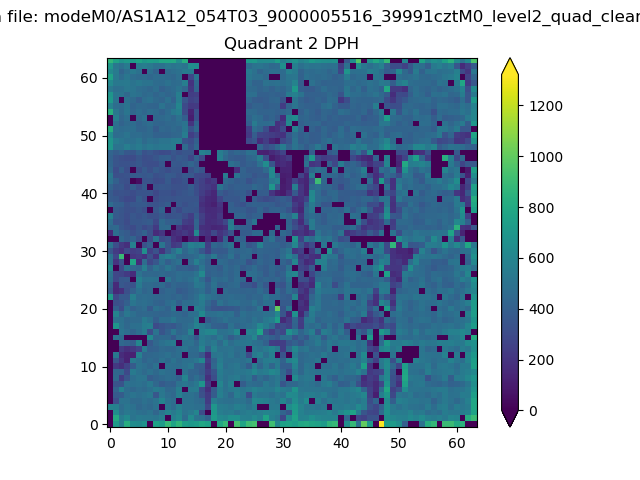 |
Quadrant C |
| Plot type | Count rate plots | Images |
|---|---|---|
| Comparison with Poisson distribution Blue bars denote a histogram of data divided into 1 sec bins. Red curve is a Poisson curve with rate = median count rate of data. |
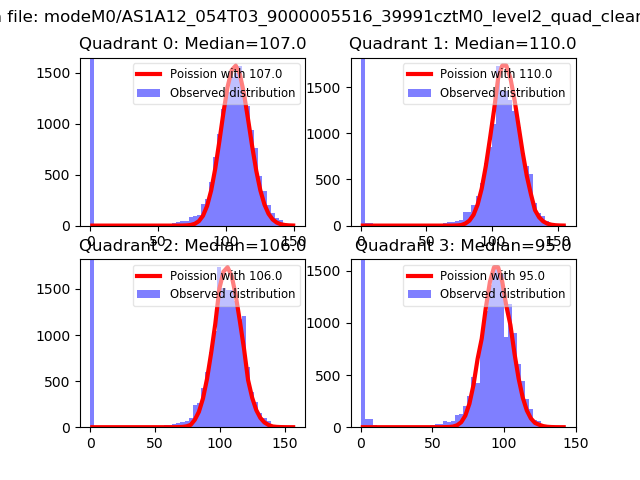 |
 |
| Quadrant-wise count rates Data is divided into 100 sec bins |
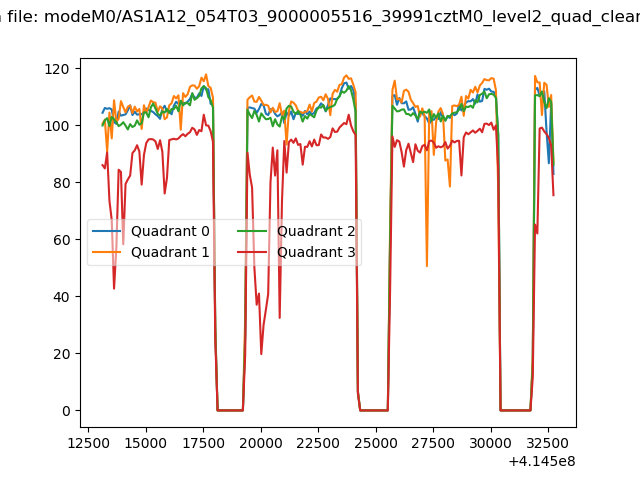 |
|
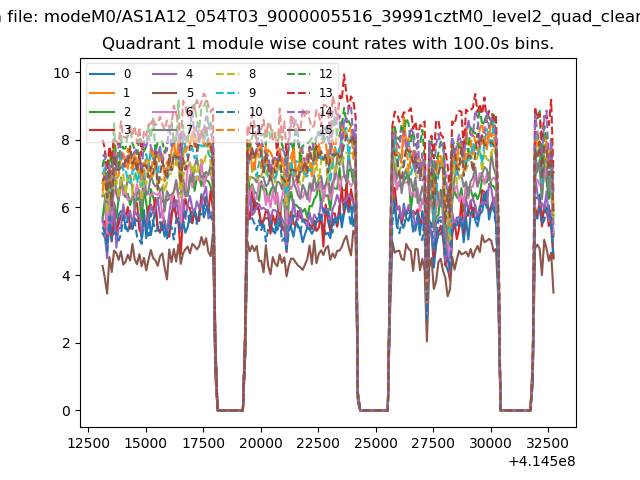
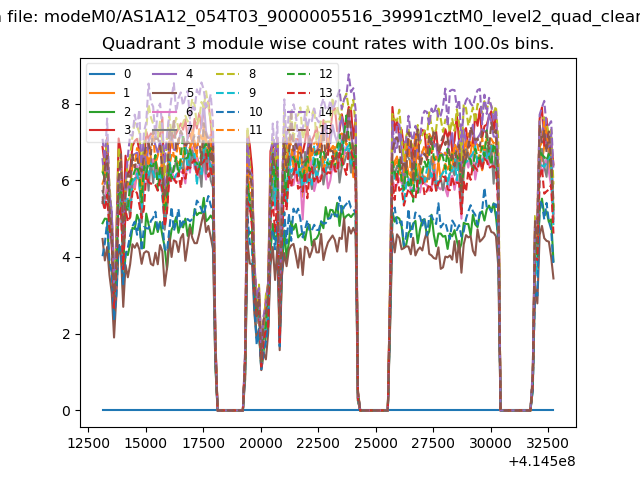
| Module-wise count rates for Quadrant A Data is divided into 100 sec bins |
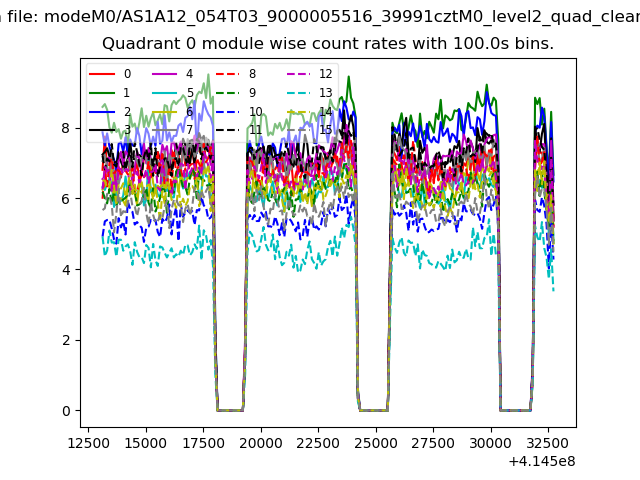 |
 |
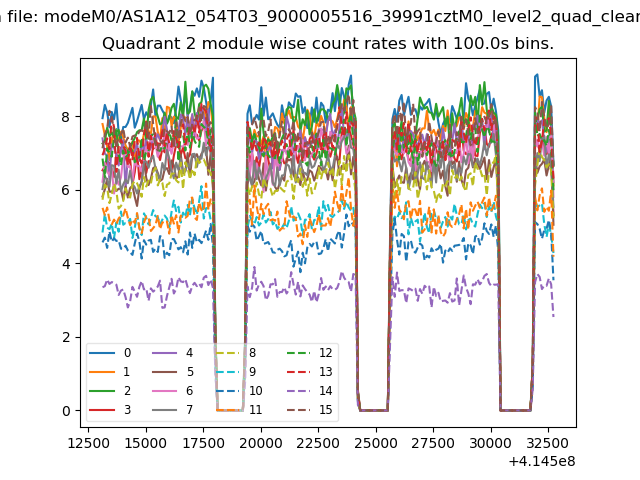
| Module-wise count rates for Quadrant B Data is divided into 100 sec bins |
 |
 |
| Module-wise count rates for Quadrant C Data is divided into 100 sec bins |
 |
 |
| Module-wise count rates for Quadrant D Data is divided into 100 sec bins |
 |
 |
| Parameter | Plot |
|---|---|
| CZT HV Monitor | 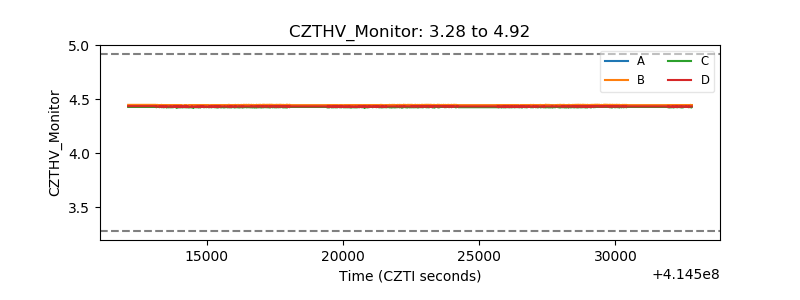 |
| D_VDD | 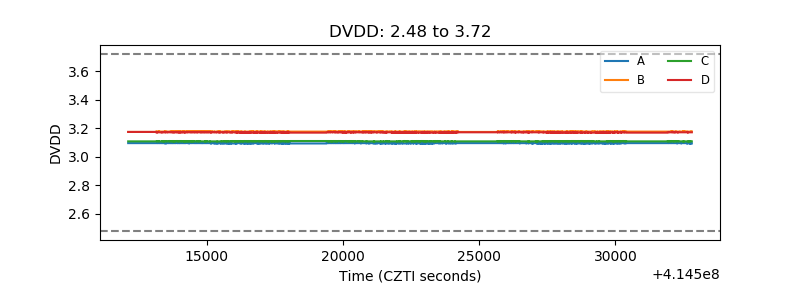 |
| Temperature 1 | 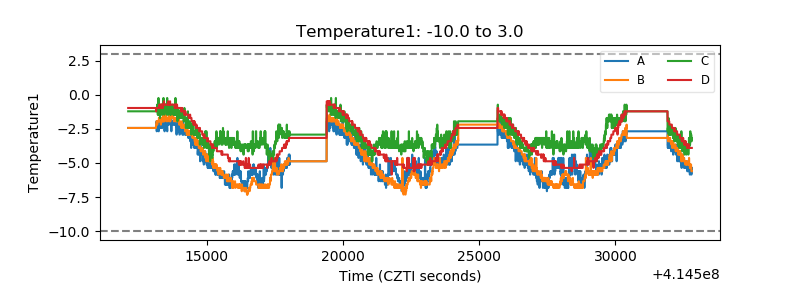 |
| Veto HV Monitor | 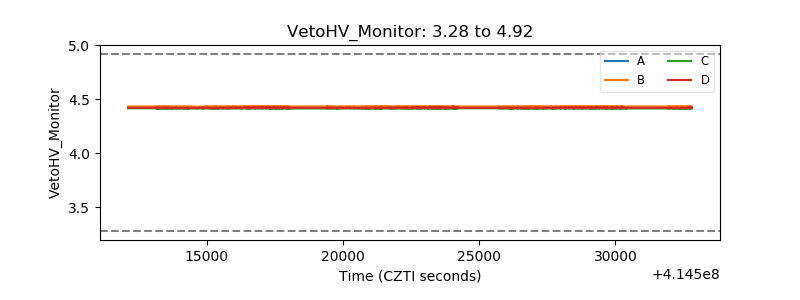 |
| Veto LLD | 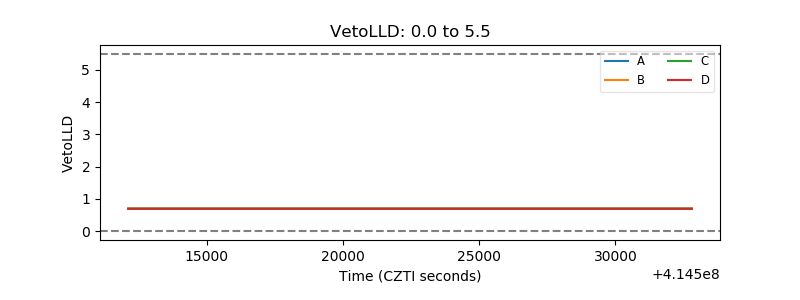 |
| Alpha Counter | 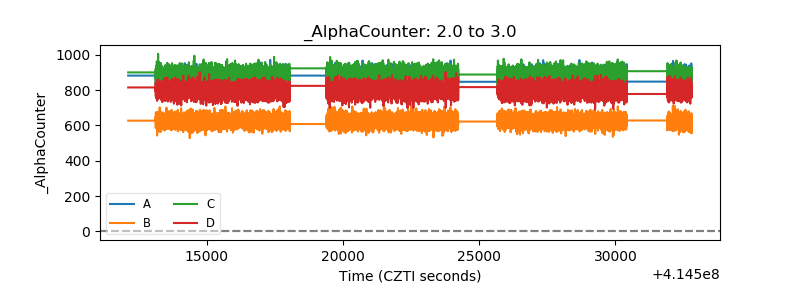 |
| _CPM_Rate | 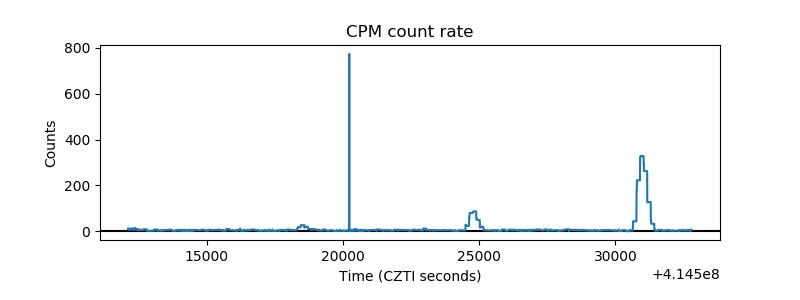 |
| CZT Counter | 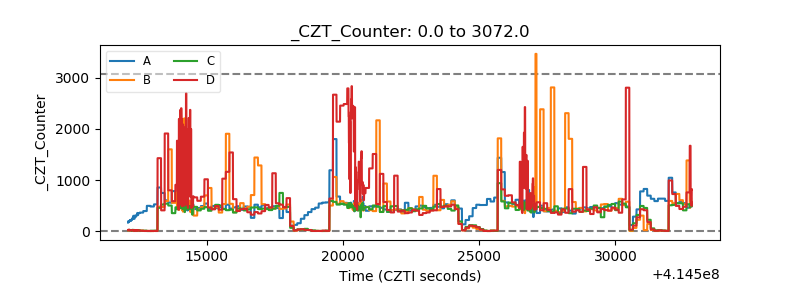 |
| +2.5 Volts monitor | 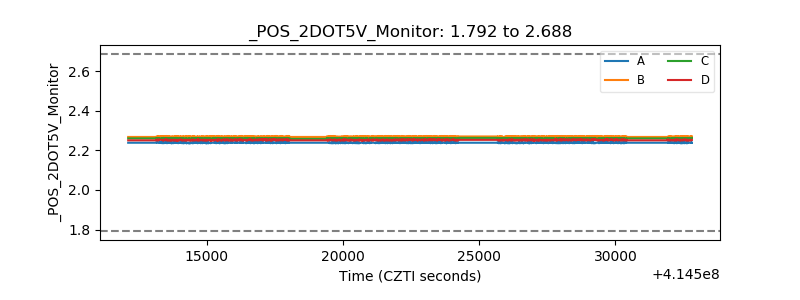 |
| +5 Volts monitor | 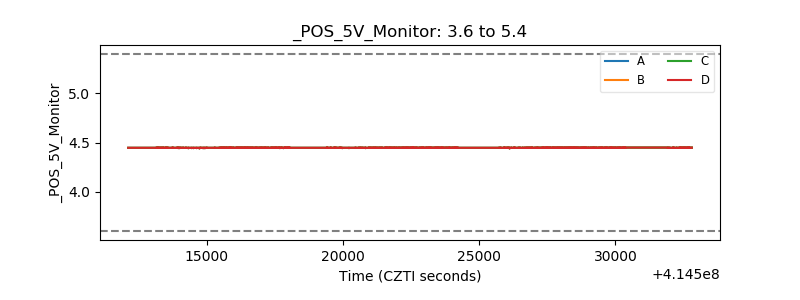 |
| _ROLL_ROT | 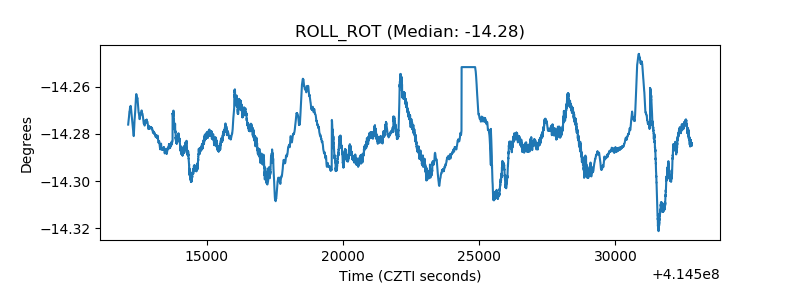 |
| _Roll_DEC | 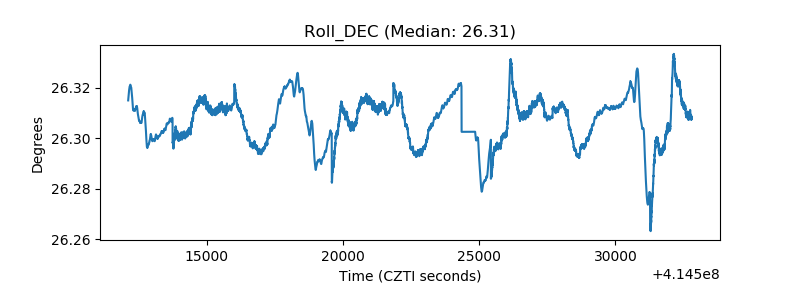 |
| _Roll_RA | 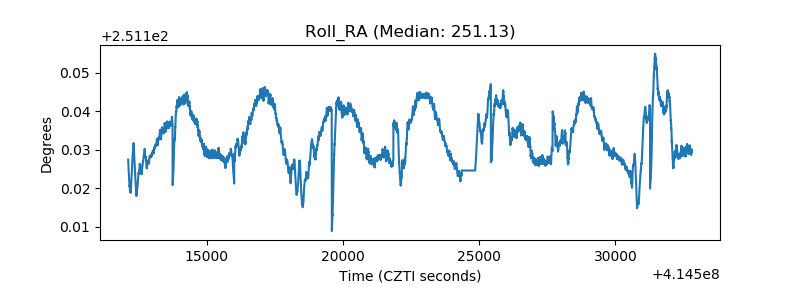 |
| Veto Counter | 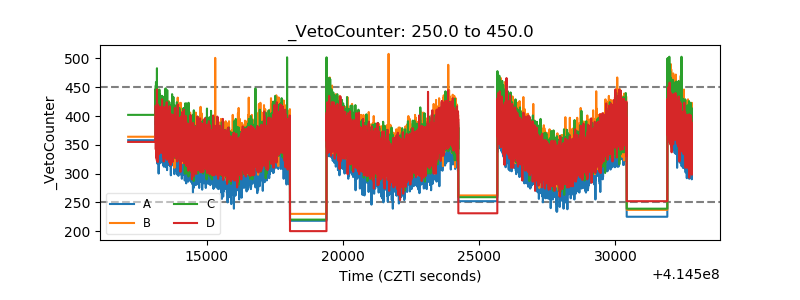 |