| Param | Original file | Final file |
|---|---|---|
| Filename | modeM0/AS1A12_054T03_9000005516_39992cztM0_level2.fits | modeM0/AS1A12_054T03_9000005516_39992cztM0_level2_quad_clean.evt |
| Size (bytes) | 338,397,120 | 91,808,640 |
| Size | 322.7 MB | 87.6 MB |
| Events in quadrant A | 3,005,642 | 605,616 |
| Events in quadrant B | 2,786,108 | 628,301 |
| Events in quadrant C | 2,766,813 | 608,009 |
| Events in quadrant D | 3,535,050 | 548,877 |
| Mode M9 | |||
|---|---|---|---|
| Quadrant | BADHDUFLAG | Total packets | Discarded packets |
| A | 0 | 19 | 0 |
| B | 0 | 19 | 0 |
| C | 0 | 19 | 0 |
| D | 0 | 20 | 0 |
| Mode SS | |||
|---|---|---|---|
| Quadrant | BADHDUFLAG | Total packets | Discarded packets |
| A | 0 | 114 | 0 |
| B | 0 | 114 | 0 |
| C | 0 | 114 | 0 |
| D | 0 | 114 | 0 |
| Mode M0 | |||
|---|---|---|---|
| Quadrant | BADHDUFLAG | Total packets | Discarded packets |
| A | 0 | 12512 | 3 |
| B | 0 | 12051 | 2 |
| C | 0 | 11785 | 2 |
| D | 0 | 14507 | 2 |
| Quadrant | Total seconds | Saturated seconds | Saturation percentage |
|---|---|---|---|
| A | 5556 | 81 | 1.457883% |
| B | 5556 | 38 | 0.683945% |
| C | 5556 | 10 | 0.179986% |
| D | 5556 | 184 | 3.311735% |
Noise dominated data is calculated using 1-second bins in cleaned event files. If a bin has >2000 counts, and if more than 50% of those come from <1% of pixels, then it is considered to be noise-dominated and hence unusable.
| Quadrant | # 1 sec bins | Bins with >0 counts | Bins with >2000 counts | High rate bins dominated by noise | Noise dominated (total time) | Noise dominated (detector-on time) | Marked lightcurve |
|---|---|---|---|---|---|---|---|
| A | 7199 | 5557 | 51 | 51 | 0.71% | 0.92% | 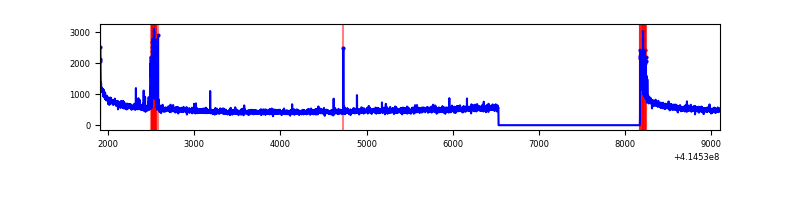 |
| B | 7199 | 5557 | 20 | 20 | 0.28% | 0.36% | 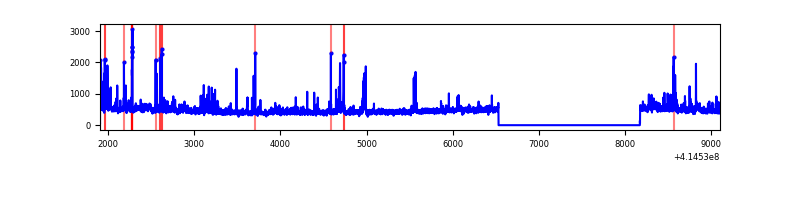 |
| C | 7199 | 5557 | 5 | 5 | 0.07% | 0.09% | 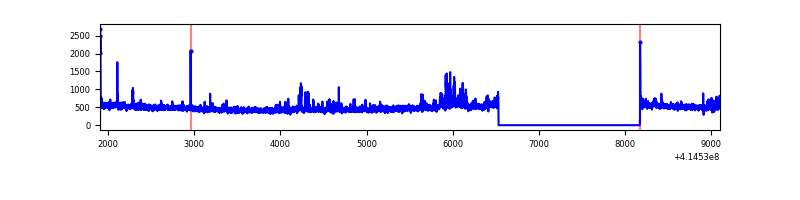 |
| D | 7199 | 5557 | 151 | 151 | 2.10% | 2.72% | 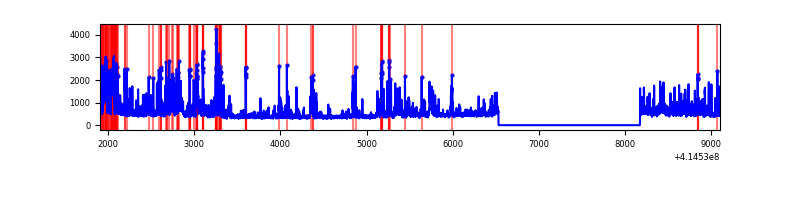 |
Top three noisy pixels from each quadrant. If the there are fewer than three noisy pixels in the level2.evt file, extra rows are filled as -1
| Pixel properties | Quadrant properties | ||||||
|---|---|---|---|---|---|---|---|
| Quadrant | DetID | PixID | Counts | Sigma | Mean | Median | Sigma |
| A | 10 | 83 | 465945 | 3708.89 | 608 | 595 | 125.5 |
| A | 13 | 248 | 154959 | 1230.3 | 608 | 595 | 125.5 |
| A | 2 | 79 | 11973 | 90.68 | 608 | 595 | 125.5 |
| B | 4 | 171 | 192849 | 1616.41 | 610 | 593 | 118.9 |
| B | 5 | 255 | 81800 | 682.76 | 610 | 593 | 118.9 |
| B | 0 | 230 | 69187 | 576.71 | 610 | 593 | 118.9 |
| C | 15 | 214 | 231081 | 1625.87 | 602 | 604 | 141.8 |
| C | 14 | 254 | 109581 | 768.76 | 602 | 604 | 141.8 |
| C | 7 | 220 | 34739 | 240.8 | 602 | 604 | 141.8 |
| D | 2 | 250 | 431144 | 2942.02 | 591 | 575 | 146.4 |
| D | 2 | 249 | 279267 | 1904.26 | 591 | 575 | 146.4 |
| D | 12 | 227 | 262345 | 1788.64 | 591 | 575 | 146.4 |
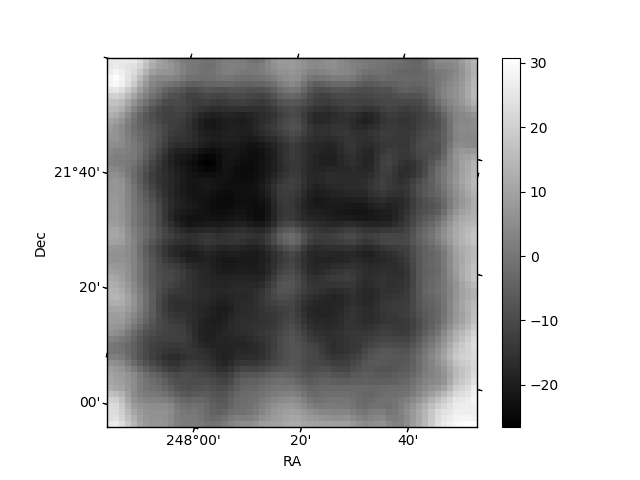
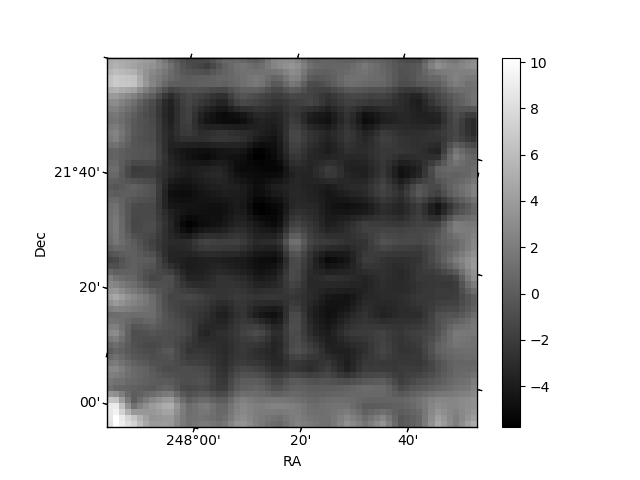
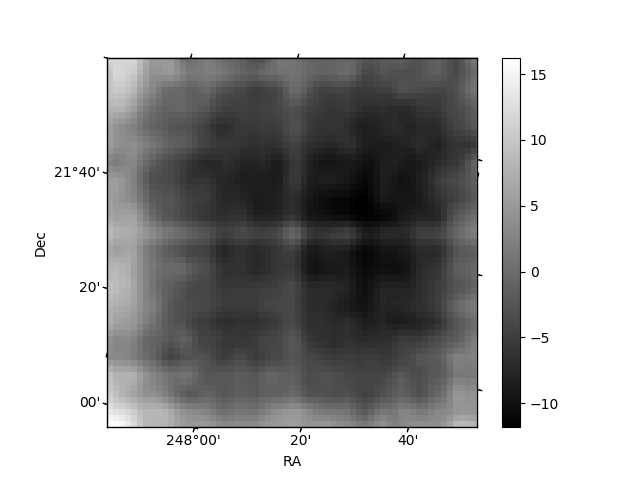
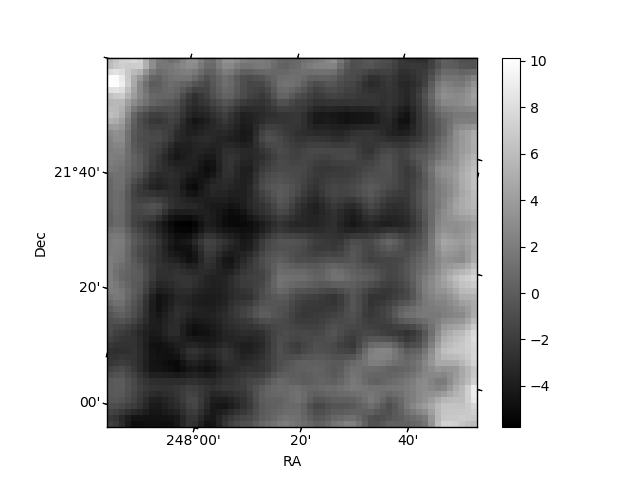
Histogram calculated using DETX and DETY for each event in the final _common_clean file
| Quadrant A | 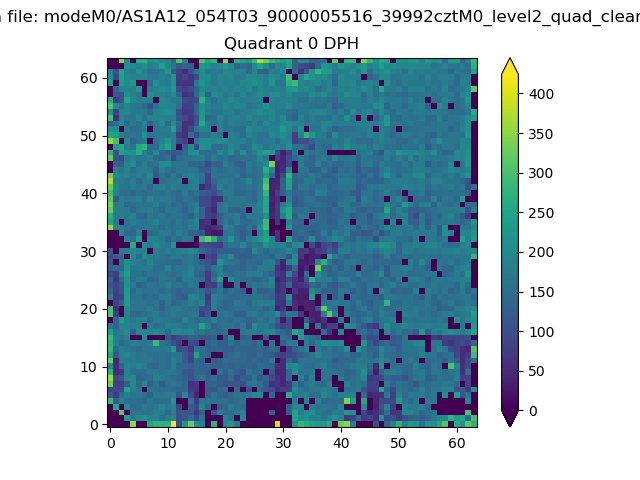 |
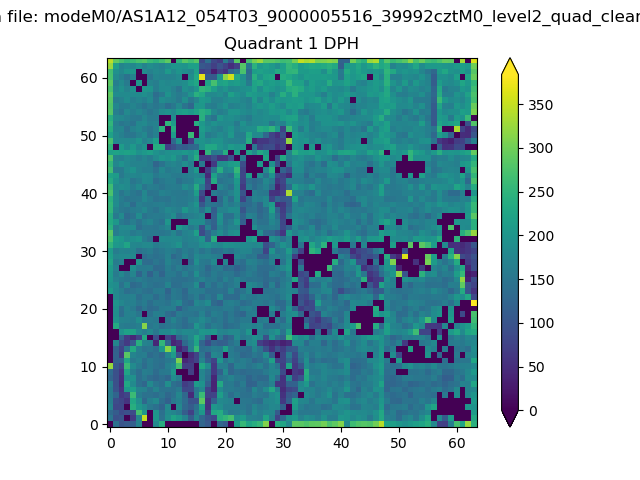 |
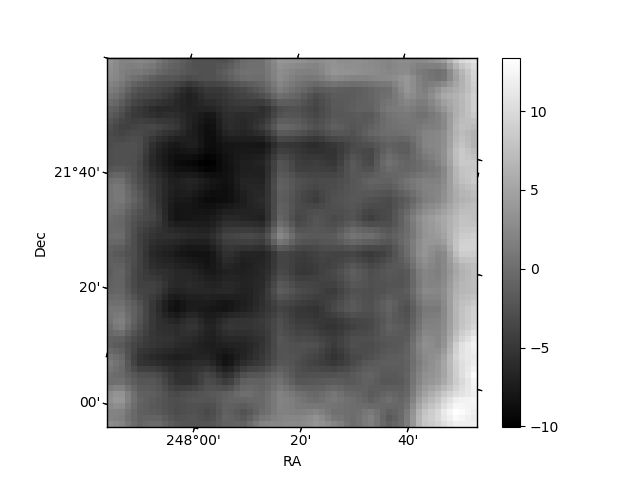
Quadrant B |
|---|---|---|---|
| Quadrant D | 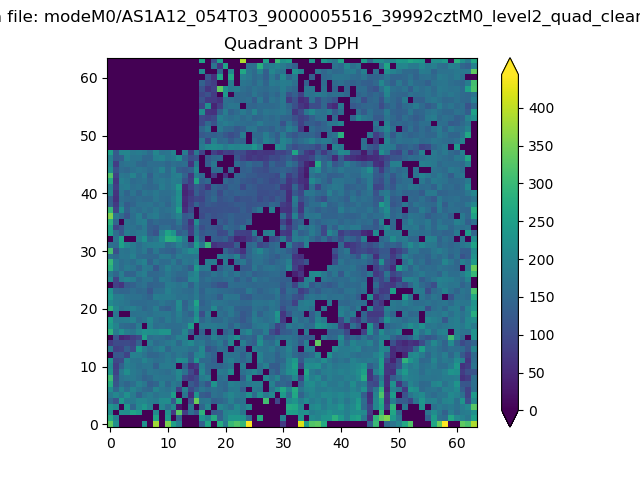 |
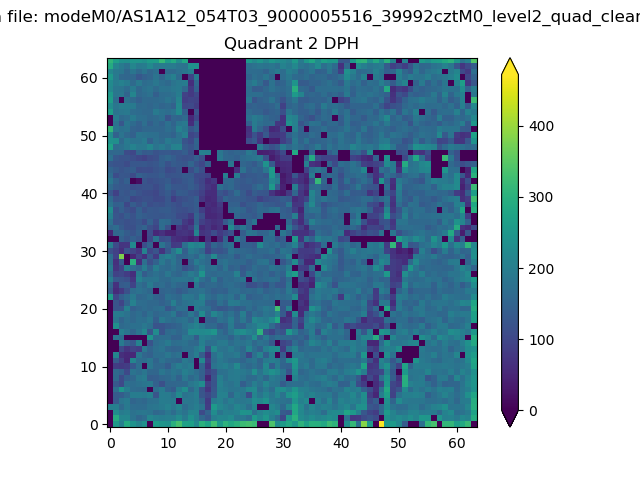 |
Quadrant C |
| Plot type | Count rate plots | Images |
|---|---|---|
| Comparison with Poisson distribution Blue bars denote a histogram of data divided into 1 sec bins. Red curve is a Poisson curve with rate = median count rate of data. |
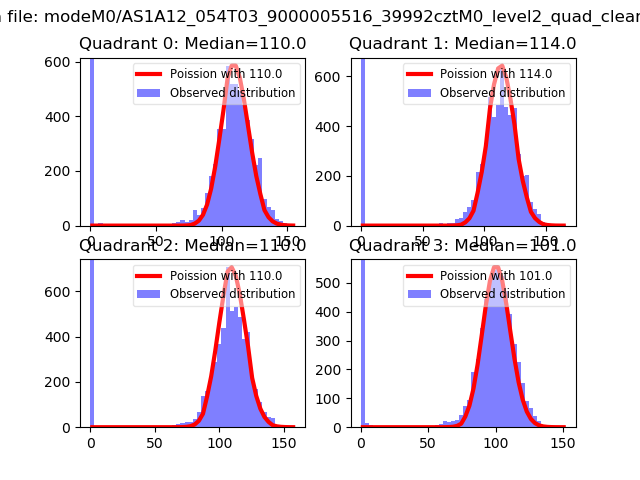 |
 |
| Quadrant-wise count rates Data is divided into 100 sec bins |
 |
|
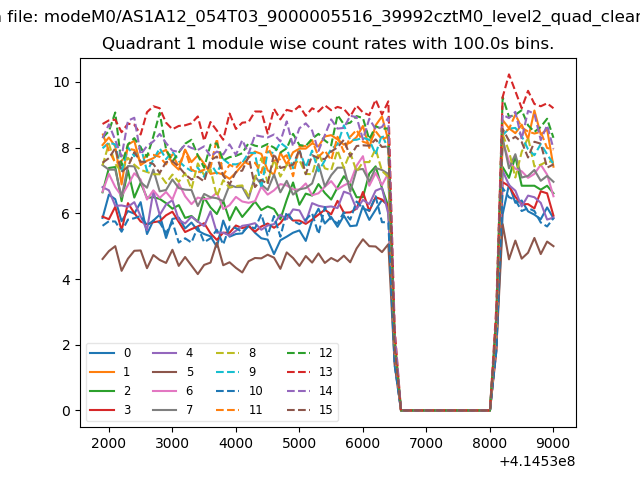
| Module-wise count rates for Quadrant A Data is divided into 100 sec bins |
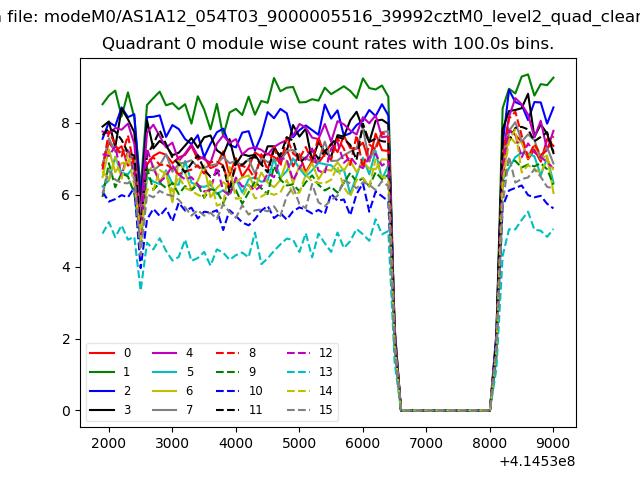 |
 |
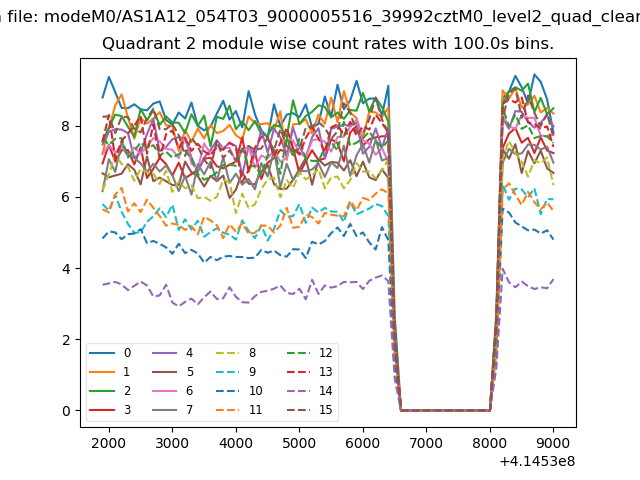
| Module-wise count rates for Quadrant B Data is divided into 100 sec bins |
 |
 |
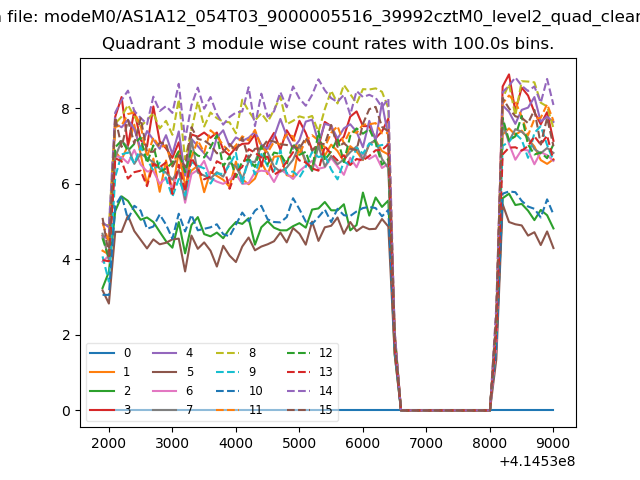
| Module-wise count rates for Quadrant C Data is divided into 100 sec bins |
 |
 |
| Module-wise count rates for Quadrant D Data is divided into 100 sec bins |
 |
 |
| Parameter | Plot |
|---|---|
| CZT HV Monitor | 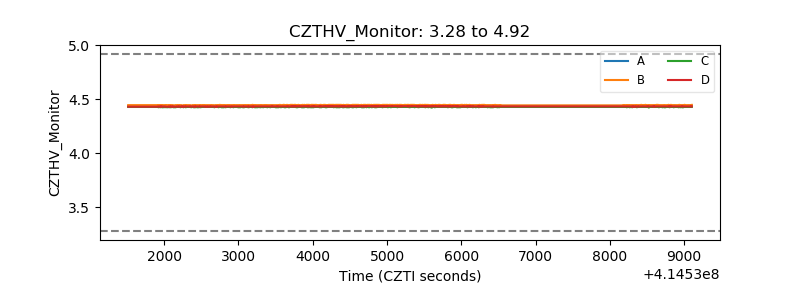 |
| D_VDD | 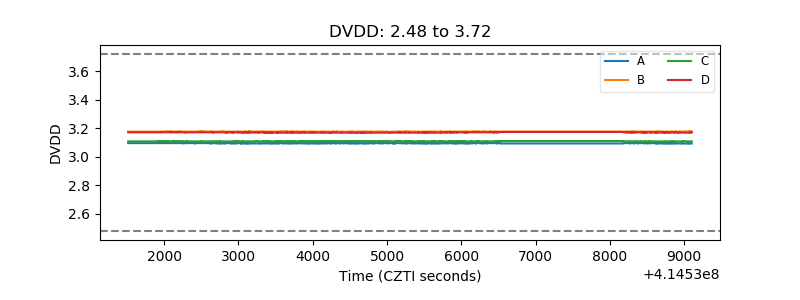 |
| Temperature 1 | 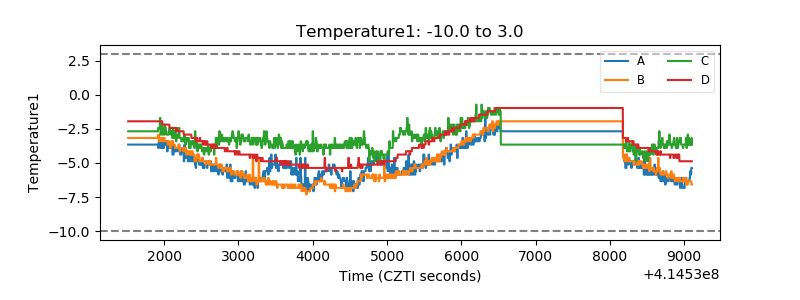 |
| Veto HV Monitor |  |
| Veto LLD | 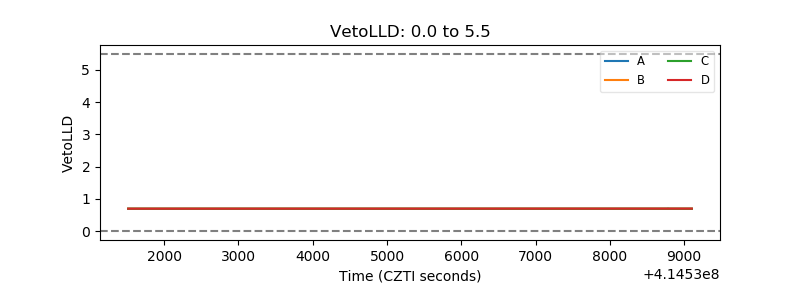 |
| Alpha Counter | 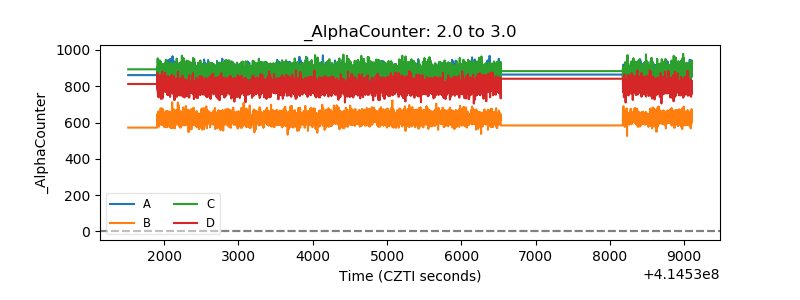 |
| _CPM_Rate | 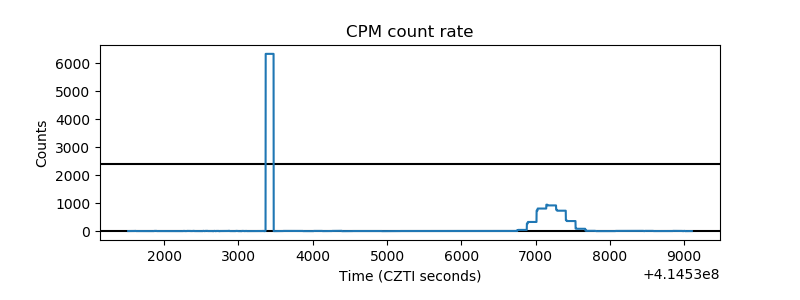 |
| CZT Counter | 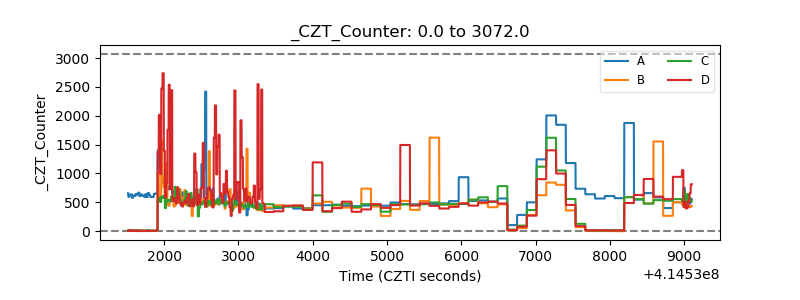 |
| +2.5 Volts monitor | 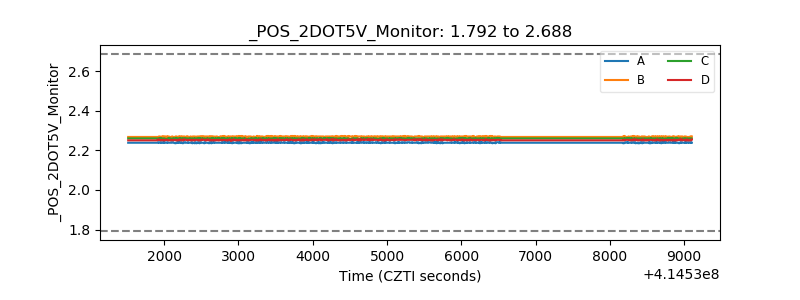 |
| +5 Volts monitor |  |
| _ROLL_ROT | 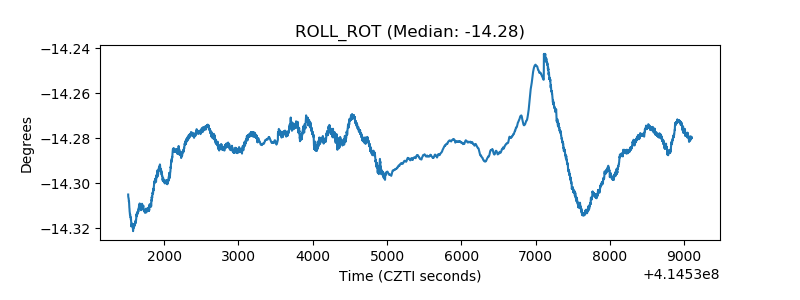 |
| _Roll_DEC | 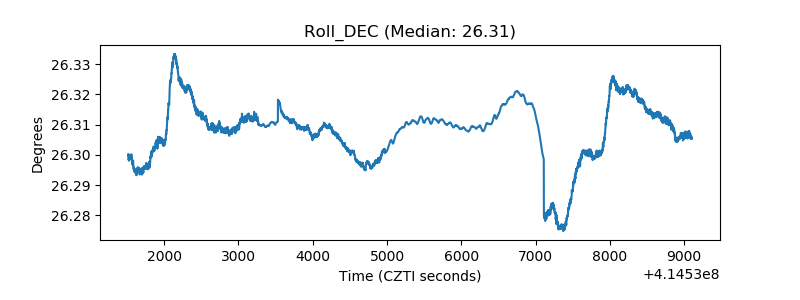 |
| _Roll_RA | 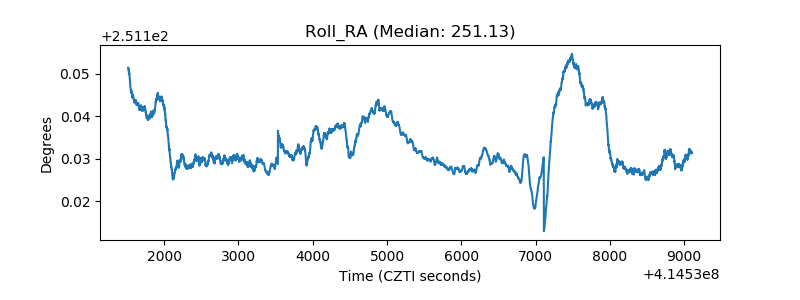 |
| Veto Counter | 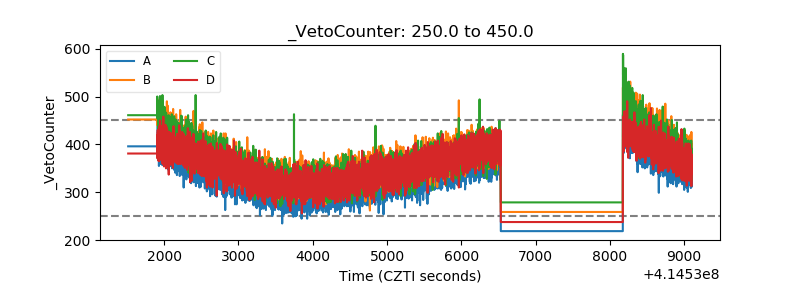 |