| Param | Original file | Final file |
|---|---|---|
| Filename | modeM0/AS1A12_054T03_9000005516_39994cztM0_level2.fits | modeM0/AS1A12_054T03_9000005516_39994cztM0_level2_quad_clean.evt |
| Size (bytes) | 354,219,840 | 100,929,600 |
| Size | 337.8 MB | 96.3 MB |
| Events in quadrant A | 3,098,509 | 669,216 |
| Events in quadrant B | 3,002,667 | 693,397 |
| Events in quadrant C | 3,420,214 | 669,534 |
| Events in quadrant D | 3,130,116 | 610,641 |
| Mode M9 | |||
|---|---|---|---|
| Quadrant | BADHDUFLAG | Total packets | Discarded packets |
| A | 0 | 34 | 0 |
| B | 0 | 34 | 0 |
| C | 0 | 34 | 0 |
| D | 0 | 34 | 0 |
| Mode SS | |||
|---|---|---|---|
| Quadrant | BADHDUFLAG | Total packets | Discarded packets |
| A | 0 | 122 | 0 |
| B | 0 | 122 | 0 |
| C | 0 | 122 | 0 |
| D | 0 | 122 | 0 |
| Mode M0 | |||
|---|---|---|---|
| Quadrant | BADHDUFLAG | Total packets | Discarded packets |
| A | 0 | 12901 | 3 |
| B | 0 | 12903 | 2 |
| C | 0 | 13979 | 2 |
| D | 0 | 13471 | 2 |
| Quadrant | Total seconds | Saturated seconds | Saturation percentage |
|---|---|---|---|
| A | 5917 | 43 | 0.726720% |
| B | 5917 | 41 | 0.692919% |
| C | 5917 | 10 | 0.169005% |
| D | 5917 | 30 | 0.507014% |
Noise dominated data is calculated using 1-second bins in cleaned event files. If a bin has >2000 counts, and if more than 50% of those come from <1% of pixels, then it is considered to be noise-dominated and hence unusable.
| Quadrant | # 1 sec bins | Bins with >0 counts | Bins with >2000 counts | High rate bins dominated by noise | Noise dominated (total time) | Noise dominated (detector-on time) | Marked lightcurve |
|---|---|---|---|---|---|---|---|
| A | 9325 | 5919 | 22 | 22 | 0.24% | 0.37% | 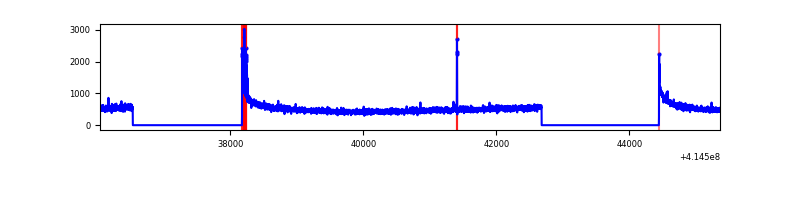 |
| B | 9325 | 5919 | 17 | 17 | 0.18% | 0.29% | 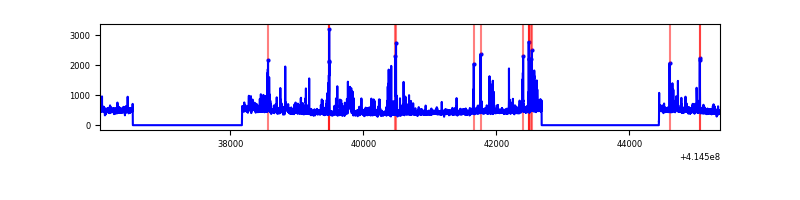 |
| C | 9325 | 5919 | 5 | 5 | 0.05% | 0.08% | 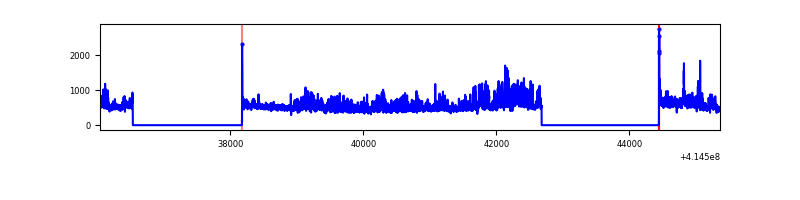 |
| D | 9325 | 5919 | 21 | 21 | 0.23% | 0.35% | 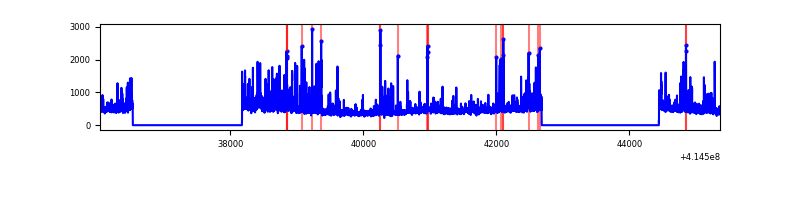 |
Top three noisy pixels from each quadrant. If the there are fewer than three noisy pixels in the level2.evt file, extra rows are filled as -1
| Pixel properties | Quadrant properties | ||||||
|---|---|---|---|---|---|---|---|
| Quadrant | DetID | PixID | Counts | Sigma | Mean | Median | Sigma |
| A | 10 | 83 | 476763 | 3535.07 | 659 | 646 | 134.7 |
| A | 13 | 248 | 46536 | 340.72 | 659 | 646 | 134.7 |
| A | 12 | 189 | 14851 | 105.47 | 659 | 646 | 134.7 |
| B | 4 | 171 | 313911 | 2451.71 | 659 | 642 | 127.8 |
| B | 5 | 255 | 54439 | 421.03 | 659 | 642 | 127.8 |
| B | 0 | 230 | 16151 | 121.38 | 659 | 642 | 127.8 |
| C | 14 | 254 | 576067 | 3786.35 | 648 | 654 | 152.0 |
| C | 15 | 214 | 247357 | 1623.36 | 648 | 654 | 152.0 |
| C | 15 | 208 | 29025 | 186.69 | 648 | 654 | 152.0 |
| D | 12 | 227 | 331011 | 2058.74 | 645 | 627 | 160.5 |
| D | 2 | 250 | 133240 | 826.36 | 645 | 627 | 160.5 |
| D | 13 | 249 | 92052 | 569.7 | 645 | 627 | 160.5 |
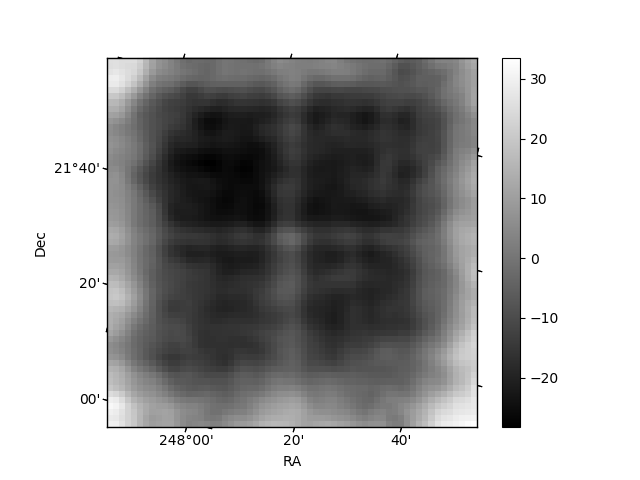
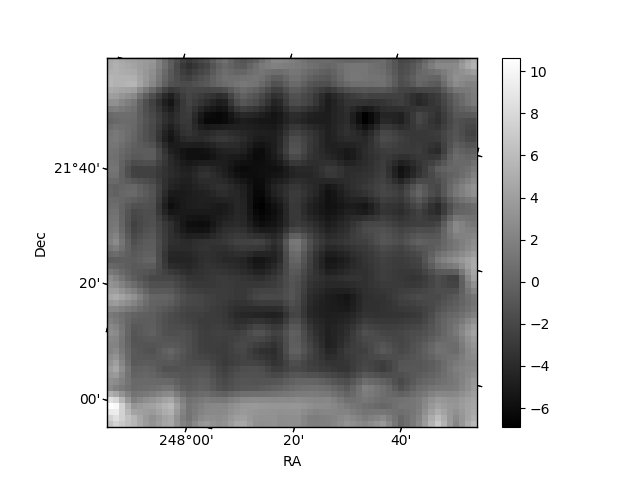
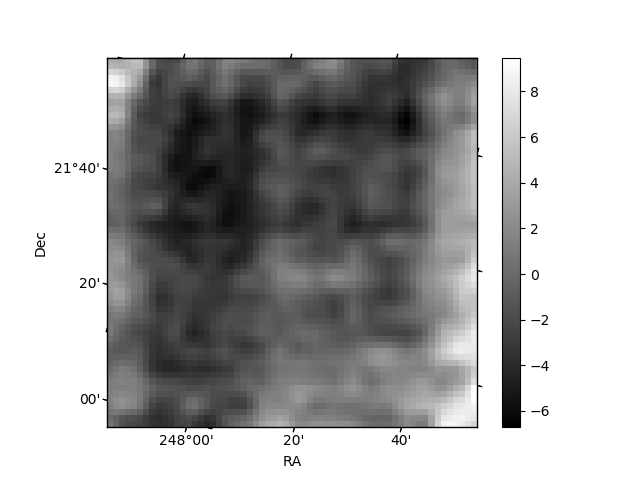
Histogram calculated using DETX and DETY for each event in the final _common_clean file
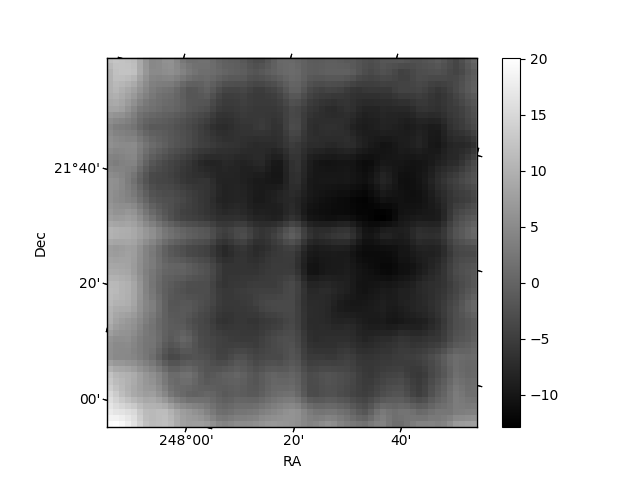
| Quadrant A | 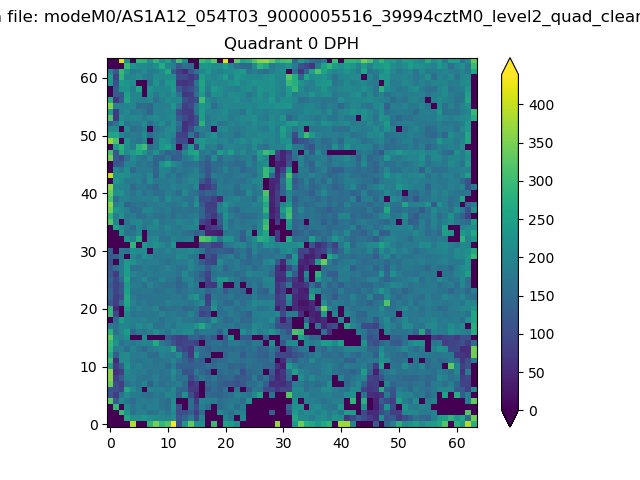 |
 |
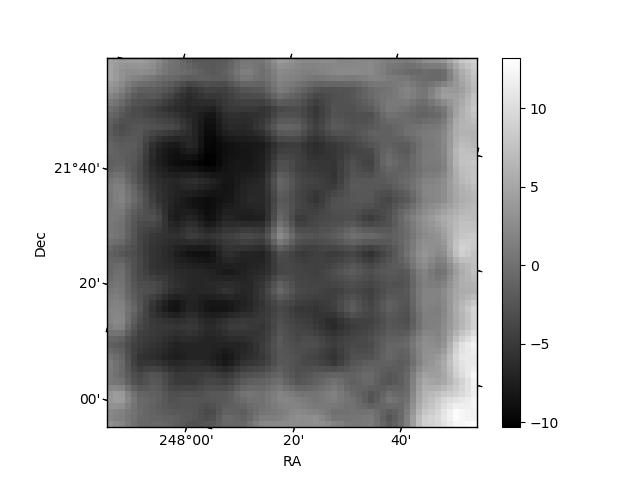
Quadrant B |
|---|---|---|---|
| Quadrant D | 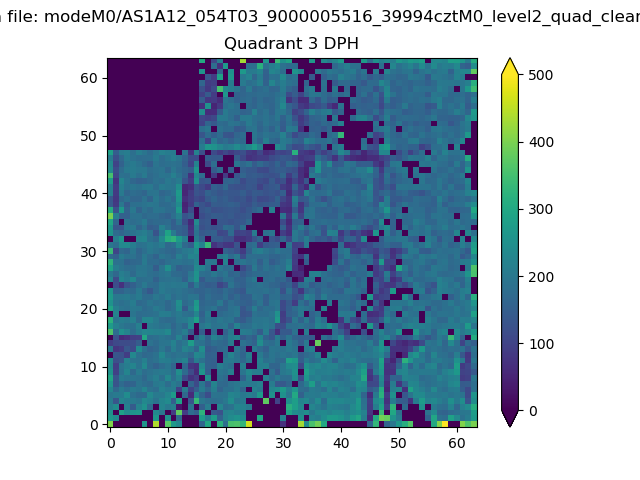 |
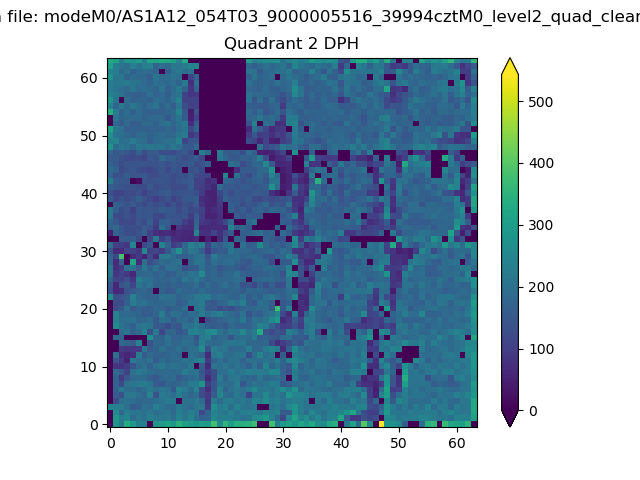 |
Quadrant C |
| Plot type | Count rate plots | Images |
|---|---|---|
| Comparison with Poisson distribution Blue bars denote a histogram of data divided into 1 sec bins. Red curve is a Poisson curve with rate = median count rate of data. |
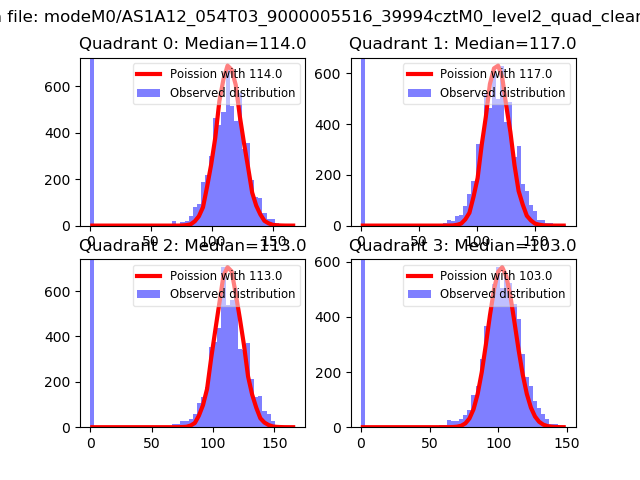 |
 |
| Quadrant-wise count rates Data is divided into 100 sec bins |
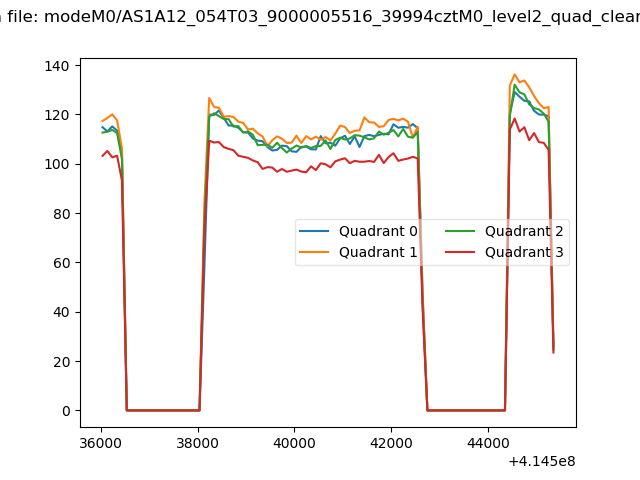 |
|
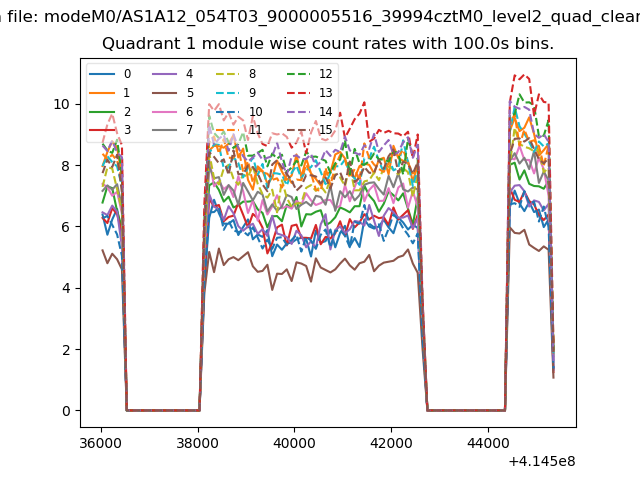
| Module-wise count rates for Quadrant A Data is divided into 100 sec bins |
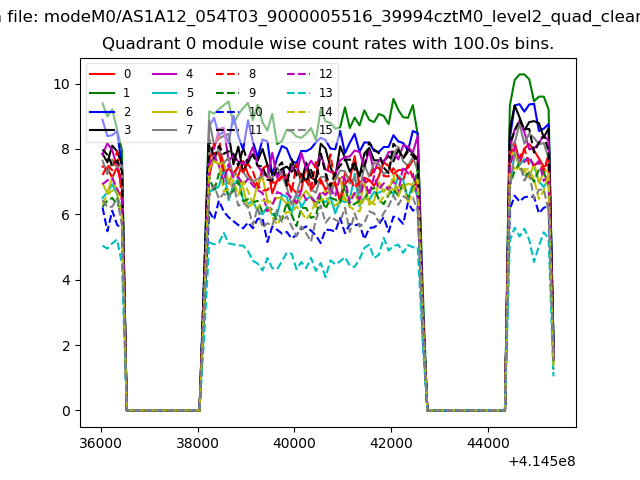 |
 |
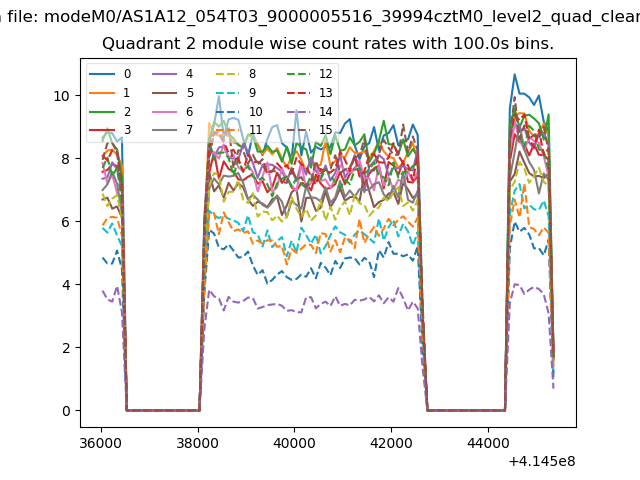
| Module-wise count rates for Quadrant B Data is divided into 100 sec bins |
 |
 |
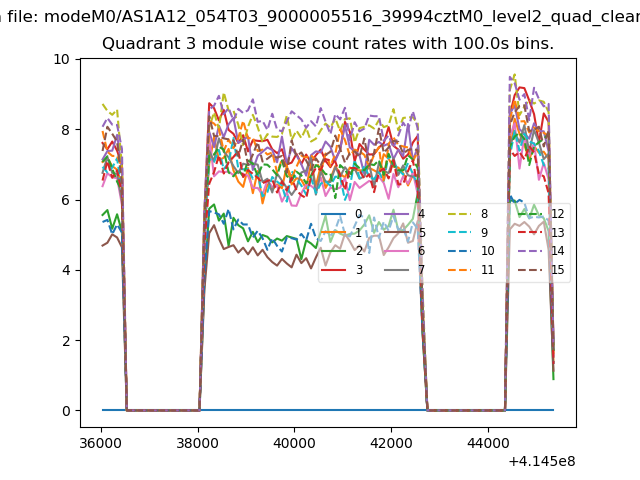
| Module-wise count rates for Quadrant C Data is divided into 100 sec bins |
 |
 |
| Module-wise count rates for Quadrant D Data is divided into 100 sec bins |
 |
 |
| Parameter | Plot |
|---|---|
| CZT HV Monitor | 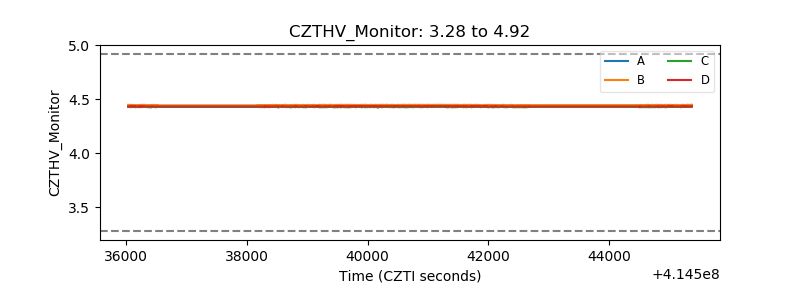 |
| D_VDD | 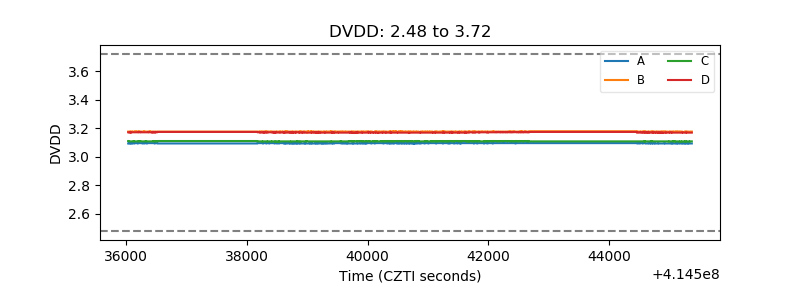 |
| Temperature 1 | 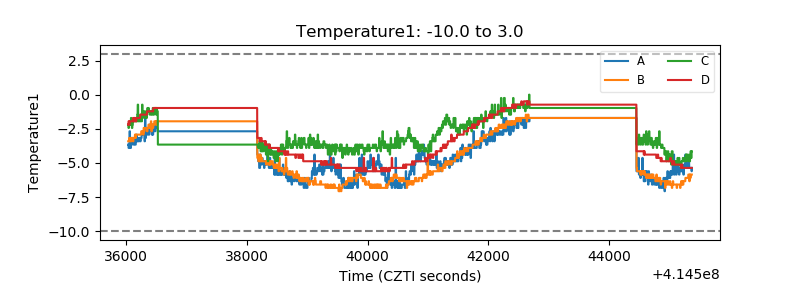 |
| Veto HV Monitor | 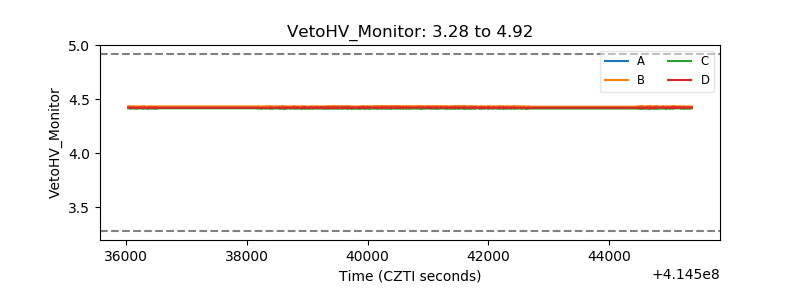 |
| Veto LLD | 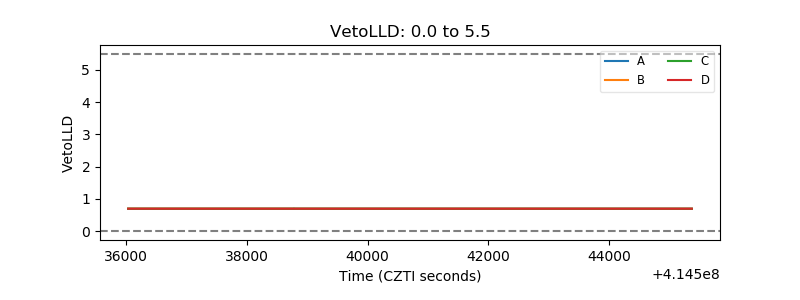 |
| Alpha Counter | 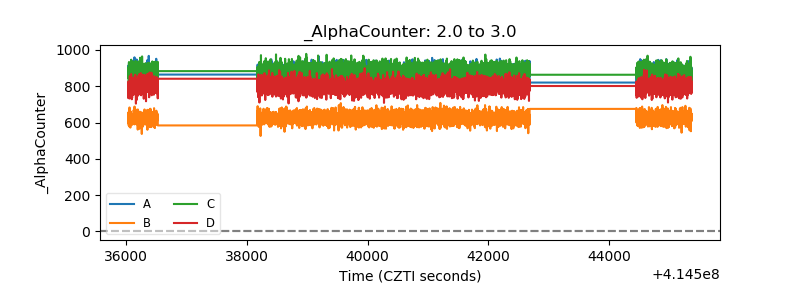 |
| _CPM_Rate | 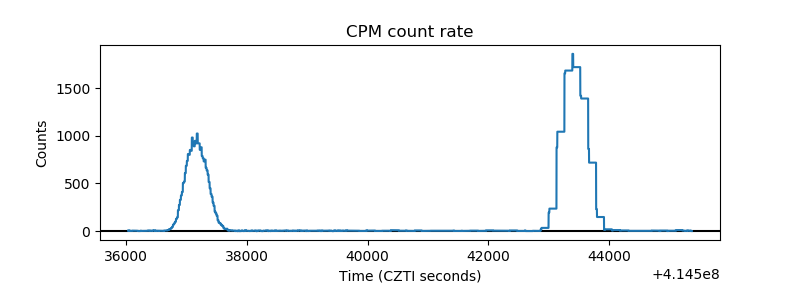 |
| CZT Counter | 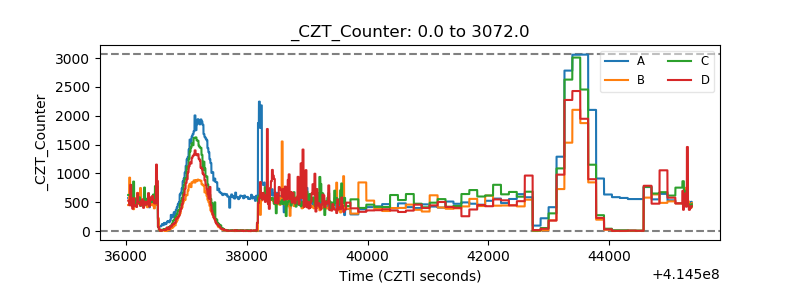 |
| +2.5 Volts monitor | 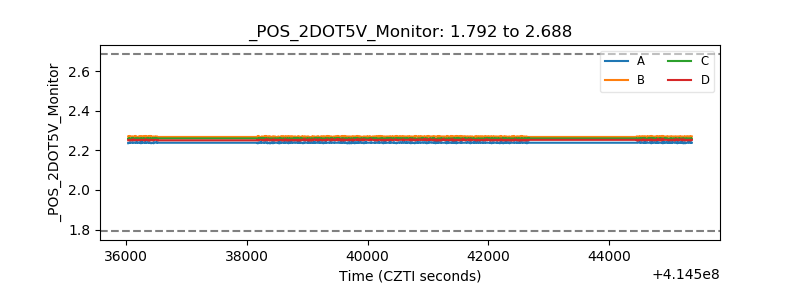 |
| +5 Volts monitor | 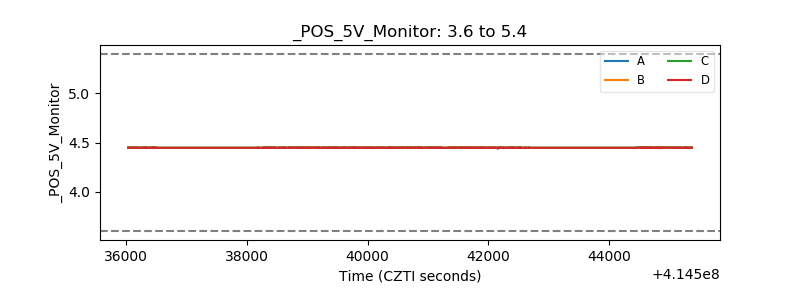 |
| _ROLL_ROT | 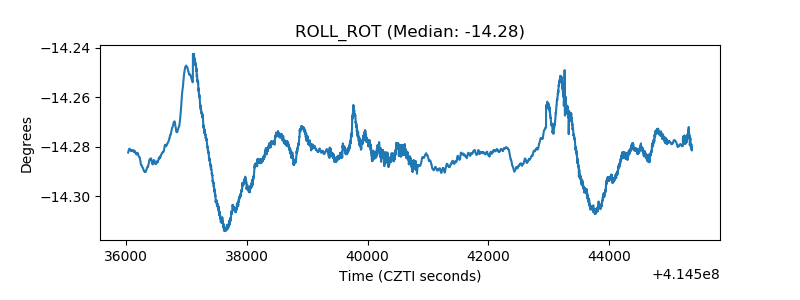 |
| _Roll_DEC | 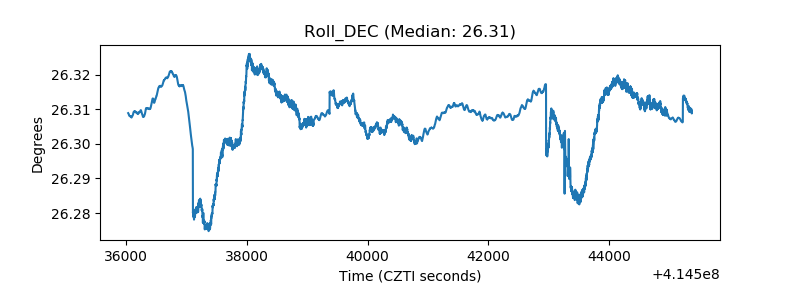 |
| _Roll_RA | 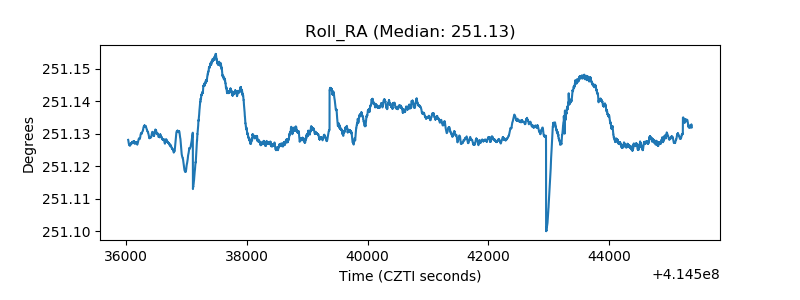 |
| Veto Counter | 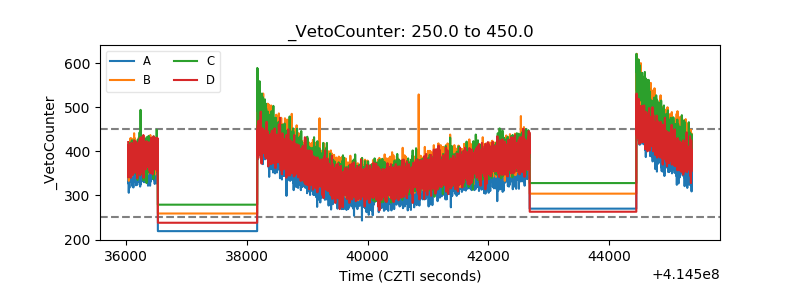 |