| Param | Original file | Final file |
|---|---|---|
| Filename | modeM0/AS1A12_054T03_9000005516_39995cztM0_level2.fits | modeM0/AS1A12_054T03_9000005516_39995cztM0_level2_quad_clean.evt |
| Size (bytes) | 320,728,320 | 97,606,080 |
| Size | 305.9 MB | 93.1 MB |
| Events in quadrant A | 2,907,170 | 651,022 |
| Events in quadrant B | 2,717,126 | 680,515 |
| Events in quadrant C | 3,124,871 | 649,809 |
| Events in quadrant D | 2,691,808 | 587,629 |
| Mode M9 | |||
|---|---|---|---|
| Quadrant | BADHDUFLAG | Total packets | Discarded packets |
| A | 0 | 38 | 0 |
| B | 0 | 38 | 0 |
| C | 0 | 38 | 0 |
| D | 0 | 38 | 0 |
| Mode SS | |||
|---|---|---|---|
| Quadrant | BADHDUFLAG | Total packets | Discarded packets |
| A | 0 | 112 | 0 |
| B | 0 | 112 | 0 |
| C | 0 | 112 | 0 |
| D | 0 | 112 | 0 |
| Mode M0 | |||
|---|---|---|---|
| Quadrant | BADHDUFLAG | Total packets | Discarded packets |
| A | 0 | 12055 | 2 |
| B | 0 | 11805 | 1 |
| C | 0 | 12823 | 1 |
| D | 0 | 12012 | 1 |
| Quadrant | Total seconds | Saturated seconds | Saturation percentage |
|---|---|---|---|
| A | 5536 | 20 | 0.361272% |
| B | 5536 | 37 | 0.668353% |
| C | 5536 | 13 | 0.234827% |
| D | 5536 | 34 | 0.614162% |
Noise dominated data is calculated using 1-second bins in cleaned event files. If a bin has >2000 counts, and if more than 50% of those come from <1% of pixels, then it is considered to be noise-dominated and hence unusable.
| Quadrant | # 1 sec bins | Bins with >0 counts | Bins with >2000 counts | High rate bins dominated by noise | Noise dominated (total time) | Noise dominated (detector-on time) | Marked lightcurve |
|---|---|---|---|---|---|---|---|
| A | 9215 | 5538 | 7 | 7 | 0.08% | 0.13% | 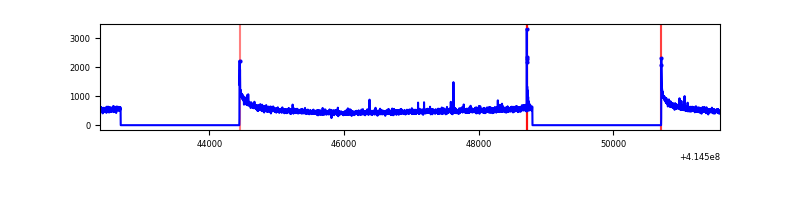 |
| B | 9215 | 5538 | 12 | 12 | 0.13% | 0.22% | 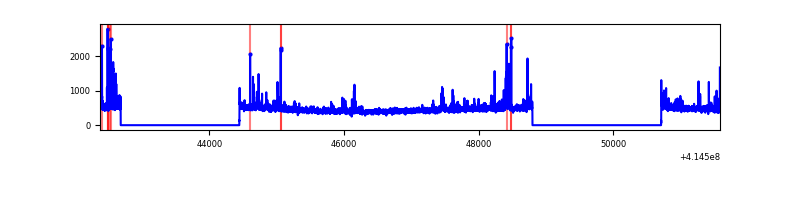 |
| C | 9215 | 5538 | 13 | 13 | 0.14% | 0.23% | 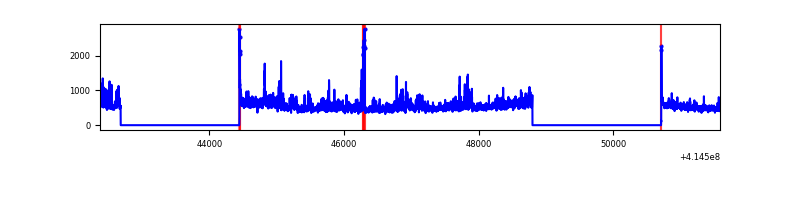 |
| D | 9215 | 5538 | 35 | 35 | 0.38% | 0.63% | 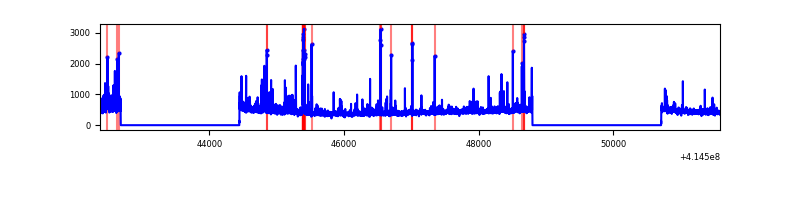 |
Top three noisy pixels from each quadrant. If the there are fewer than three noisy pixels in the level2.evt file, extra rows are filled as -1
| Pixel properties | Quadrant properties | ||||||
|---|---|---|---|---|---|---|---|
| Quadrant | DetID | PixID | Counts | Sigma | Mean | Median | Sigma |
| A | 10 | 83 | 461110 | 3632.22 | 623 | 611 | 126.8 |
| A | 13 | 248 | 17091 | 129.99 | 623 | 611 | 126.8 |
| A | 6 | 10 | 7865 | 57.22 | 623 | 611 | 126.8 |
| B | 4 | 171 | 202313 | 1687.54 | 626 | 610 | 119.5 |
| B | 5 | 255 | 30562 | 250.59 | 626 | 610 | 119.5 |
| B | 12 | 111 | 15029 | 120.64 | 626 | 610 | 119.5 |
| C | 14 | 254 | 362781 | 2547.87 | 612 | 618 | 142.1 |
| C | 15 | 214 | 231256 | 1622.57 | 612 | 618 | 142.1 |
| C | 15 | 208 | 96374 | 673.66 | 612 | 618 | 142.1 |
| D | 12 | 227 | 211242 | 1417.95 | 605 | 589 | 148.6 |
| D | 2 | 250 | 69773 | 465.69 | 605 | 589 | 148.6 |
| D | 13 | 249 | 35861 | 237.42 | 605 | 589 | 148.6 |
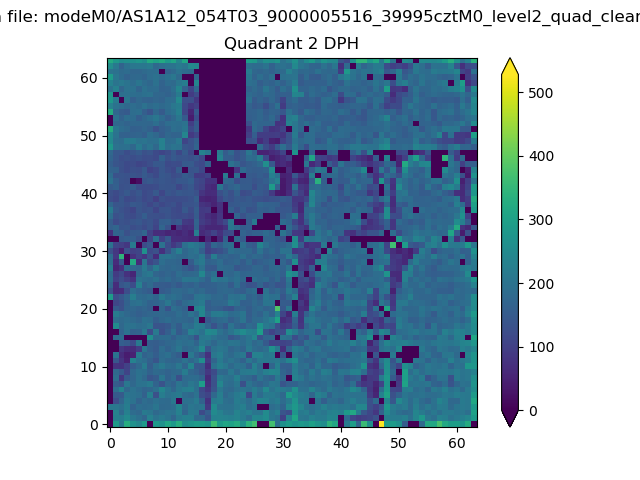
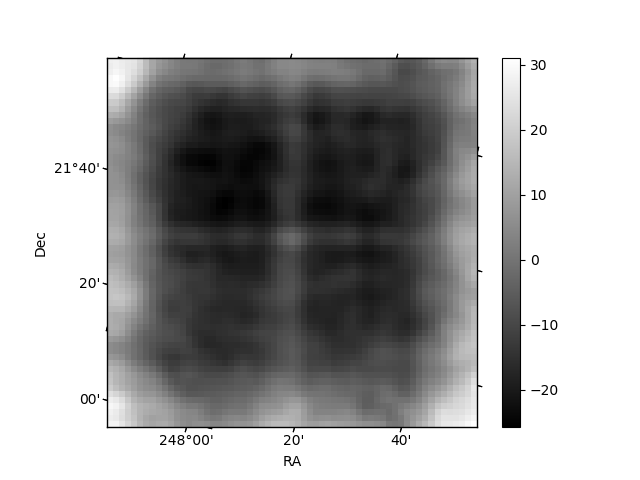
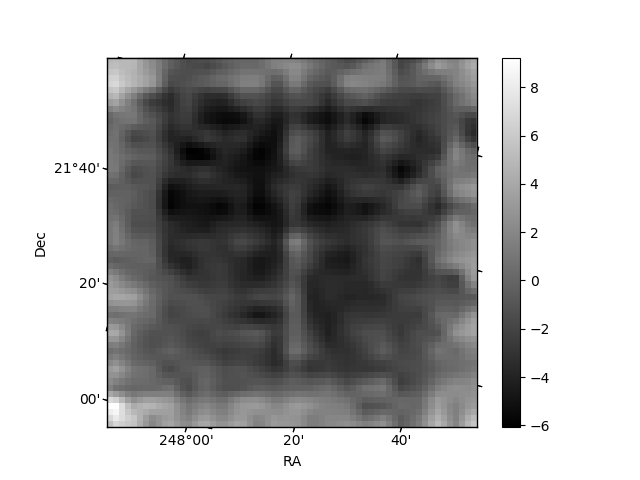
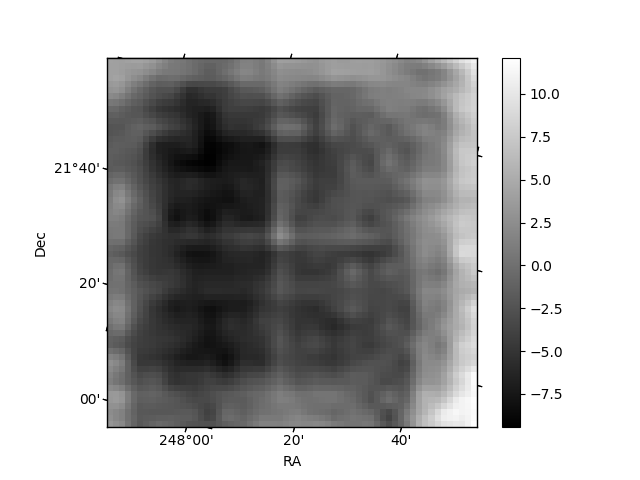
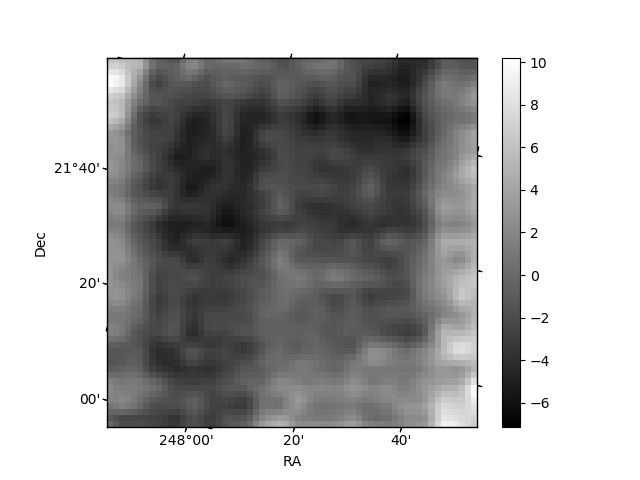
Histogram calculated using DETX and DETY for each event in the final _common_clean file
| Quadrant A | 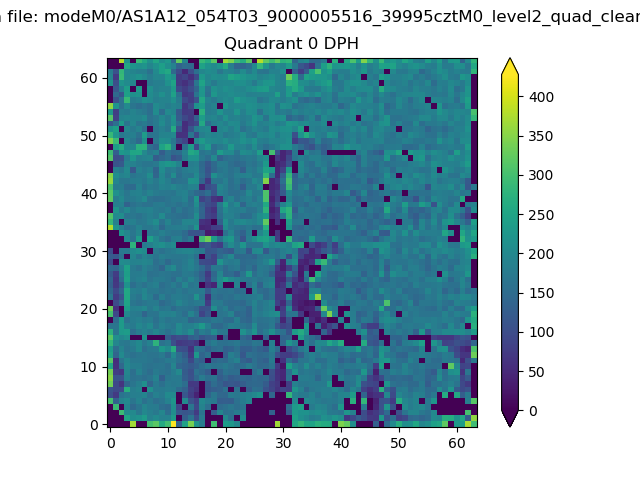 |
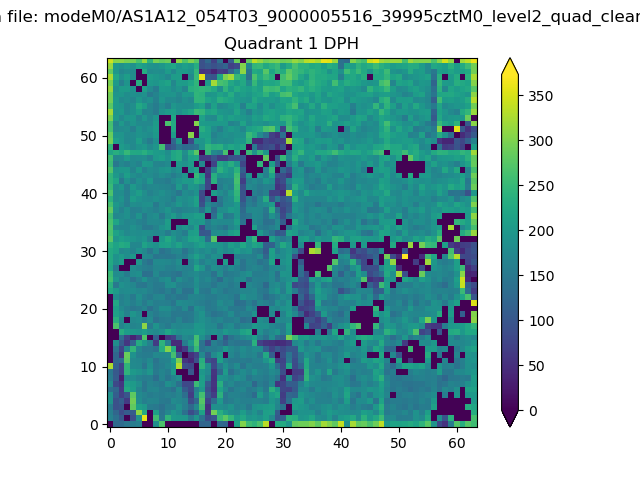 |
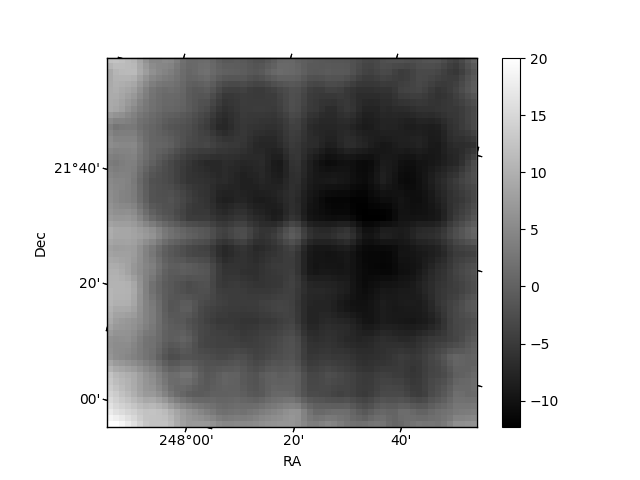
Quadrant B |
|---|---|---|---|
| Quadrant D | 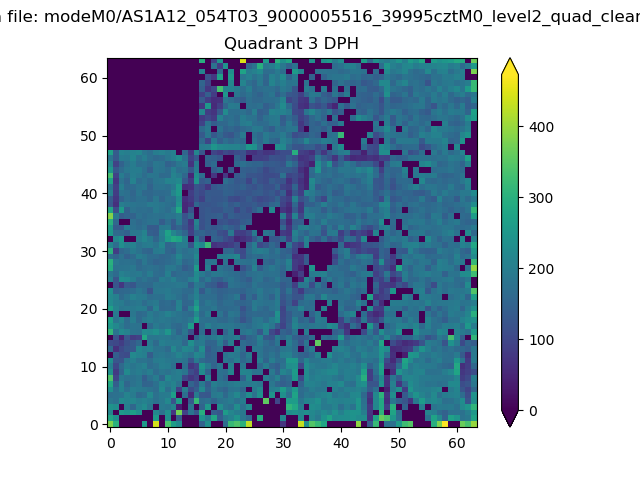 |
 |
Quadrant C |
| Plot type | Count rate plots | Images |
|---|---|---|
| Comparison with Poisson distribution Blue bars denote a histogram of data divided into 1 sec bins. Red curve is a Poisson curve with rate = median count rate of data. |
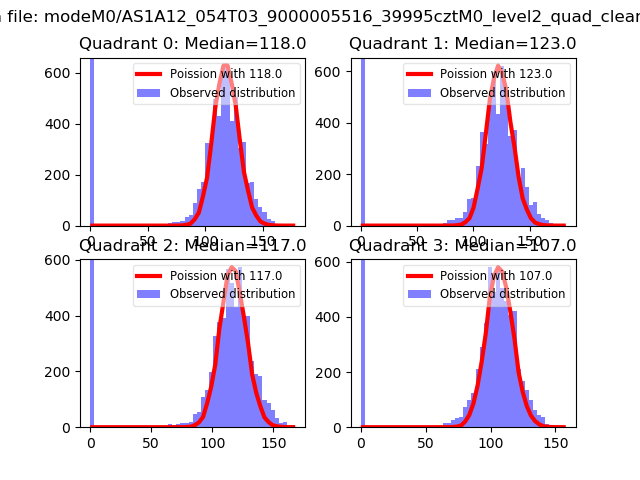 |
 |
| Quadrant-wise count rates Data is divided into 100 sec bins |
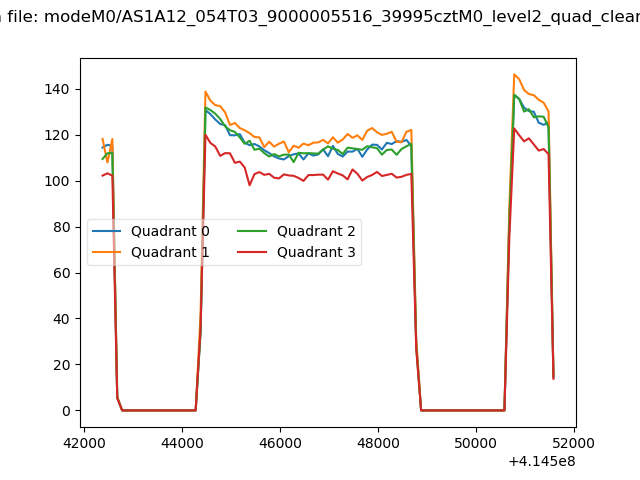 |
|
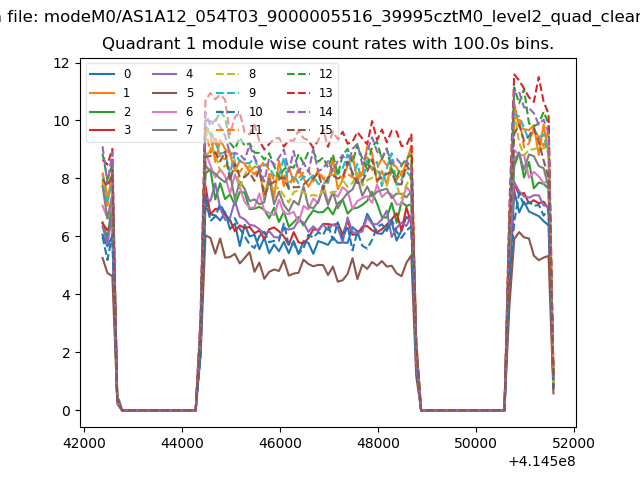
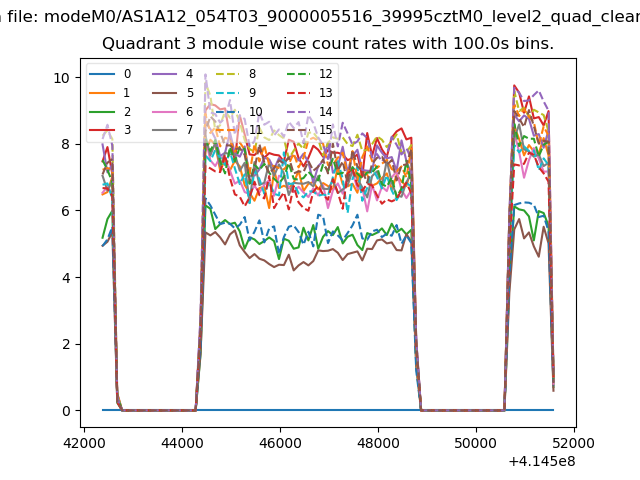
| Module-wise count rates for Quadrant A Data is divided into 100 sec bins |
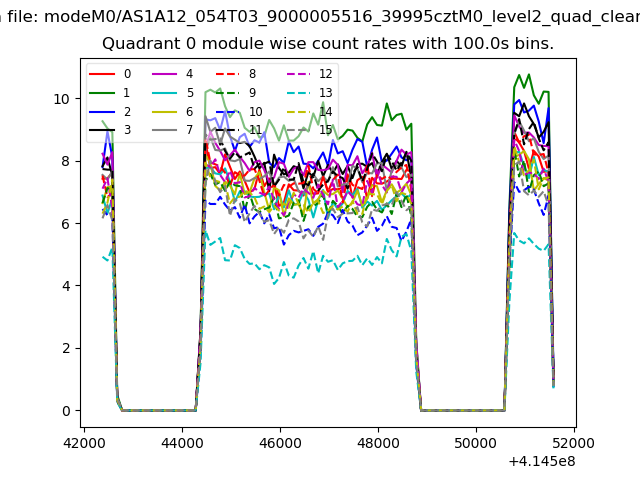 |
 |
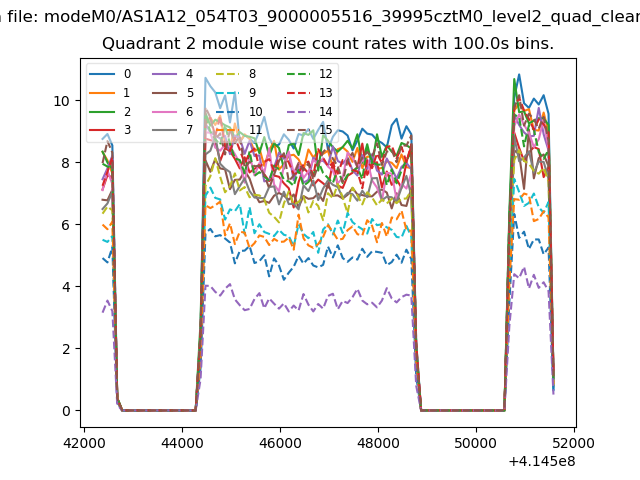
| Module-wise count rates for Quadrant B Data is divided into 100 sec bins |
 |
 |
| Module-wise count rates for Quadrant C Data is divided into 100 sec bins |
 |
 |
| Module-wise count rates for Quadrant D Data is divided into 100 sec bins |
 |
 |
| Parameter | Plot |
|---|---|
| CZT HV Monitor | 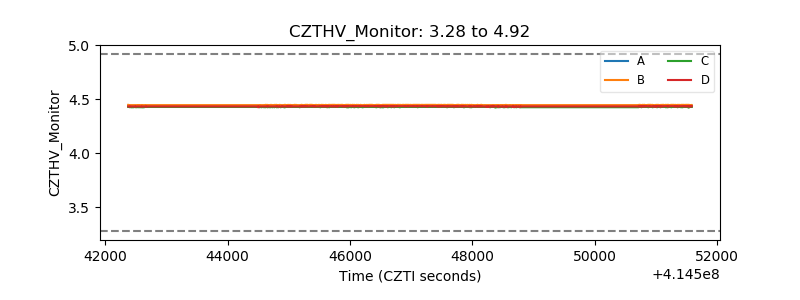 |
| D_VDD | 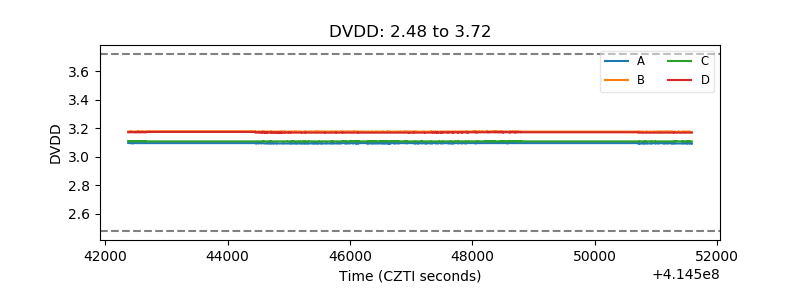 |
| Temperature 1 | 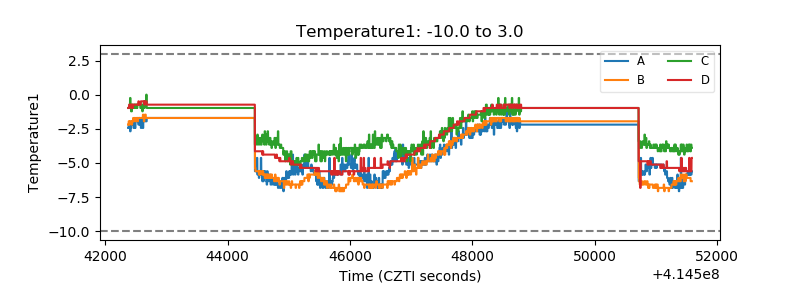 |
| Veto HV Monitor | 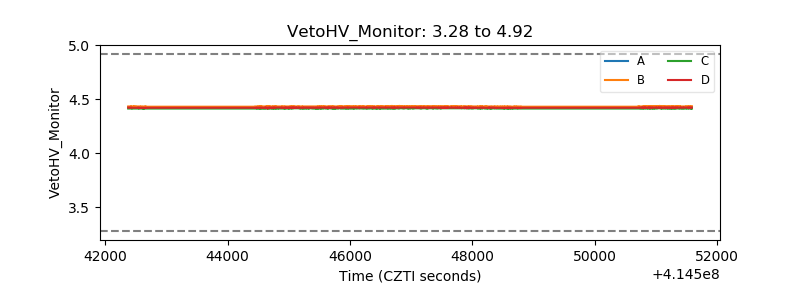 |
| Veto LLD | 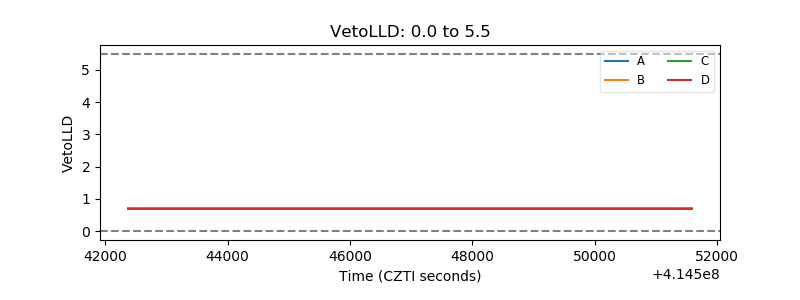 |
| Alpha Counter |  |
| _CPM_Rate | 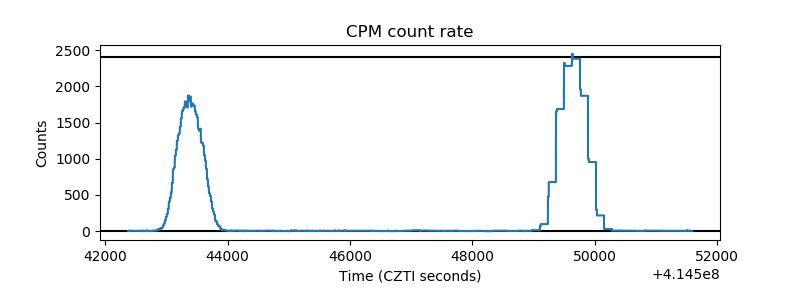 |
| CZT Counter | 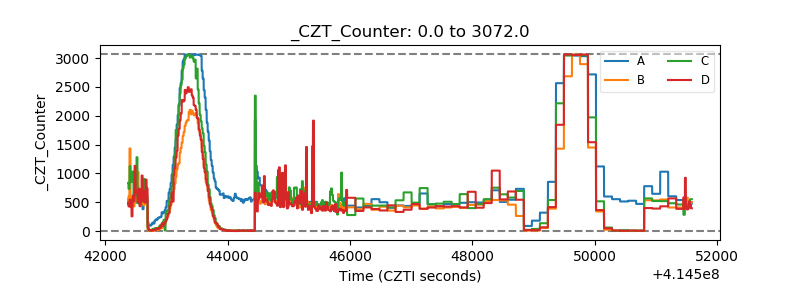 |
| +2.5 Volts monitor | 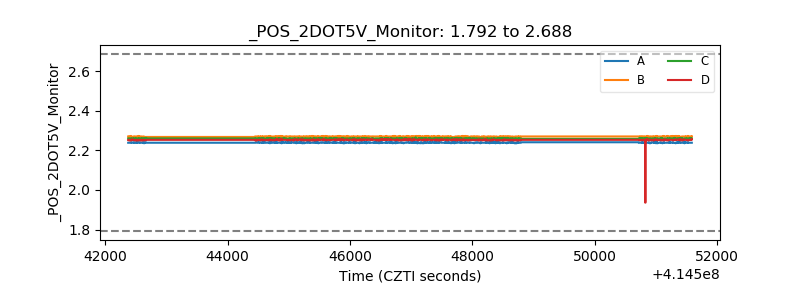 |
| +5 Volts monitor | 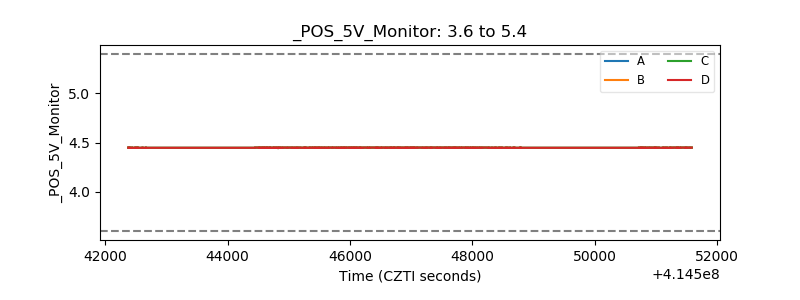 |
| _ROLL_ROT | 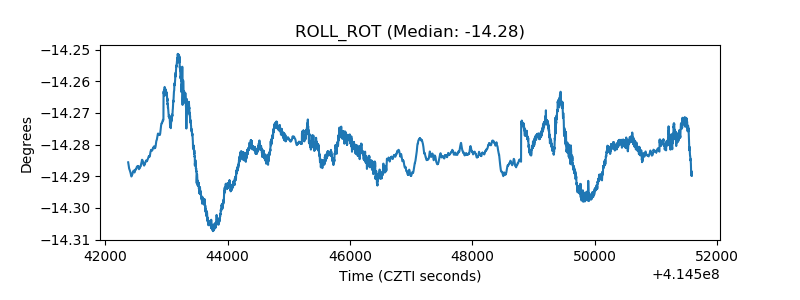 |
| _Roll_DEC |  |
| _Roll_RA | 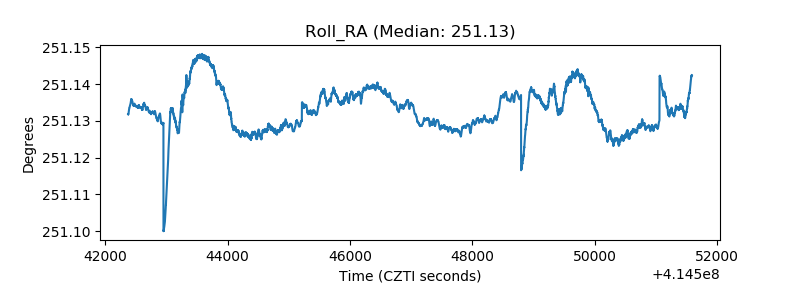 |
| Veto Counter | 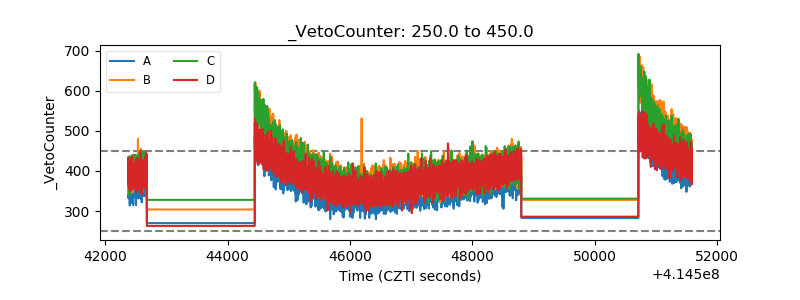 |