| Param | Original file | Final file |
|---|---|---|
| Filename | modeM0/AS1A12_054T03_9000005516_39996cztM0_level2.fits | modeM0/AS1A12_054T03_9000005516_39996cztM0_level2_quad_clean.evt |
| Size (bytes) | 324,218,880 | 97,879,680 |
| Size | 309.2 MB | 93.3 MB |
| Events in quadrant A | 2,938,360 | 658,482 |
| Events in quadrant B | 2,750,109 | 689,774 |
| Events in quadrant C | 3,032,339 | 647,120 |
| Events in quadrant D | 2,860,675 | 591,240 |
| Mode M9 | |||
|---|---|---|---|
| Quadrant | BADHDUFLAG | Total packets | Discarded packets |
| A | 0 | 29 | 0 |
| B | 0 | 29 | 0 |
| C | 0 | 29 | 0 |
| D | 0 | 30 | 0 |
| Mode SS | |||
|---|---|---|---|
| Quadrant | BADHDUFLAG | Total packets | Discarded packets |
| A | 0 | 110 | 0 |
| B | 0 | 110 | 0 |
| C | 0 | 110 | 0 |
| D | 0 | 110 | 0 |
| Mode M0 | |||
|---|---|---|---|
| Quadrant | BADHDUFLAG | Total packets | Discarded packets |
| A | 0 | 12019 | 2 |
| B | 0 | 11706 | 1 |
| C | 0 | 12245 | 1 |
| D | 0 | 12284 | 1 |
| Quadrant | Total seconds | Saturated seconds | Saturation percentage |
|---|---|---|---|
| A | 5391 | 29 | 0.537934% |
| B | 5391 | 41 | 0.760527% |
| C | 5391 | 88 | 1.632350% |
| D | 5391 | 42 | 0.779076% |
Noise dominated data is calculated using 1-second bins in cleaned event files. If a bin has >2000 counts, and if more than 50% of those come from <1% of pixels, then it is considered to be noise-dominated and hence unusable.
| Quadrant | # 1 sec bins | Bins with >0 counts | Bins with >2000 counts | High rate bins dominated by noise | Noise dominated (total time) | Noise dominated (detector-on time) | Marked lightcurve |
|---|---|---|---|---|---|---|---|
| A | 7423 | 5392 | 20 | 20 | 0.27% | 0.37% | 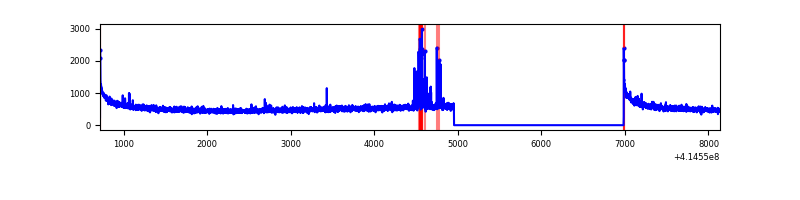 |
| B | 7423 | 5392 | 18 | 18 | 0.24% | 0.33% | 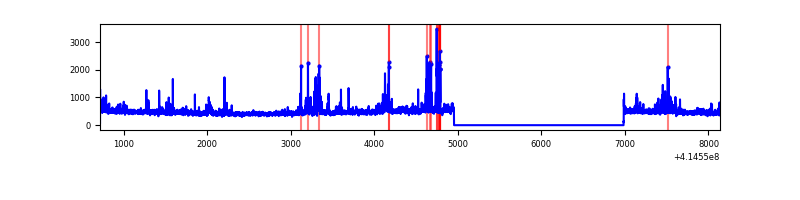 |
| C | 7423 | 5392 | 96 | 96 | 1.29% | 1.78% | 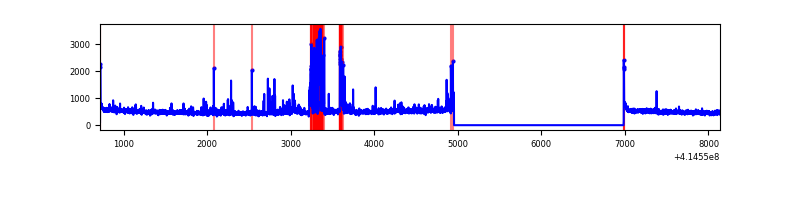 |
| D | 7423 | 5392 | 39 | 39 | 0.53% | 0.72% | 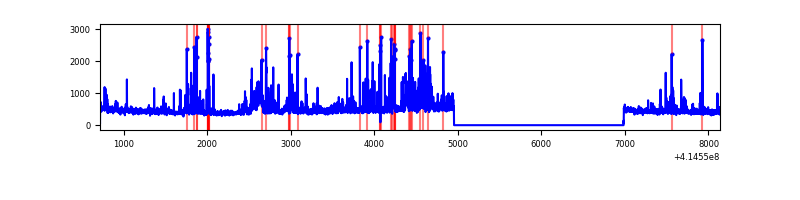 |
Top three noisy pixels from each quadrant. If the there are fewer than three noisy pixels in the level2.evt file, extra rows are filled as -1
| Pixel properties | Quadrant properties | ||||||
|---|---|---|---|---|---|---|---|
| Quadrant | DetID | PixID | Counts | Sigma | Mean | Median | Sigma |
| A | 10 | 83 | 462173 | 3698.9 | 612 | 602 | 124.8 |
| A | 13 | 248 | 92857 | 739.3 | 612 | 602 | 124.8 |
| A | 13 | 254 | 7506 | 55.33 | 612 | 602 | 124.8 |
| B | 4 | 171 | 291602 | 2461.34 | 617 | 601 | 118.2 |
| B | 12 | 111 | 14344 | 116.24 | 617 | 601 | 118.2 |
| B | 11 | 111 | 13085 | 105.59 | 617 | 601 | 118.2 |
| C | 15 | 208 | 348072 | 2492.53 | 600 | 605 | 139.4 |
| C | 15 | 214 | 225002 | 1609.7 | 600 | 605 | 139.4 |
| C | 14 | 254 | 74985 | 533.56 | 600 | 605 | 139.4 |
| D | 12 | 227 | 194900 | 1338.76 | 592 | 576 | 145.2 |
| D | 13 | 249 | 130657 | 896.17 | 592 | 576 | 145.2 |
| D | 2 | 250 | 108229 | 741.66 | 592 | 576 | 145.2 |
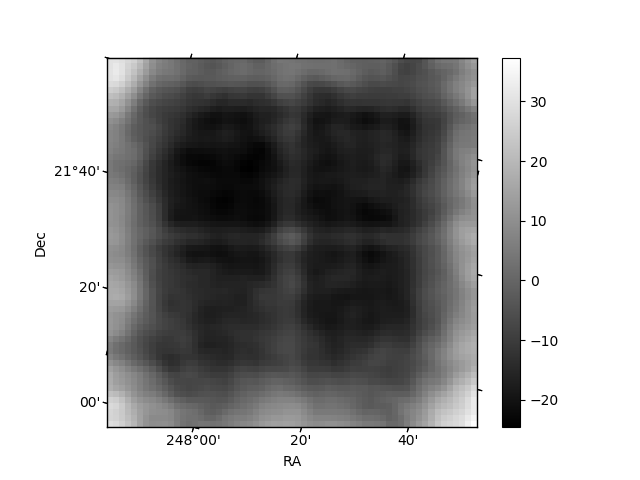
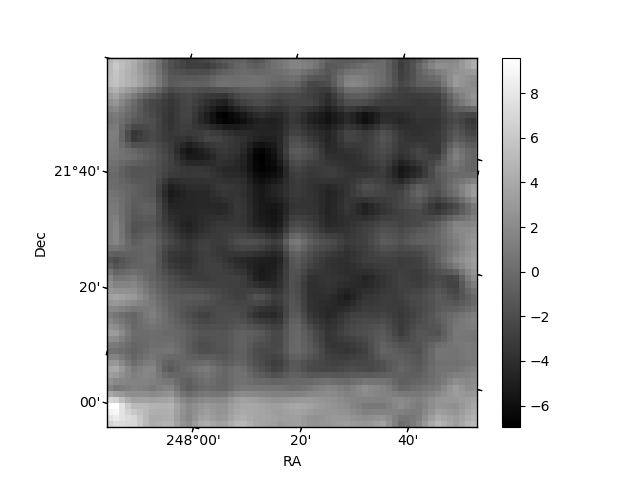
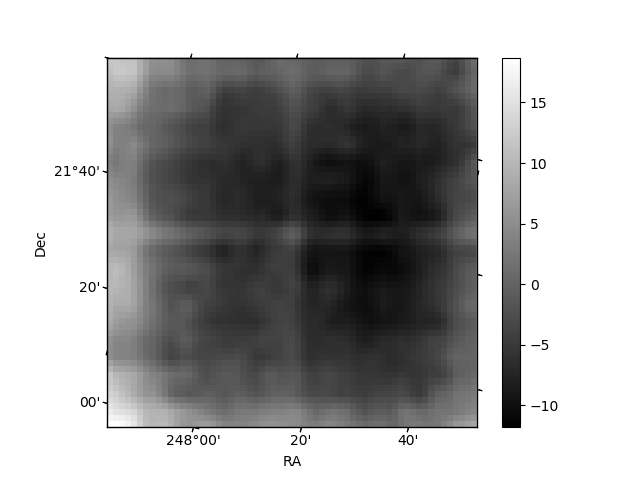
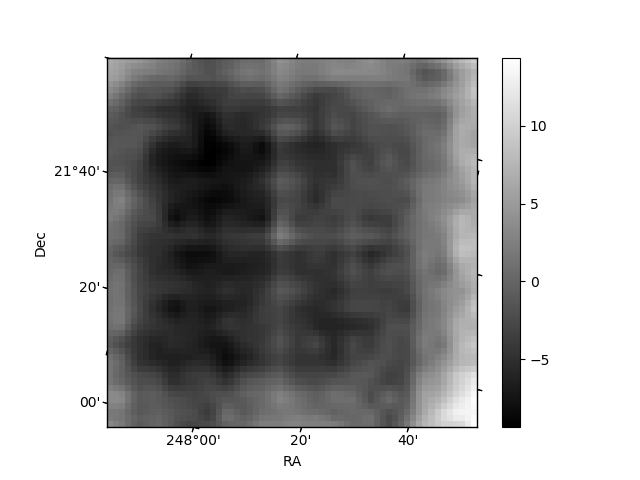
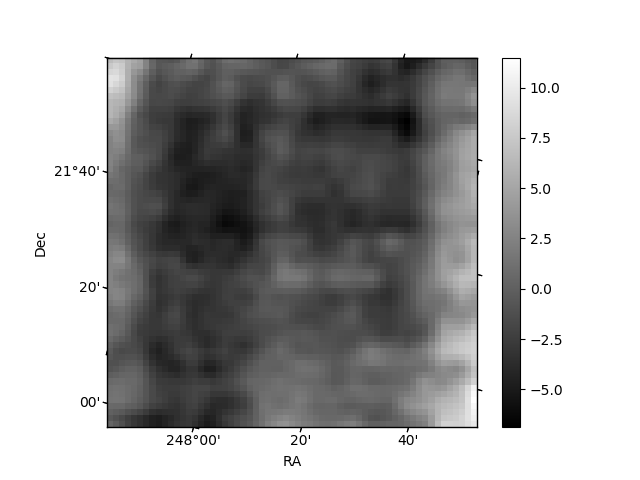
Histogram calculated using DETX and DETY for each event in the final _common_clean file
| Quadrant A | 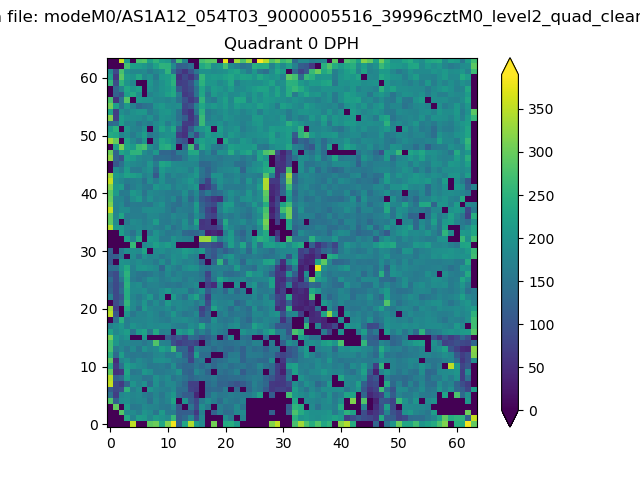 |
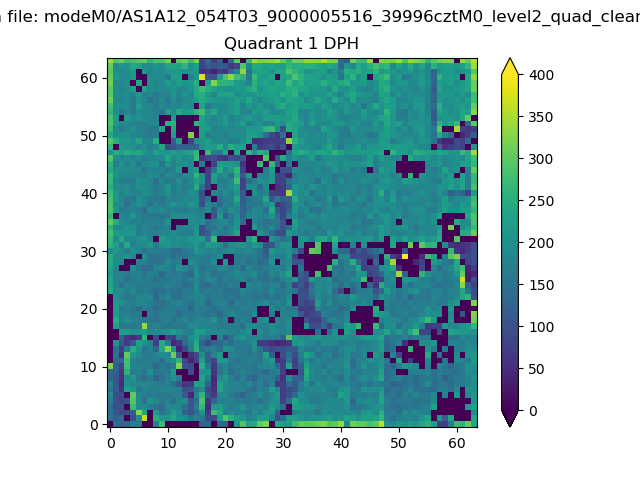 |
Quadrant B |
|---|---|---|---|
| Quadrant D | 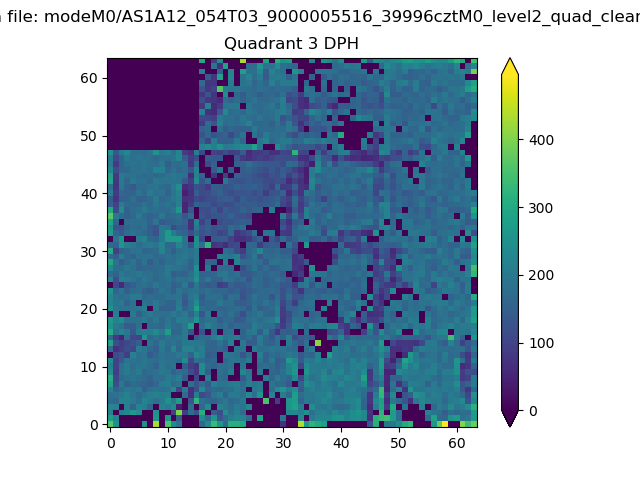 |
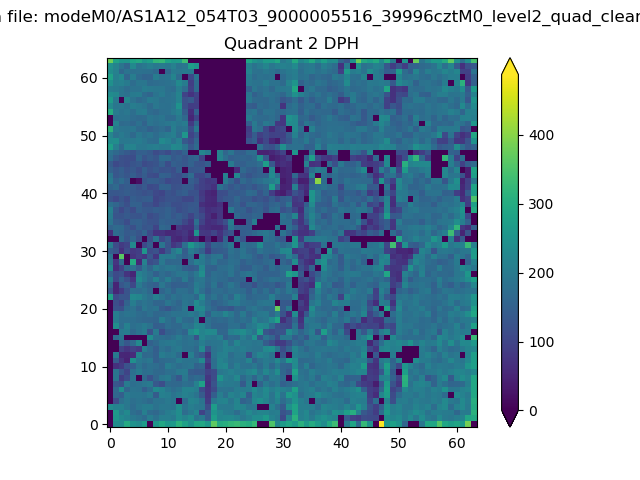 |
Quadrant C |
| Plot type | Count rate plots | Images |
|---|---|---|
| Comparison with Poisson distribution Blue bars denote a histogram of data divided into 1 sec bins. Red curve is a Poisson curve with rate = median count rate of data. |
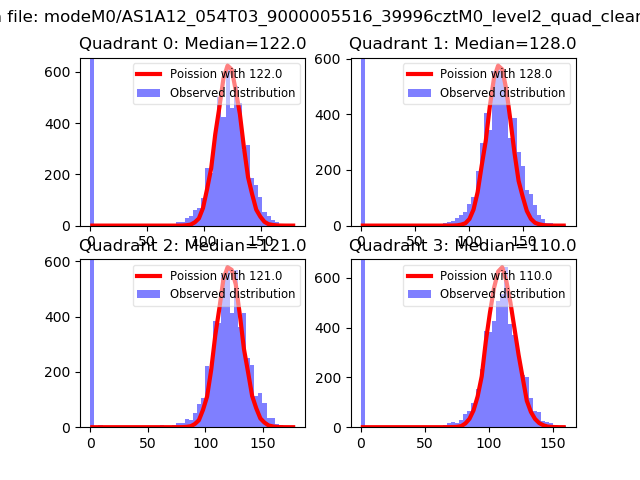 |
 |
| Quadrant-wise count rates Data is divided into 100 sec bins |
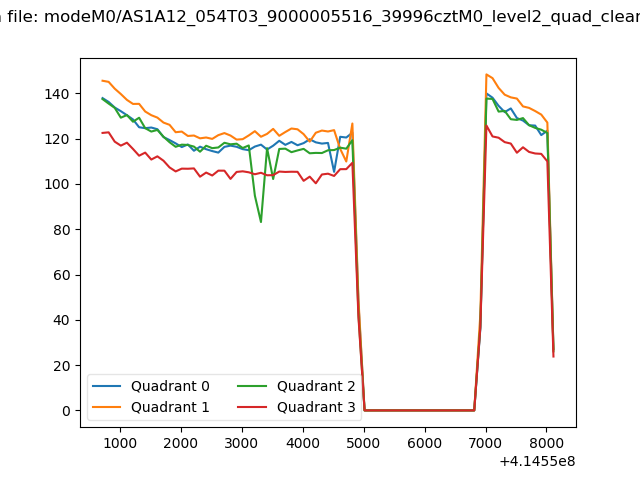 |
|
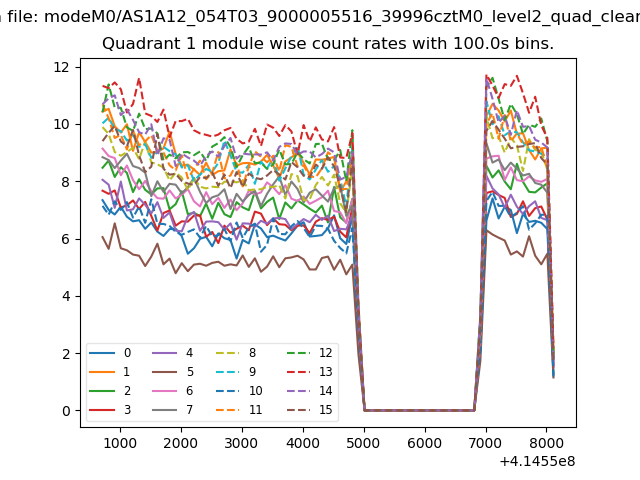
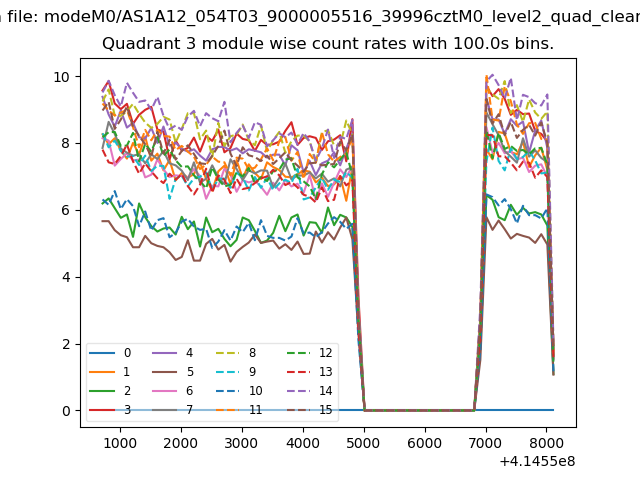
| Module-wise count rates for Quadrant A Data is divided into 100 sec bins |
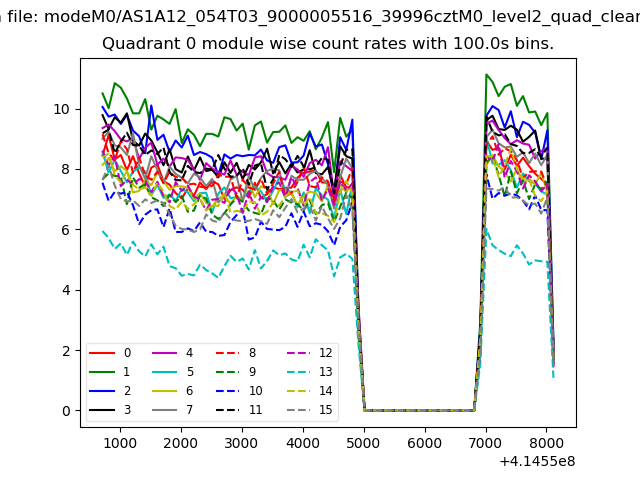 |
 |
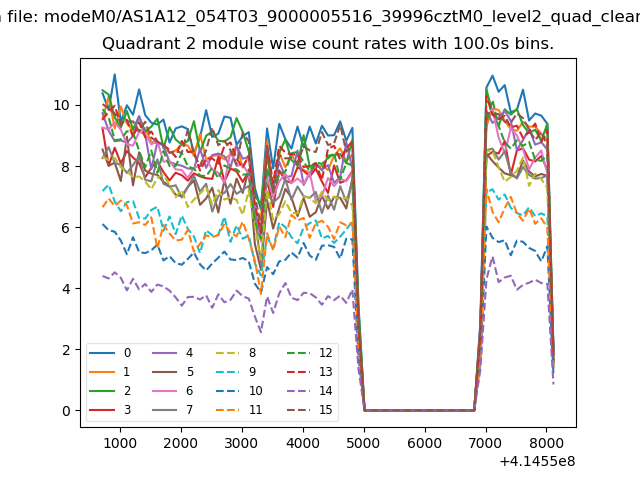
| Module-wise count rates for Quadrant B Data is divided into 100 sec bins |
 |
 |
| Module-wise count rates for Quadrant C Data is divided into 100 sec bins |
 |
 |
| Module-wise count rates for Quadrant D Data is divided into 100 sec bins |
 |
 |
| Parameter | Plot |
|---|---|
| CZT HV Monitor | 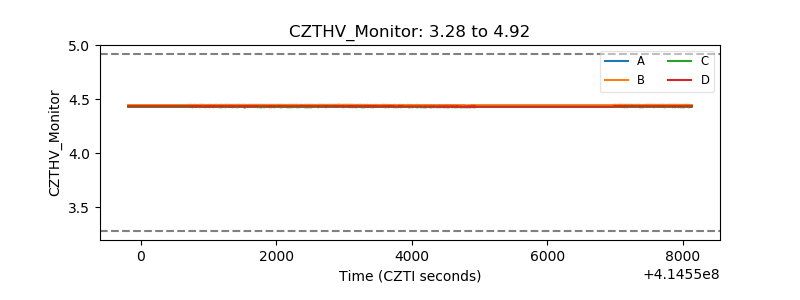 |
| D_VDD | 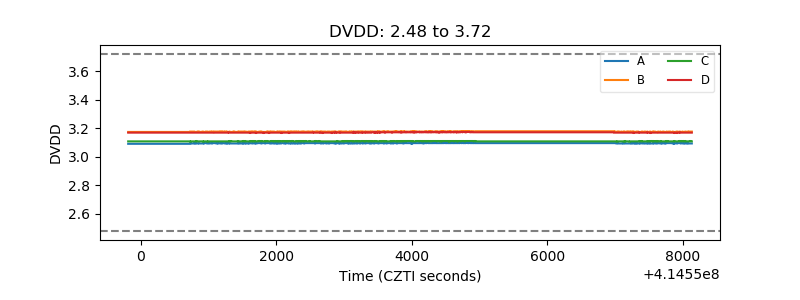 |
| Temperature 1 | 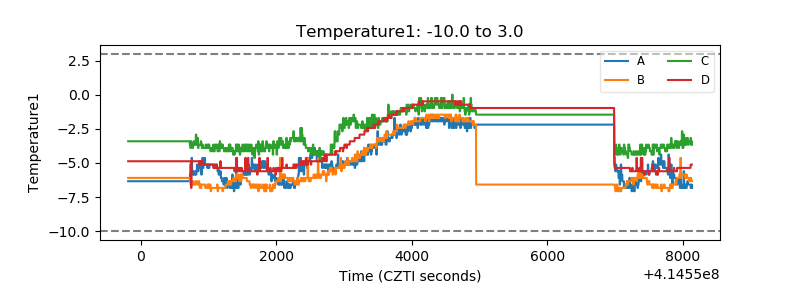 |
| Veto HV Monitor | 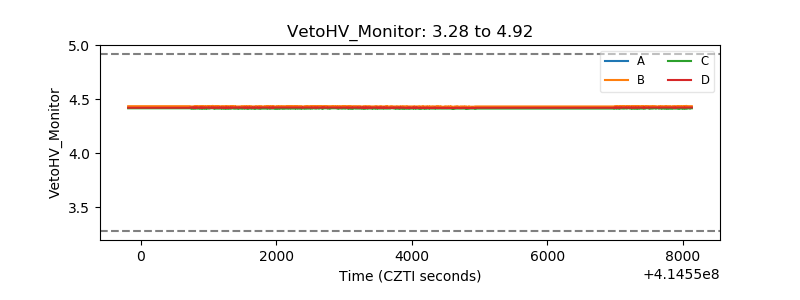 |
| Veto LLD | 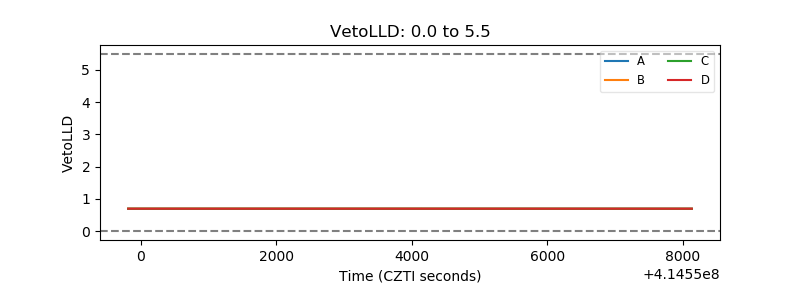 |
| Alpha Counter | 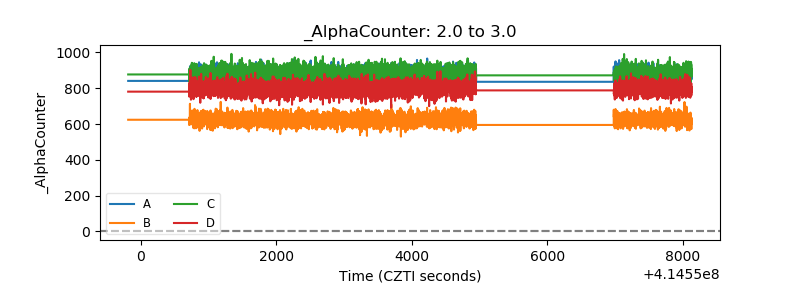 |
| _CPM_Rate | 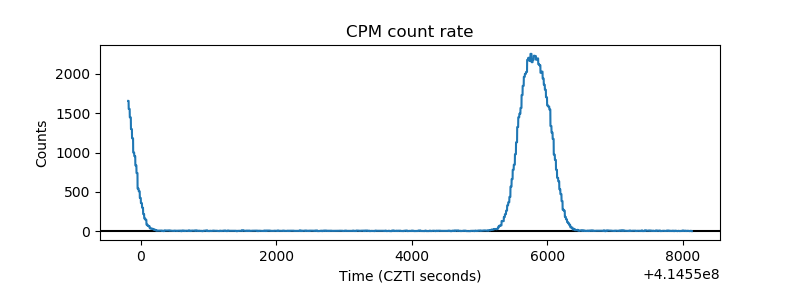 |
| CZT Counter | 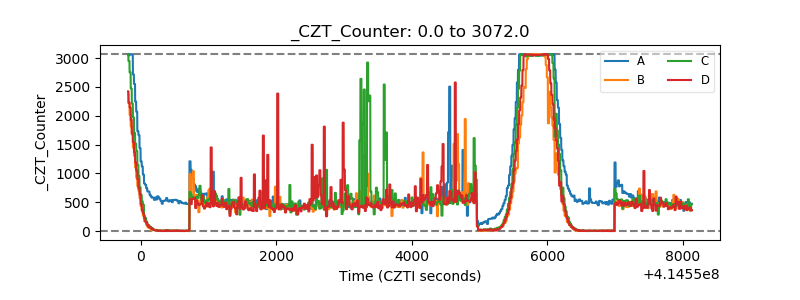 |
| +2.5 Volts monitor | 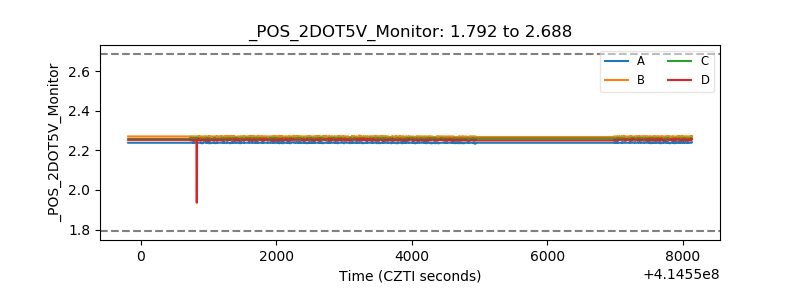 |
| +5 Volts monitor | 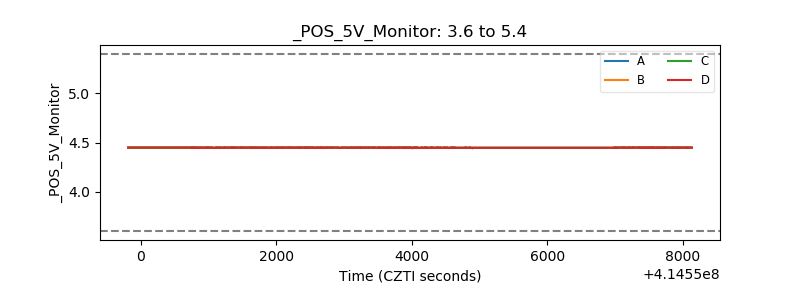 |
| _ROLL_ROT | 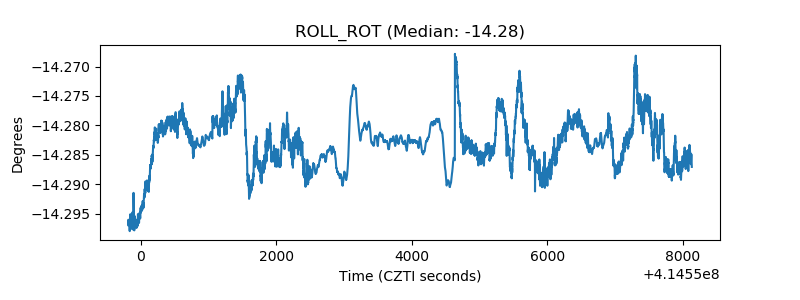 |
| _Roll_DEC | 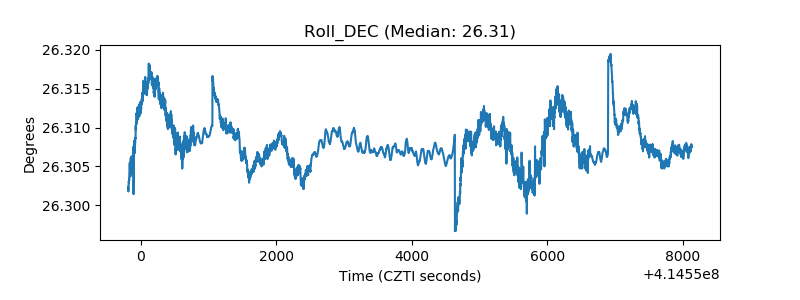 |
| _Roll_RA | 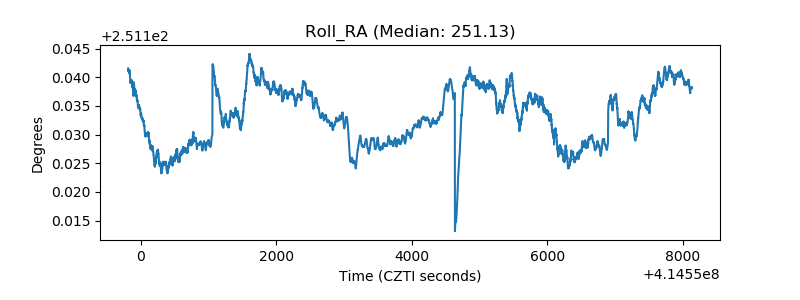 |
| Veto Counter | 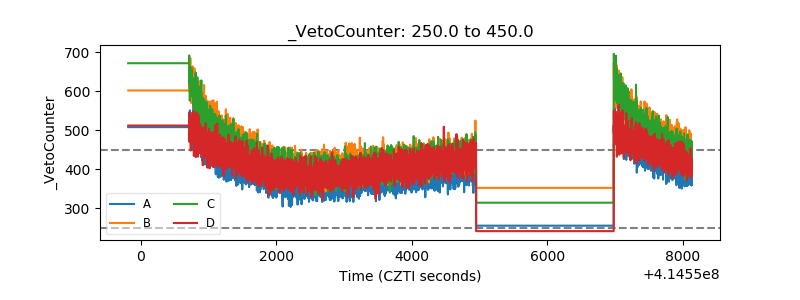 |