| Param | Original file | Final file |
|---|---|---|
| Filename | modeM0/AS1A12_054T03_9000005516_39997cztM0_level2.fits | modeM0/AS1A12_054T03_9000005516_39997cztM0_level2_quad_clean.evt |
| Size (bytes) | 313,594,560 | 95,319,360 |
| Size | 299.1 MB | 90.9 MB |
| Events in quadrant A | 2,867,121 | 645,146 |
| Events in quadrant B | 2,763,866 | 668,256 |
| Events in quadrant C | 2,576,404 | 638,251 |
| Events in quadrant D | 2,992,016 | 567,332 |
| Mode M9 | |||
|---|---|---|---|
| Quadrant | BADHDUFLAG | Total packets | Discarded packets |
| A | 0 | 33 | 0 |
| B | 0 | 33 | 0 |
| C | 0 | 33 | 0 |
| D | 0 | 34 | 0 |
| Mode SS | |||
|---|---|---|---|
| Quadrant | BADHDUFLAG | Total packets | Discarded packets |
| A | 0 | 108 | 0 |
| B | 0 | 108 | 0 |
| C | 0 | 108 | 0 |
| D | 0 | 108 | 0 |
| Mode M0 | |||
|---|---|---|---|
| Quadrant | BADHDUFLAG | Total packets | Discarded packets |
| A | 0 | 11707 | 3 |
| B | 0 | 11677 | 2 |
| C | 0 | 10759 | 2 |
| D | 0 | 12704 | 2 |
| Quadrant | Total seconds | Saturated seconds | Saturation percentage |
|---|---|---|---|
| A | 5243 | 20 | 0.381461% |
| B | 5243 | 74 | 1.411406% |
| C | 5243 | 8 | 0.152584% |
| D | 5243 | 137 | 2.613008% |
Noise dominated data is calculated using 1-second bins in cleaned event files. If a bin has >2000 counts, and if more than 50% of those come from <1% of pixels, then it is considered to be noise-dominated and hence unusable.
| Quadrant | # 1 sec bins | Bins with >0 counts | Bins with >2000 counts | High rate bins dominated by noise | Noise dominated (total time) | Noise dominated (detector-on time) | Marked lightcurve |
|---|---|---|---|---|---|---|---|
| A | 7366 | 5244 | 9 | 9 | 0.12% | 0.17% | 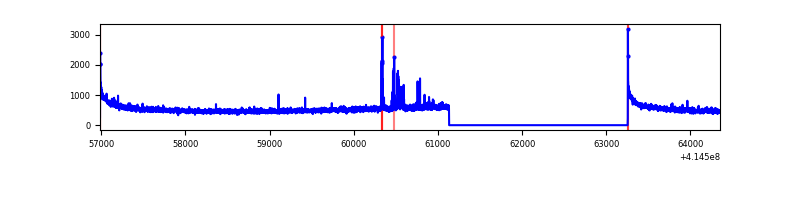 |
| B | 7366 | 5244 | 38 | 38 | 0.52% | 0.72% | 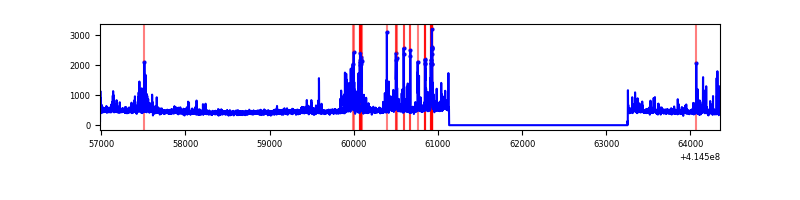 |
| C | 7366 | 5244 | 7 | 7 | 0.10% | 0.13% | 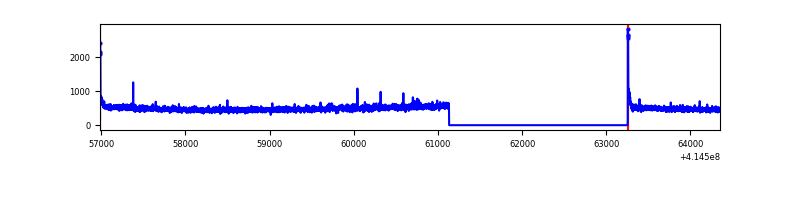 |
| D | 7366 | 5244 | 90 | 90 | 1.22% | 1.72% | 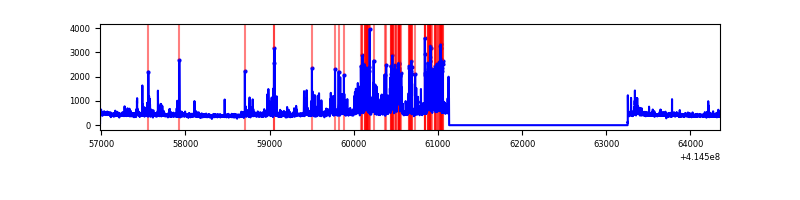 |
Top three noisy pixels from each quadrant. If the there are fewer than three noisy pixels in the level2.evt file, extra rows are filled as -1
| Pixel properties | Quadrant properties | ||||||
|---|---|---|---|---|---|---|---|
| Quadrant | DetID | PixID | Counts | Sigma | Mean | Median | Sigma |
| A | 10 | 83 | 462066 | 3813.71 | 601 | 592 | 121.0 |
| A | 13 | 248 | 62400 | 510.79 | 601 | 592 | 121.0 |
| A | 12 | 189 | 7888 | 60.3 | 601 | 592 | 121.0 |
| B | 4 | 171 | 337685 | 2937.93 | 601 | 586 | 114.7 |
| B | 15 | 85 | 26020 | 221.67 | 601 | 586 | 114.7 |
| B | 12 | 111 | 13686 | 114.17 | 601 | 586 | 114.7 |
| C | 15 | 214 | 220617 | 1608.86 | 588 | 594 | 136.8 |
| C | 0 | 10 | 35687 | 256.61 | 588 | 594 | 136.8 |
| C | 7 | 220 | 12385 | 86.22 | 588 | 594 | 136.8 |
| D | 2 | 250 | 305203 | 2158.61 | 576 | 560 | 141.1 |
| D | 12 | 227 | 145111 | 1024.25 | 576 | 560 | 141.1 |
| D | 12 | 233 | 110039 | 775.74 | 576 | 560 | 141.1 |
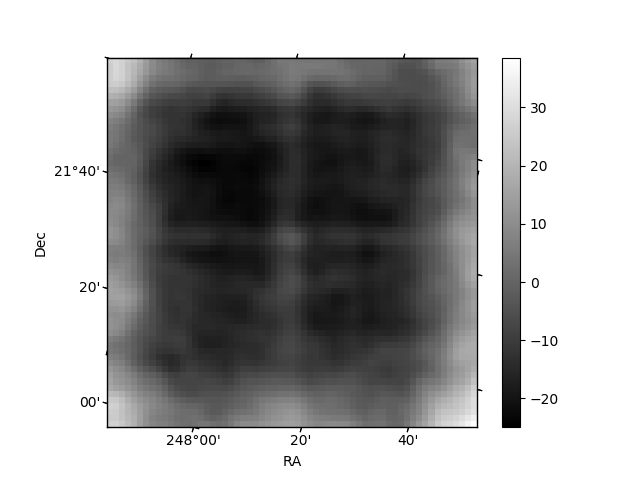
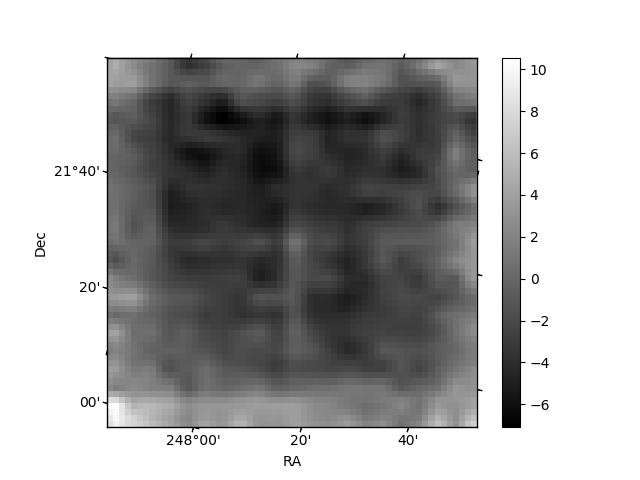
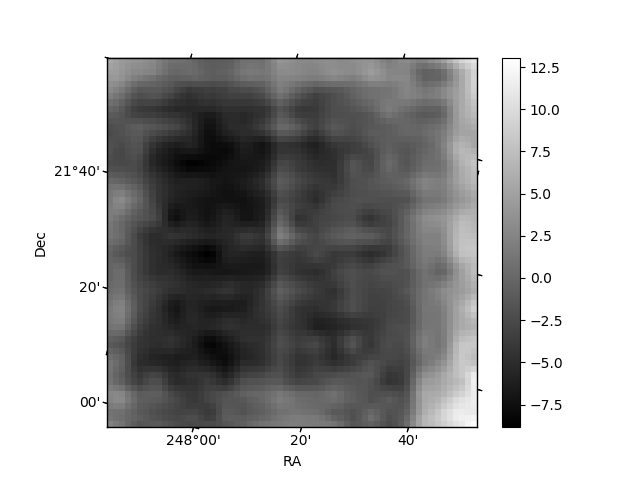
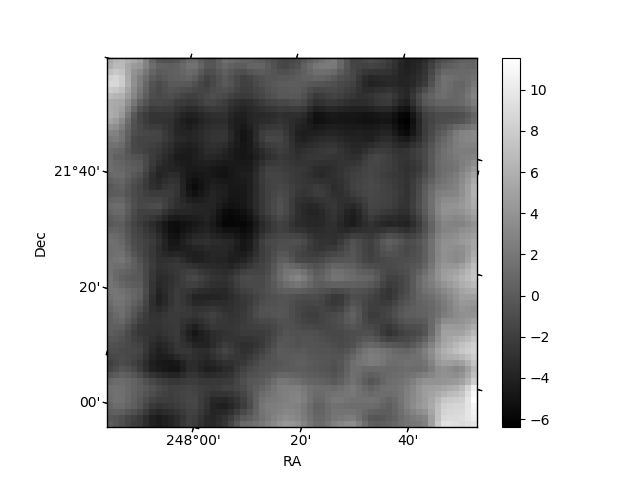
Histogram calculated using DETX and DETY for each event in the final _common_clean file
| Quadrant A | 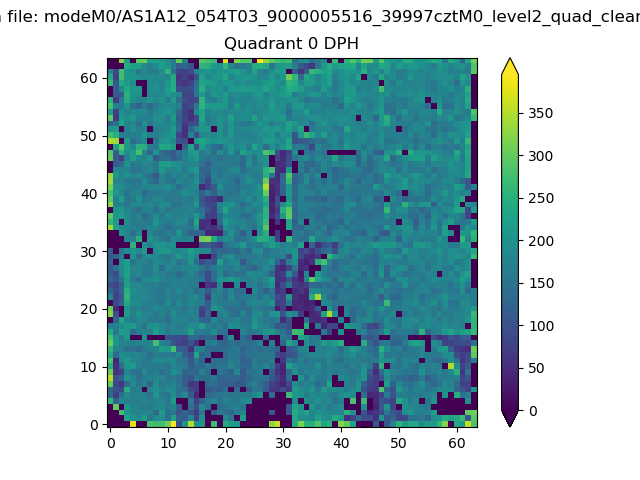 |
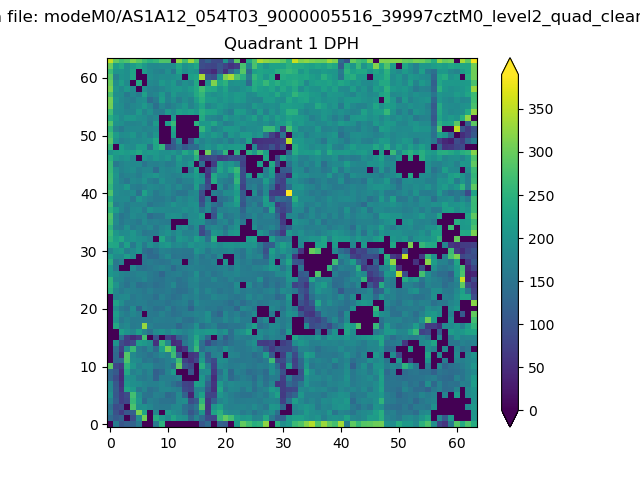 |
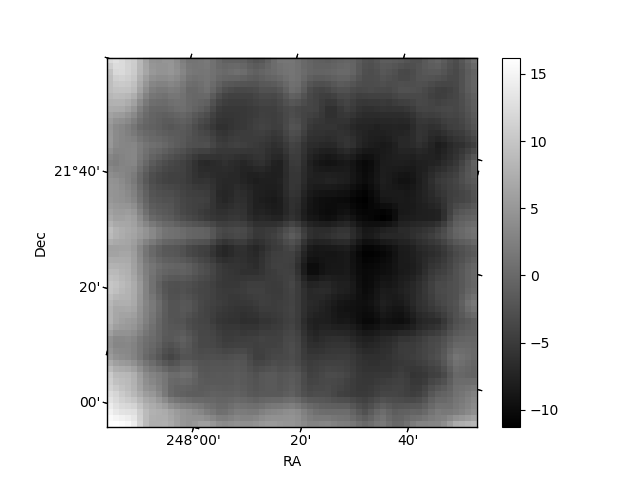
Quadrant B |
|---|---|---|---|
| Quadrant D | 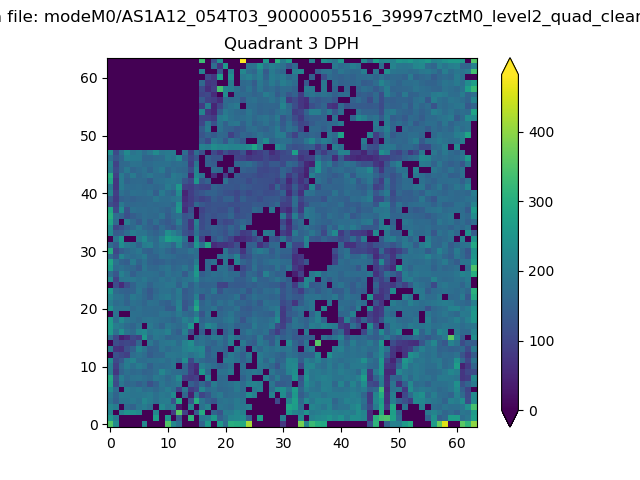 |
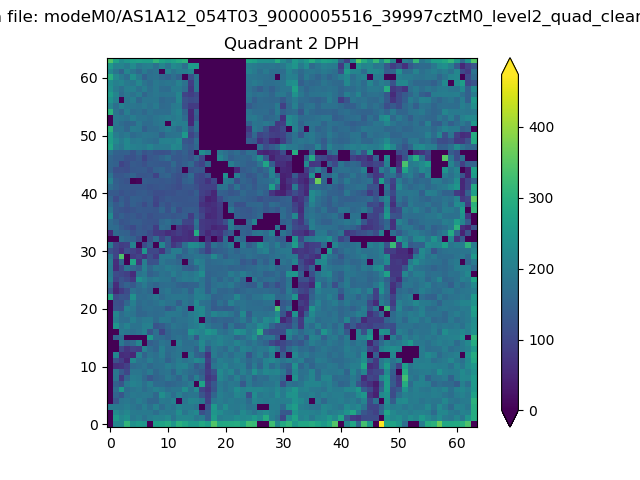 |
Quadrant C |
| Plot type | Count rate plots | Images |
|---|---|---|
| Comparison with Poisson distribution Blue bars denote a histogram of data divided into 1 sec bins. Red curve is a Poisson curve with rate = median count rate of data. |
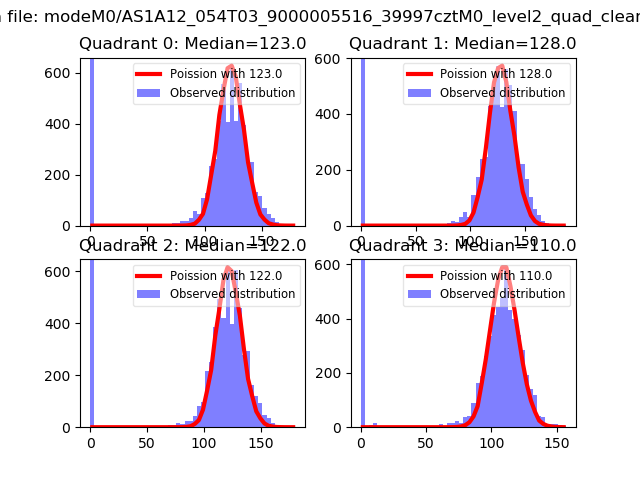 |
 |
| Quadrant-wise count rates Data is divided into 100 sec bins |
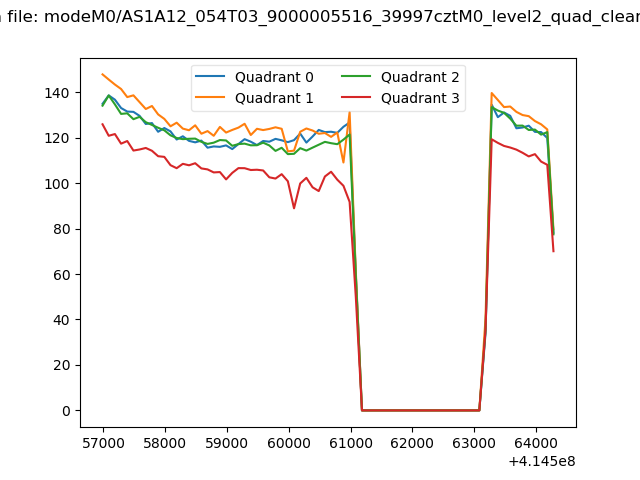 |
|
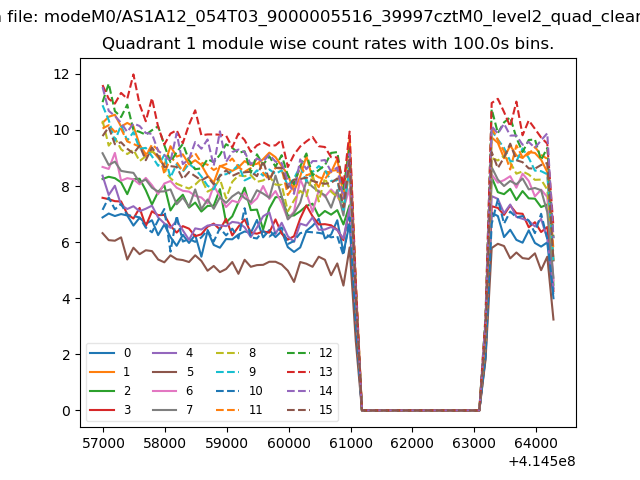
| Module-wise count rates for Quadrant A Data is divided into 100 sec bins |
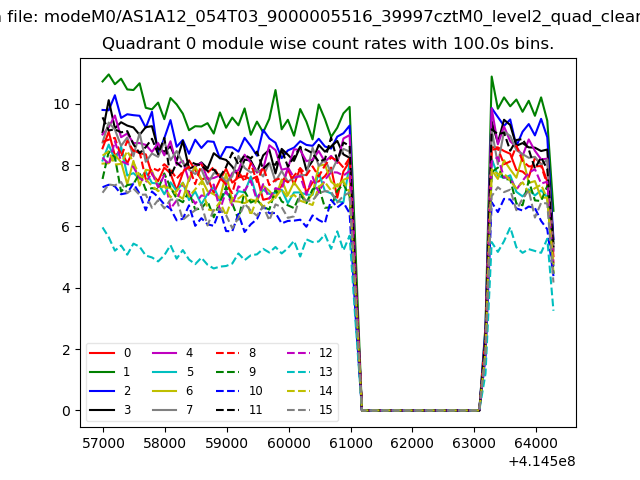 |
 |
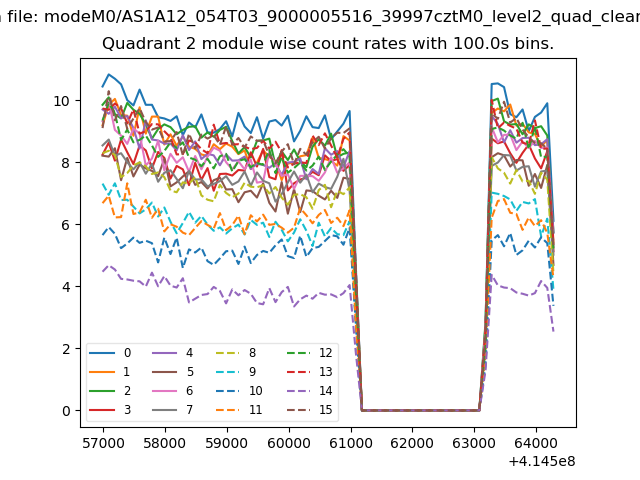
| Module-wise count rates for Quadrant B Data is divided into 100 sec bins |
 |
 |
| Module-wise count rates for Quadrant C Data is divided into 100 sec bins |
 |
 |
| Module-wise count rates for Quadrant D Data is divided into 100 sec bins |
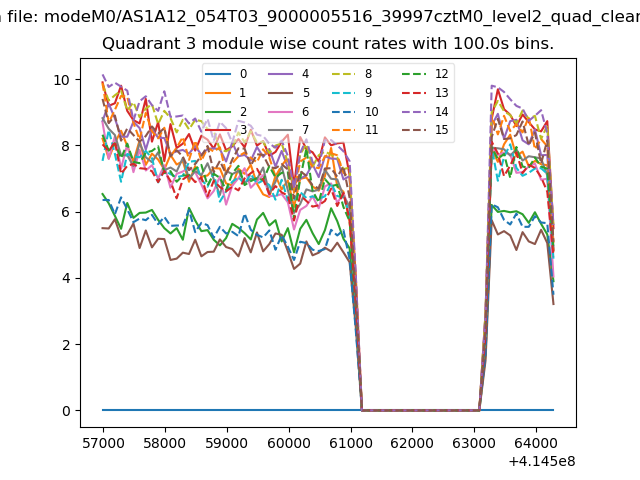 |
 |
| Parameter | Plot |
|---|---|
| CZT HV Monitor | 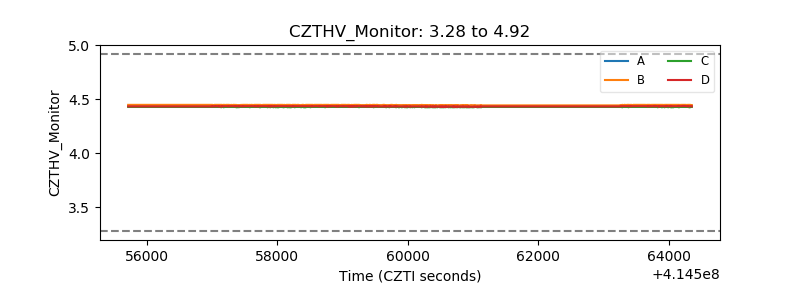 |
| D_VDD | 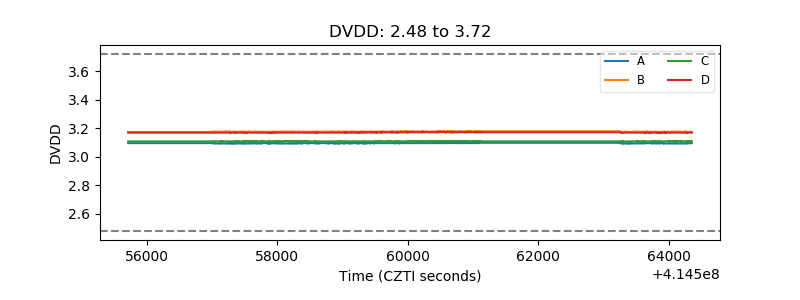 |
| Temperature 1 | 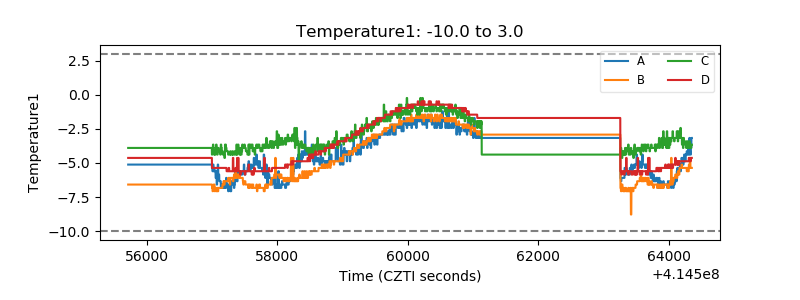 |
| Veto HV Monitor | 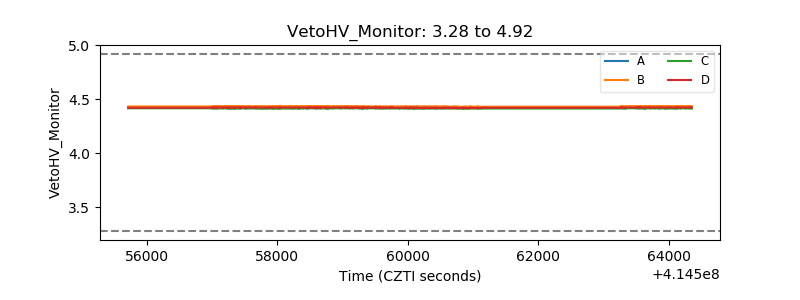 |
| Veto LLD | 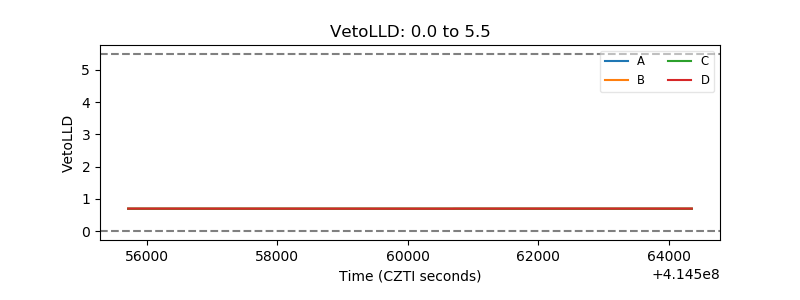 |
| Alpha Counter | 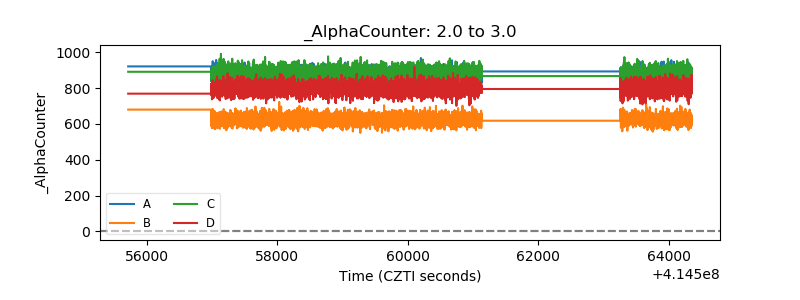 |
| _CPM_Rate | 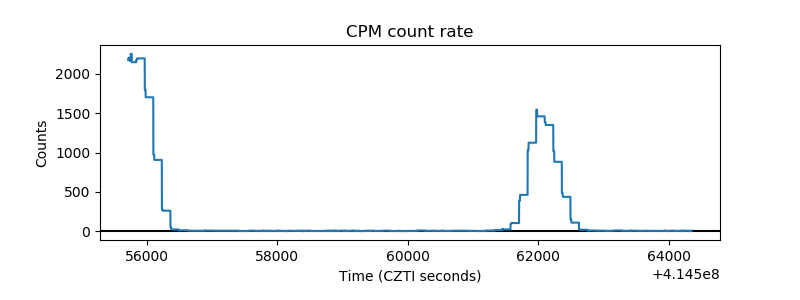 |
| CZT Counter | 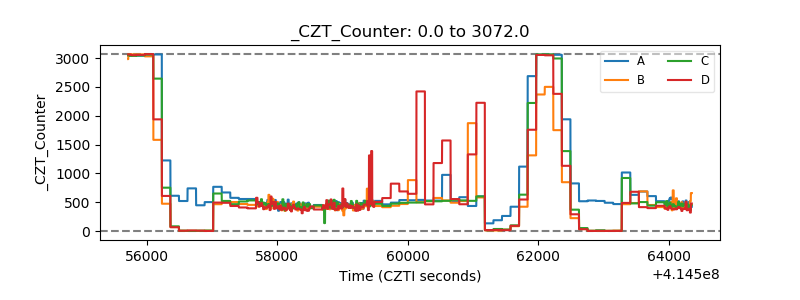 |
| +2.5 Volts monitor | 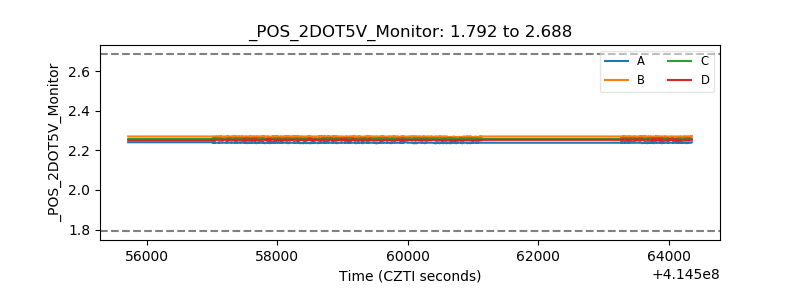 |
| +5 Volts monitor | 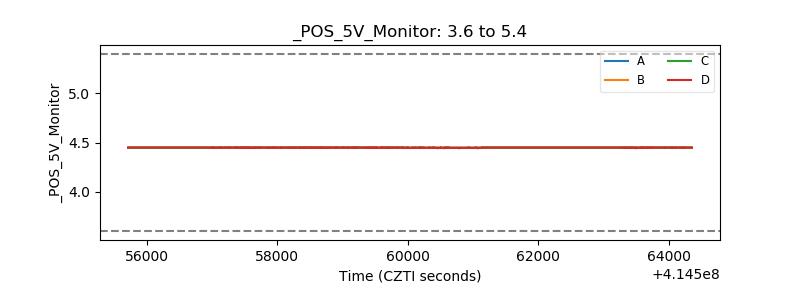 |
| _ROLL_ROT | 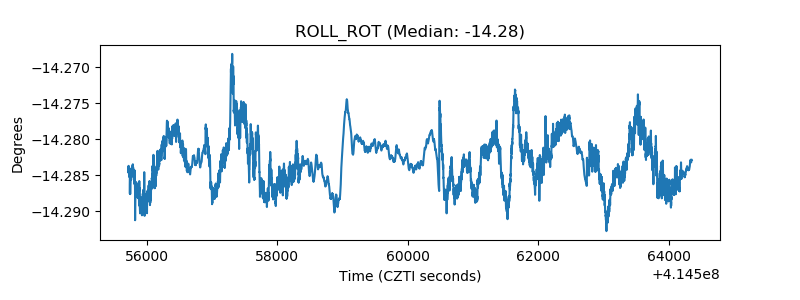 |
| _Roll_DEC | 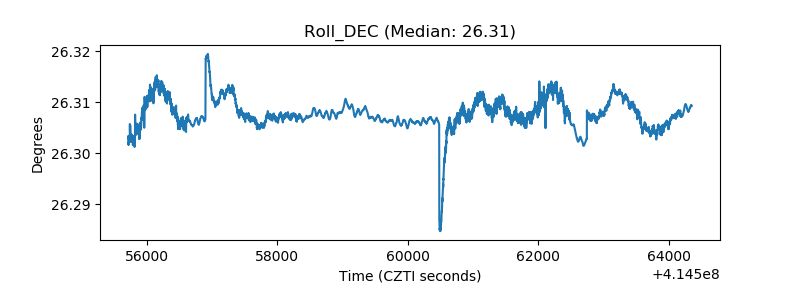 |
| _Roll_RA | 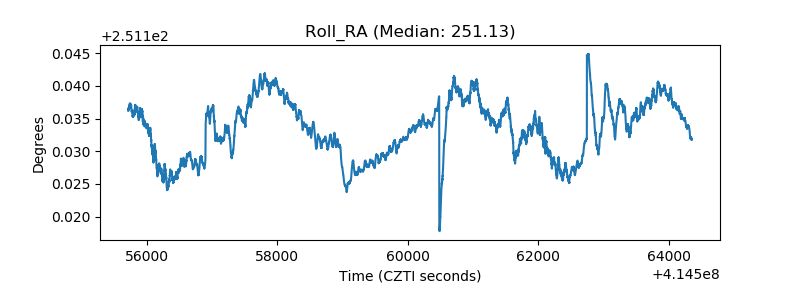 |
| Veto Counter | 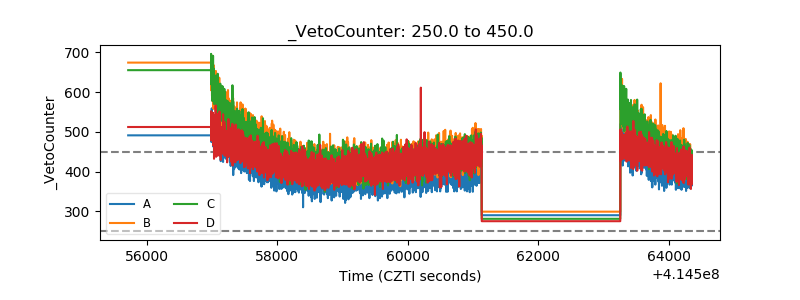 |