| Param | Original file | Final file |
|---|---|---|
| Filename | modeM0/AS1A12_054T03_9000005516_39998cztM0_level2.fits | modeM0/AS1A12_054T03_9000005516_39998cztM0_level2_quad_clean.evt |
| Size (bytes) | 316,327,680 | 90,302,400 |
| Size | 301.7 MB | 86.1 MB |
| Events in quadrant A | 2,841,472 | 608,161 |
| Events in quadrant B | 2,471,147 | 636,397 |
| Events in quadrant C | 2,477,835 | 602,721 |
| Events in quadrant D | 3,520,081 | 528,642 |
| Mode M9 | |||
|---|---|---|---|
| Quadrant | BADHDUFLAG | Total packets | Discarded packets |
| A | 0 | 24 | 0 |
| B | 0 | 24 | 0 |
| C | 0 | 24 | 0 |
| D | 0 | 25 | 0 |
| Mode SS | |||
|---|---|---|---|
| Quadrant | BADHDUFLAG | Total packets | Discarded packets |
| A | 0 | 104 | 0 |
| B | 0 | 104 | 0 |
| C | 0 | 104 | 0 |
| D | 0 | 104 | 0 |
| Mode M0 | |||
|---|---|---|---|
| Quadrant | BADHDUFLAG | Total packets | Discarded packets |
| A | 0 | 11486 | 3 |
| B | 0 | 10724 | 2 |
| C | 0 | 10471 | 2 |
| D | 0 | 14024 | 2 |
| Quadrant | Total seconds | Saturated seconds | Saturation percentage |
|---|---|---|---|
| A | 5117 | 42 | 0.820793% |
| B | 5117 | 18 | 0.351769% |
| C | 5117 | 11 | 0.214970% |
| D | 5117 | 271 | 5.296072% |
Noise dominated data is calculated using 1-second bins in cleaned event files. If a bin has >2000 counts, and if more than 50% of those come from <1% of pixels, then it is considered to be noise-dominated and hence unusable.
| Quadrant | # 1 sec bins | Bins with >0 counts | Bins with >2000 counts | High rate bins dominated by noise | Noise dominated (total time) | Noise dominated (detector-on time) | Marked lightcurve |
|---|---|---|---|---|---|---|---|
| A | 7270 | 5118 | 31 | 31 | 0.43% | 0.61% | 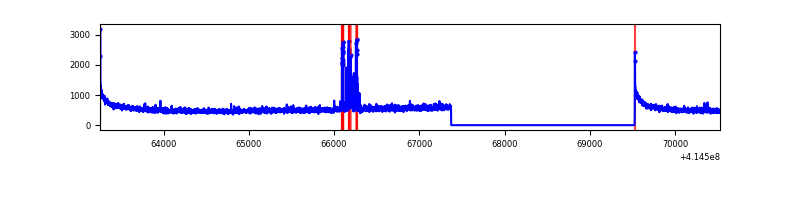 |
| B | 7270 | 5118 | 9 | 9 | 0.12% | 0.18% | 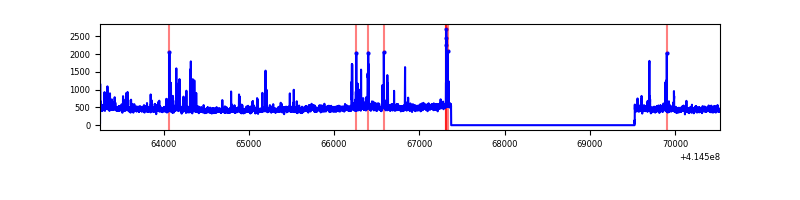 |
| C | 7270 | 5118 | 8 | 8 | 0.11% | 0.16% | 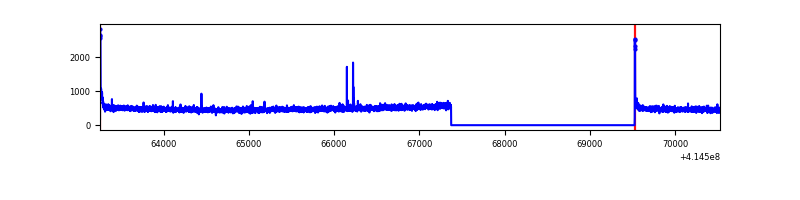 |
| D | 7270 | 5118 | 244 | 244 | 3.36% | 4.77% | 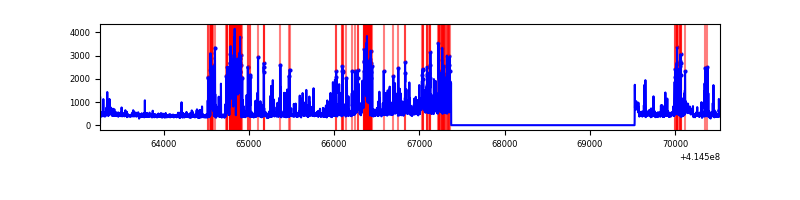 |
Top three noisy pixels from each quadrant. If the there are fewer than three noisy pixels in the level2.evt file, extra rows are filled as -1
| Pixel properties | Quadrant properties | ||||||
|---|---|---|---|---|---|---|---|
| Quadrant | DetID | PixID | Counts | Sigma | Mean | Median | Sigma |
| A | 10 | 83 | 462336 | 3854.02 | 582 | 571 | 119.8 |
| A | 13 | 248 | 104625 | 868.46 | 582 | 571 | 119.8 |
| A | 12 | 189 | 15359 | 123.42 | 582 | 571 | 119.8 |
| B | 4 | 171 | 132727 | 1194.99 | 579 | 565 | 110.6 |
| B | 4 | 170 | 25901 | 229.08 | 579 | 565 | 110.6 |
| B | 15 | 85 | 14632 | 127.19 | 579 | 565 | 110.6 |
| C | 15 | 214 | 216185 | 1631.2 | 566 | 571 | 132.2 |
| C | 0 | 10 | 38079 | 283.76 | 566 | 571 | 132.2 |
| C | 15 | 208 | 7533 | 52.67 | 566 | 571 | 132.2 |
| D | 2 | 250 | 747841 | 5502.09 | 552 | 536 | 135.8 |
| D | 12 | 227 | 358827 | 2637.95 | 552 | 536 | 135.8 |
| D | 13 | 249 | 117259 | 859.38 | 552 | 536 | 135.8 |
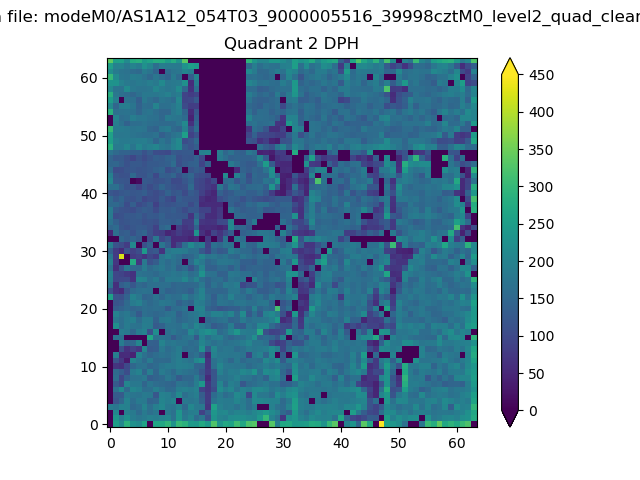
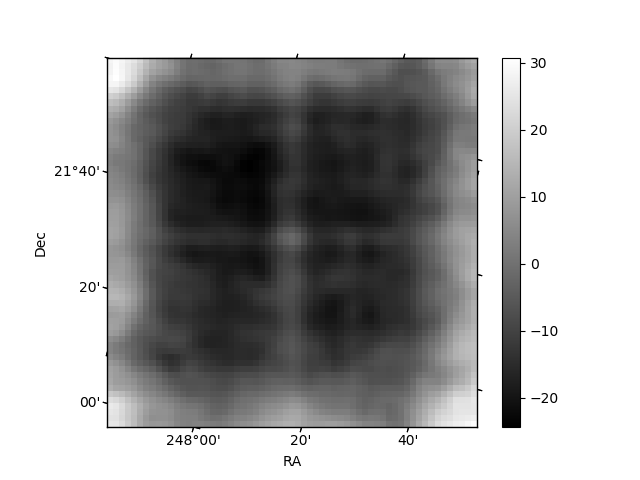
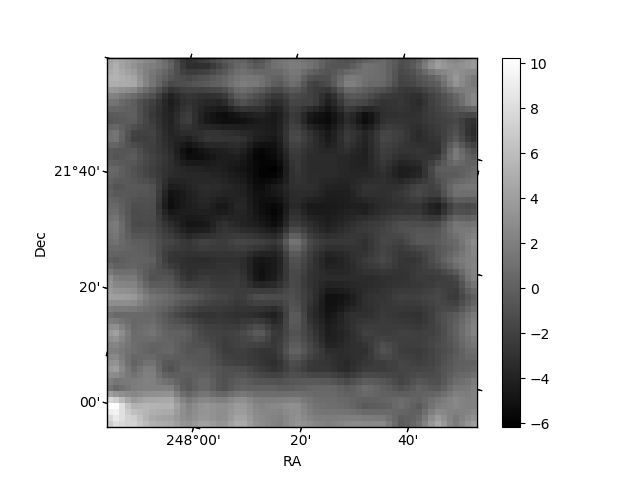
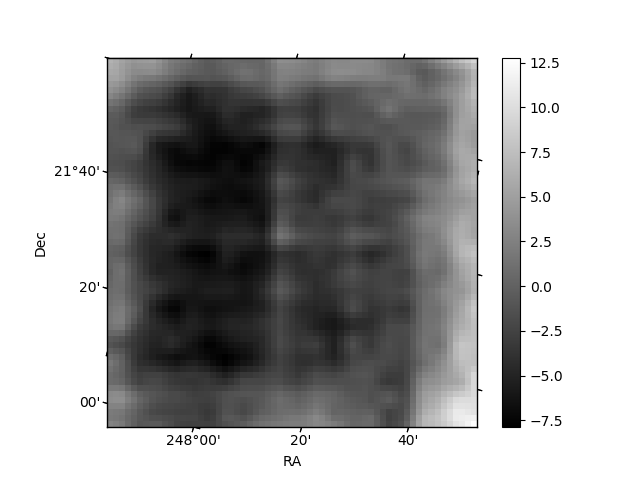
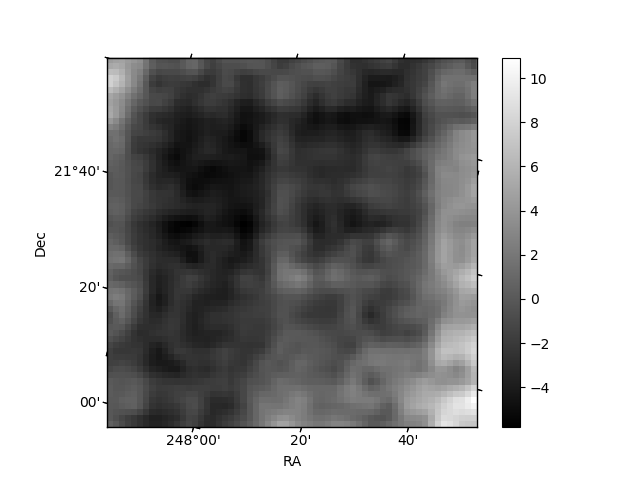
Histogram calculated using DETX and DETY for each event in the final _common_clean file
| Quadrant A | 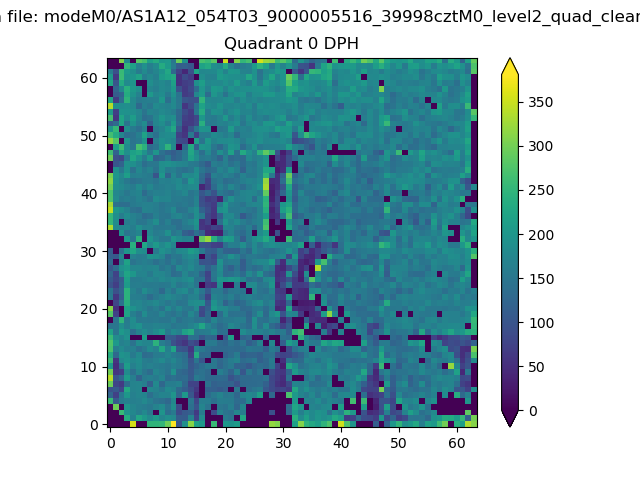 |
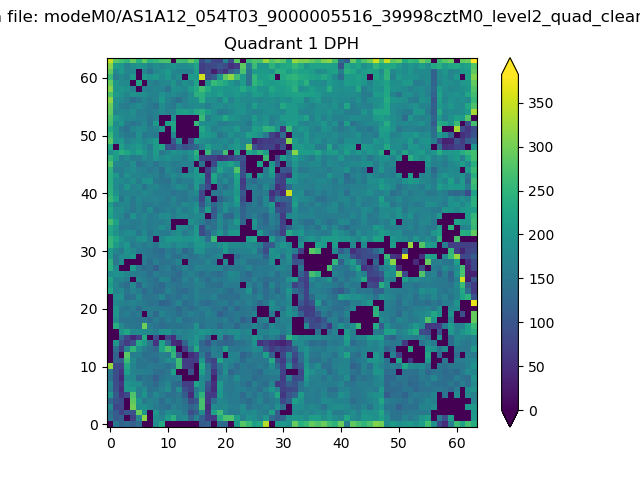 |
Quadrant B |
|---|---|---|---|
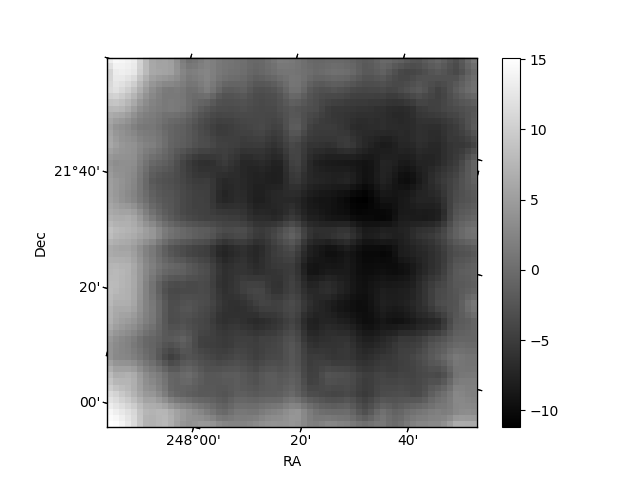
| Quadrant D | 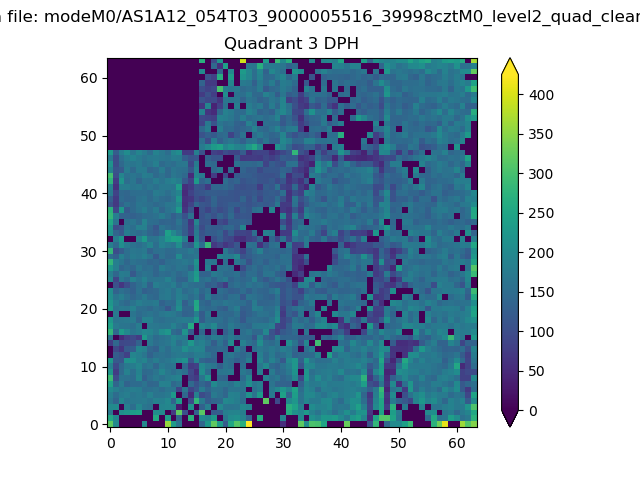 |
 |
Quadrant C |
| Plot type | Count rate plots | Images |
|---|---|---|
| Comparison with Poisson distribution Blue bars denote a histogram of data divided into 1 sec bins. Red curve is a Poisson curve with rate = median count rate of data. |
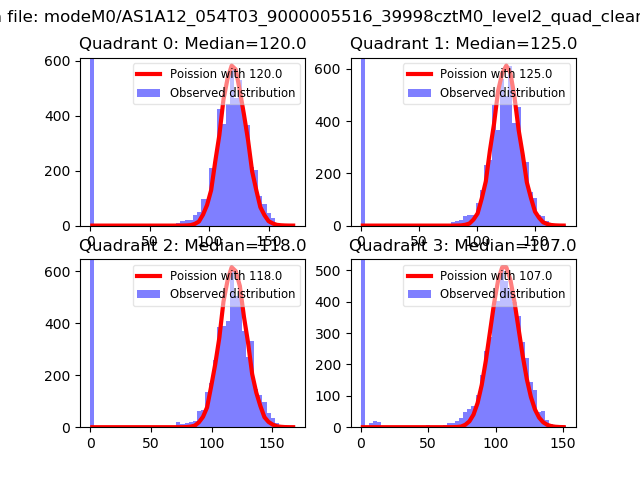 |
 |
| Quadrant-wise count rates Data is divided into 100 sec bins |
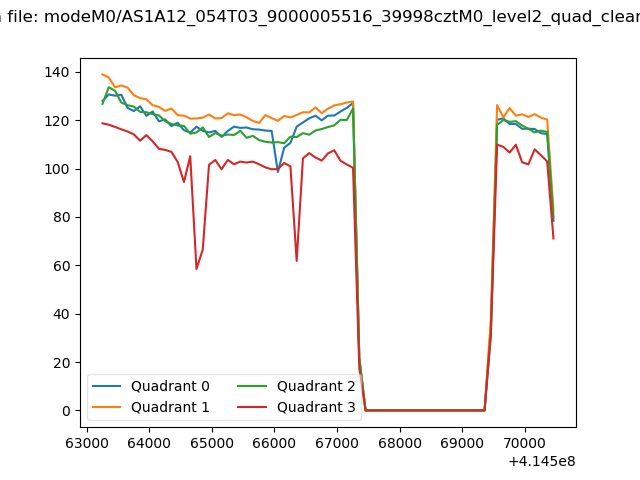 |
|
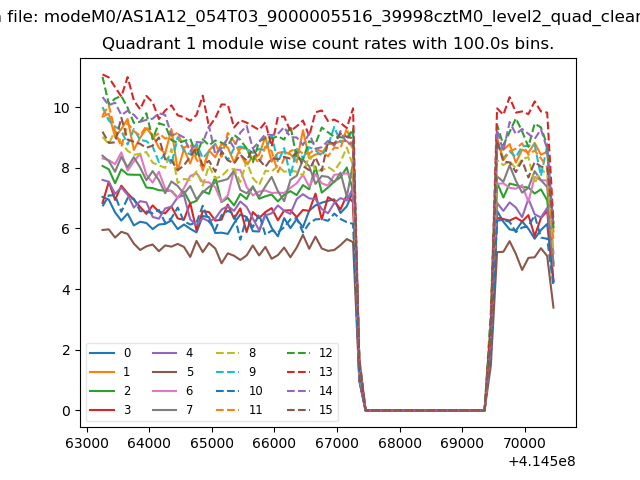
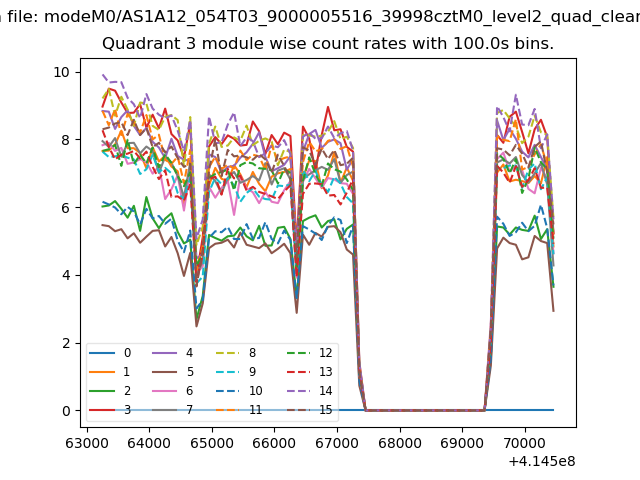
| Module-wise count rates for Quadrant A Data is divided into 100 sec bins |
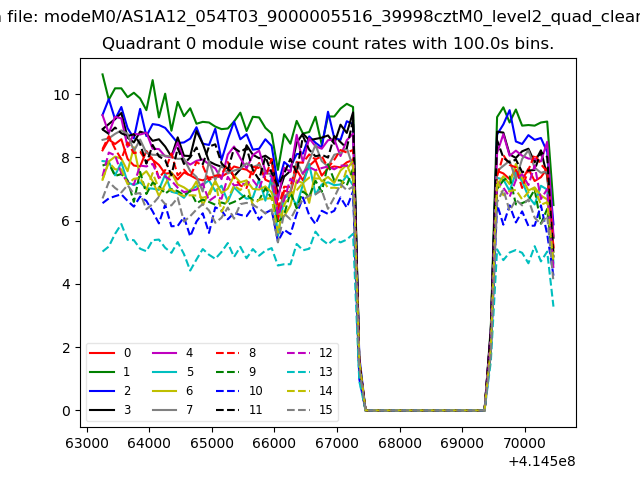 |
 |
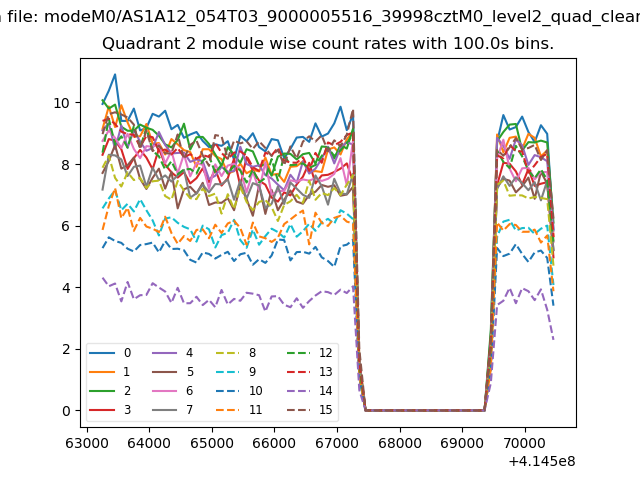
| Module-wise count rates for Quadrant B Data is divided into 100 sec bins |
 |
 |
| Module-wise count rates for Quadrant C Data is divided into 100 sec bins |
 |
 |
| Module-wise count rates for Quadrant D Data is divided into 100 sec bins |
 |
 |
| Parameter | Plot |
|---|---|
| CZT HV Monitor | 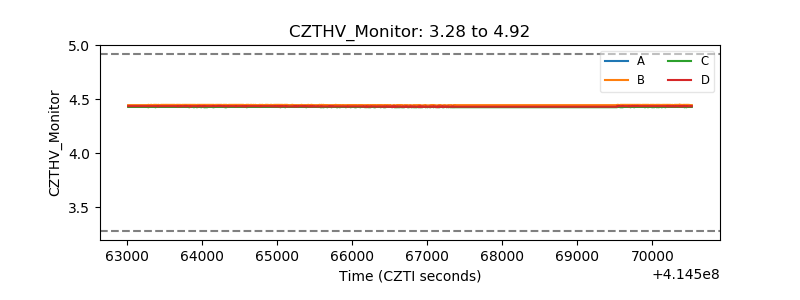 |
| D_VDD | 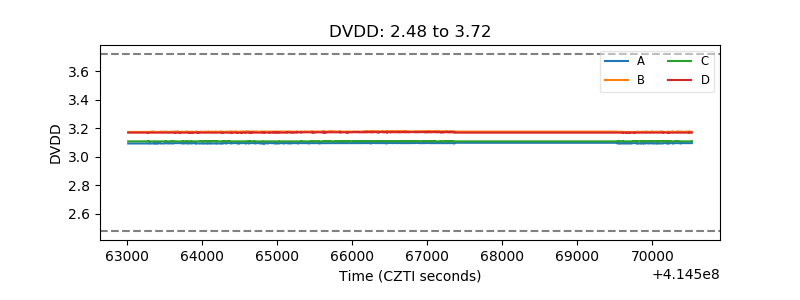 |
| Temperature 1 | 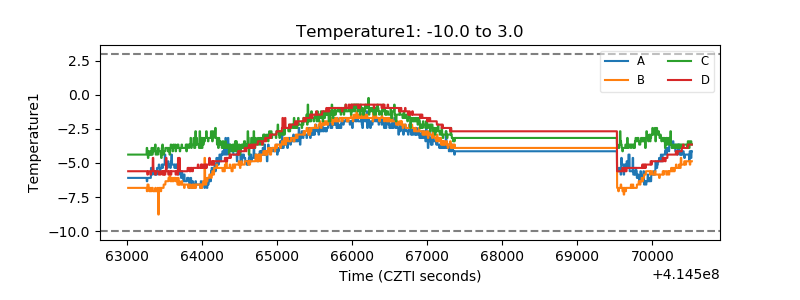 |
| Veto HV Monitor | 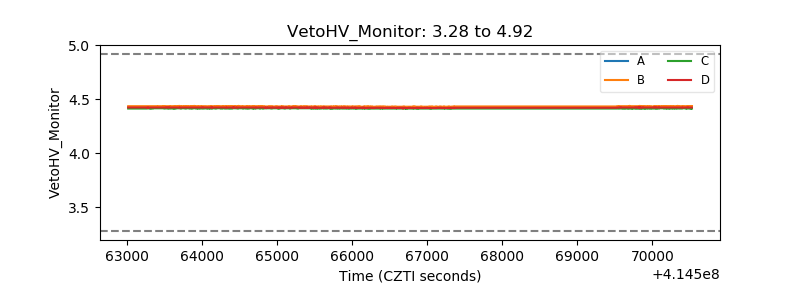 |
| Veto LLD | 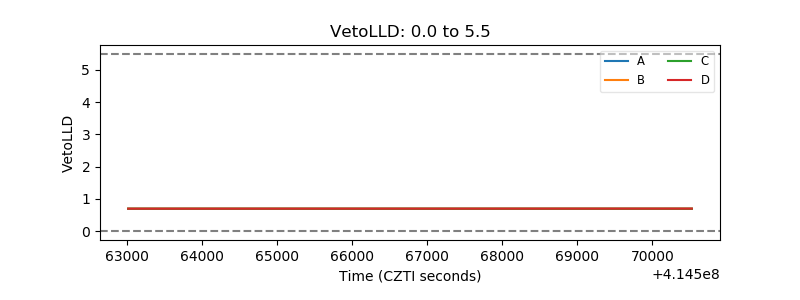 |
| Alpha Counter | 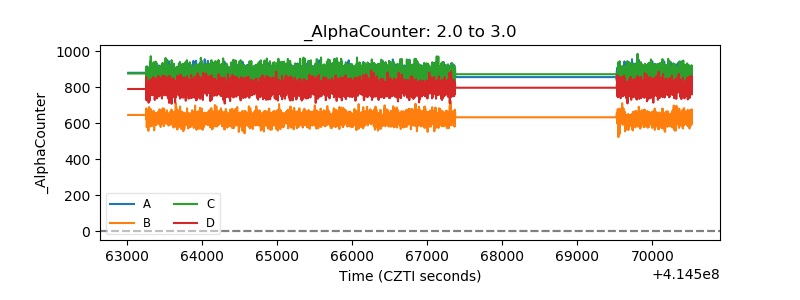 |
| _CPM_Rate | 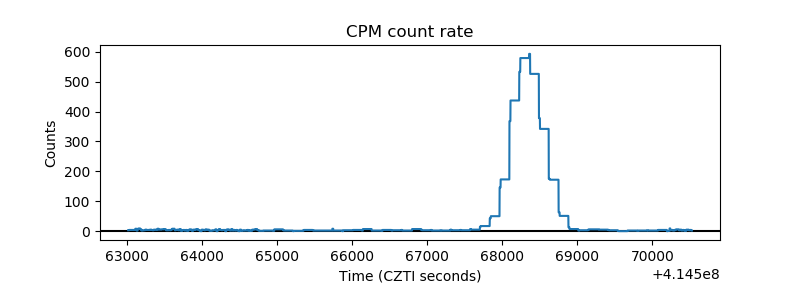 |
| CZT Counter | 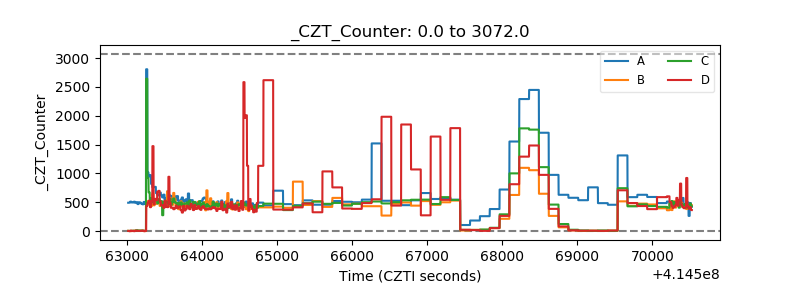 |
| +2.5 Volts monitor | 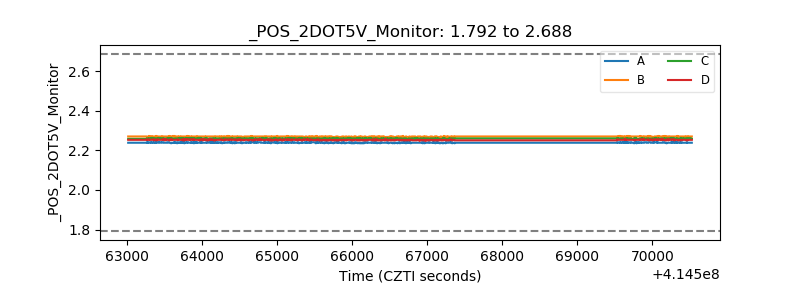 |
| +5 Volts monitor | 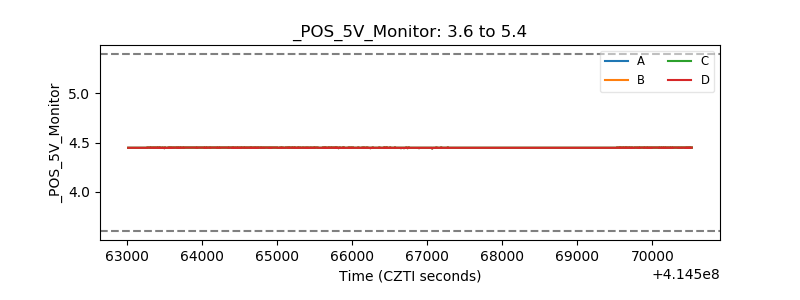 |
| _ROLL_ROT | 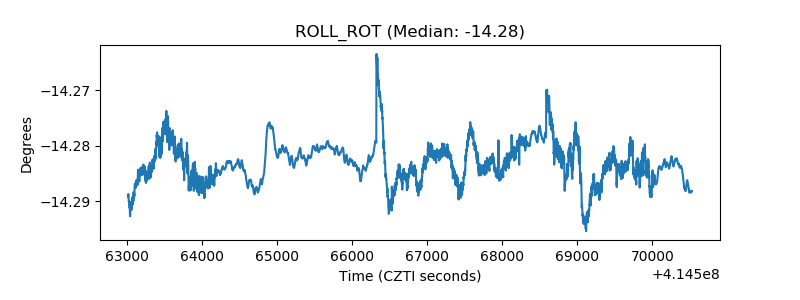 |
| _Roll_DEC | 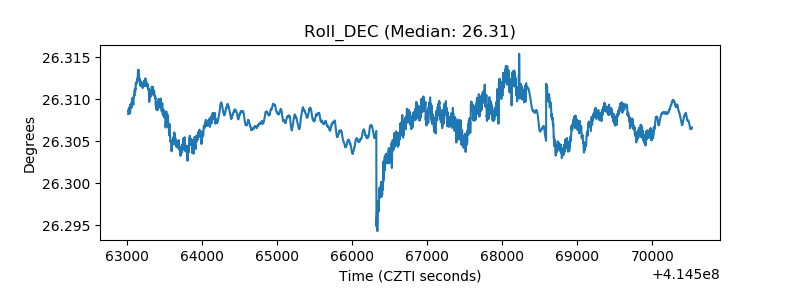 |
| _Roll_RA | 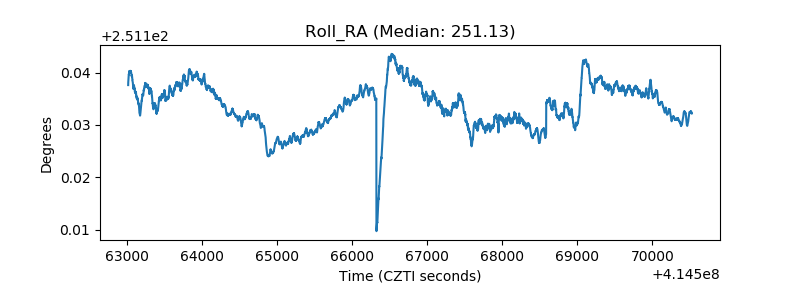 |
| Veto Counter | 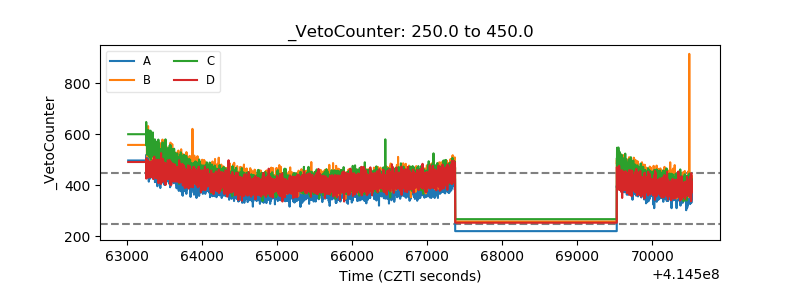 |