| Param | Original file | Final file |
|---|---|---|
| Filename | modeM0/AS1A12_054T03_9000005516_39999cztM0_level2.fits | modeM0/AS1A12_054T03_9000005516_39999cztM0_level2_quad_clean.evt |
| Size (bytes) | 387,250,560 | 82,926,720 |
| Size | 369.3 MB | 79.1 MB |
| Events in quadrant A | 2,776,255 | 582,237 |
| Events in quadrant B | 2,616,169 | 595,329 |
| Events in quadrant C | 3,512,623 | 552,204 |
| Events in quadrant D | 5,034,056 | 425,529 |
| Mode M9 | |||
|---|---|---|---|
| Quadrant | BADHDUFLAG | Total packets | Discarded packets |
| A | 0 | 26 | 0 |
| B | 0 | 26 | 0 |
| C | 0 | 26 | 0 |
| D | 0 | 27 | 0 |
| Mode SS | |||
|---|---|---|---|
| Quadrant | BADHDUFLAG | Total packets | Discarded packets |
| A | 0 | 102 | 0 |
| B | 0 | 102 | 0 |
| C | 0 | 102 | 0 |
| D | 0 | 102 | 0 |
| Mode M0 | |||
|---|---|---|---|
| Quadrant | BADHDUFLAG | Total packets | Discarded packets |
| A | 0 | 11210 | 3 |
| B | 0 | 11212 | 2 |
| C | 0 | 13792 | 2 |
| D | 0 | 18514 | 2 |
| Quadrant | Total seconds | Saturated seconds | Saturation percentage |
|---|---|---|---|
| A | 5079 | 15 | 0.295334% |
| B | 5079 | 100 | 1.968892% |
| C | 5079 | 262 | 5.158496% |
| D | 5079 | 1075 | 21.165584% |
Noise dominated data is calculated using 1-second bins in cleaned event files. If a bin has >2000 counts, and if more than 50% of those come from <1% of pixels, then it is considered to be noise-dominated and hence unusable.
| Quadrant | # 1 sec bins | Bins with >0 counts | Bins with >2000 counts | High rate bins dominated by noise | Noise dominated (total time) | Noise dominated (detector-on time) | Marked lightcurve |
|---|---|---|---|---|---|---|---|
| A | 7171 | 5080 | 12 | 12 | 0.17% | 0.24% | 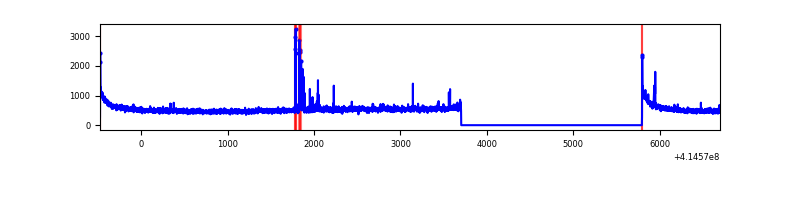 |
| B | 7171 | 5080 | 57 | 57 | 0.79% | 1.12% | 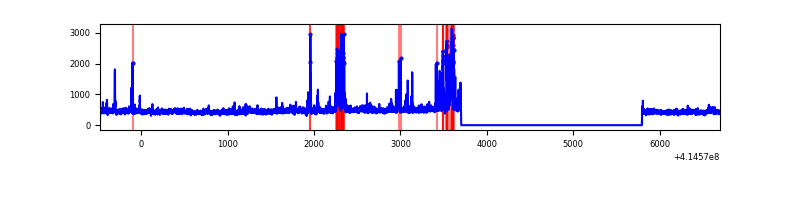 |
| C | 7171 | 5080 | 217 | 217 | 3.03% | 4.27% | 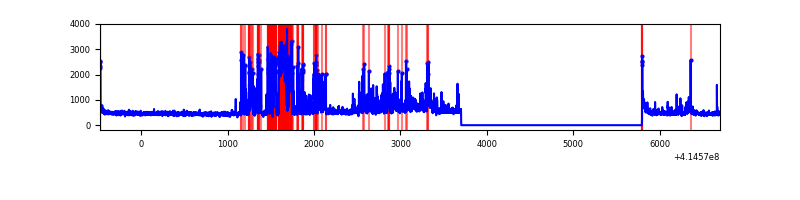 |
| D | 7171 | 5080 | 871 | 871 | 12.15% | 17.15% | 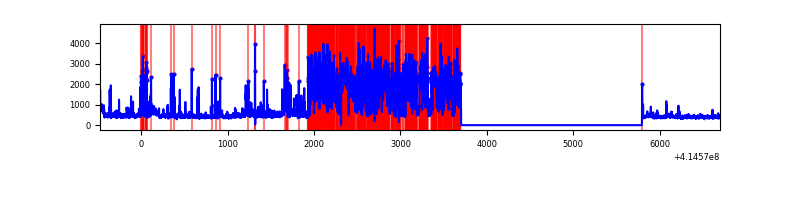 |
Top three noisy pixels from each quadrant. If the there are fewer than three noisy pixels in the level2.evt file, extra rows are filled as -1
| Pixel properties | Quadrant properties | ||||||
|---|---|---|---|---|---|---|---|
| Quadrant | DetID | PixID | Counts | Sigma | Mean | Median | Sigma |
| A | 10 | 83 | 471237 | 4057.96 | 569 | 557 | 116.0 |
| A | 13 | 248 | 74469 | 637.23 | 569 | 557 | 116.0 |
| A | 9 | 143 | 12423 | 102.3 | 569 | 557 | 116.0 |
| B | 4 | 171 | 333765 | 3054.98 | 563 | 548 | 109.1 |
| B | 0 | 230 | 32272 | 290.85 | 563 | 548 | 109.1 |
| B | 15 | 85 | 16236 | 143.83 | 563 | 548 | 109.1 |
| C | 14 | 254 | 1099268 | 8661.15 | 543 | 548 | 126.9 |
| C | 15 | 214 | 212098 | 1667.64 | 543 | 548 | 126.9 |
| C | 0 | 10 | 42258 | 328.8 | 543 | 548 | 126.9 |
| D | 2 | 250 | 2436945 | 19955.31 | 496 | 480 | 122.1 |
| D | 12 | 227 | 420336 | 3438.73 | 496 | 480 | 122.1 |
| D | 13 | 249 | 108073 | 881.22 | 496 | 480 | 122.1 |
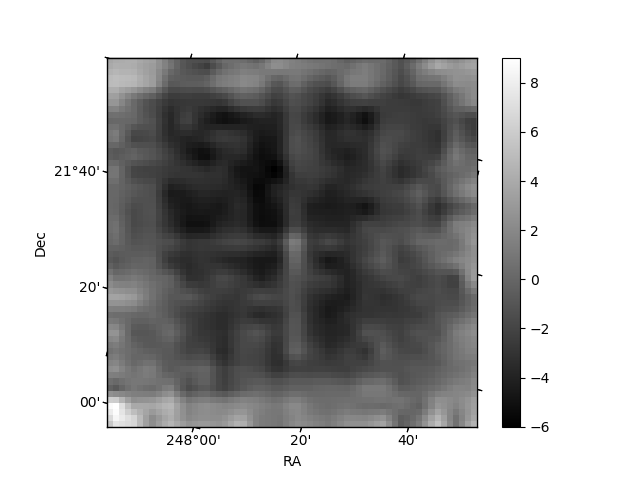
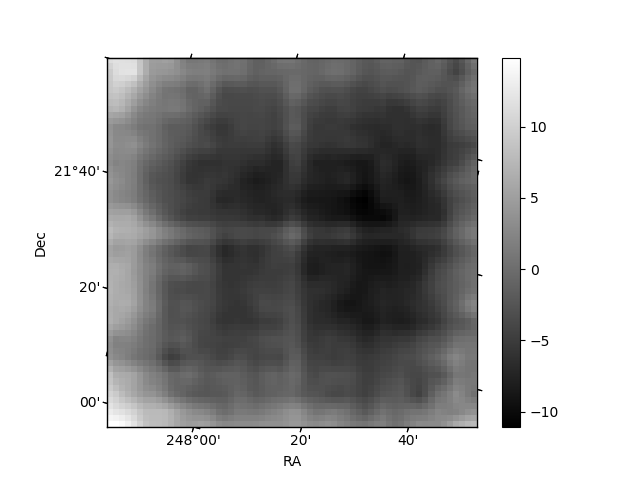
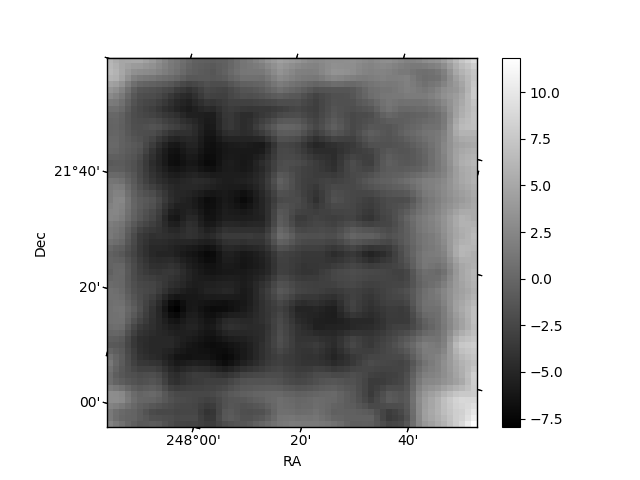
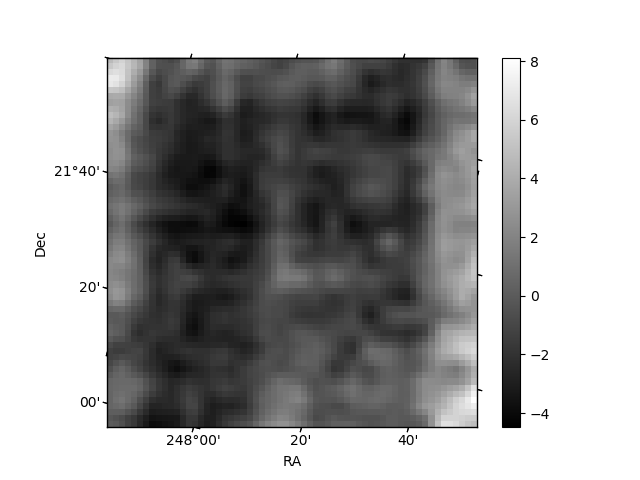
Histogram calculated using DETX and DETY for each event in the final _common_clean file
| Quadrant A | 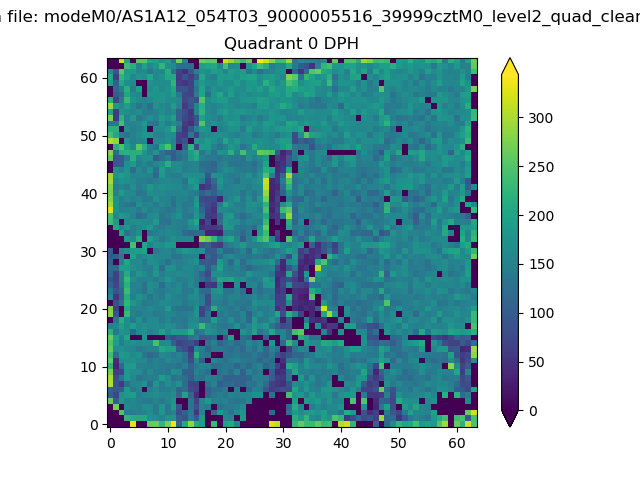 |
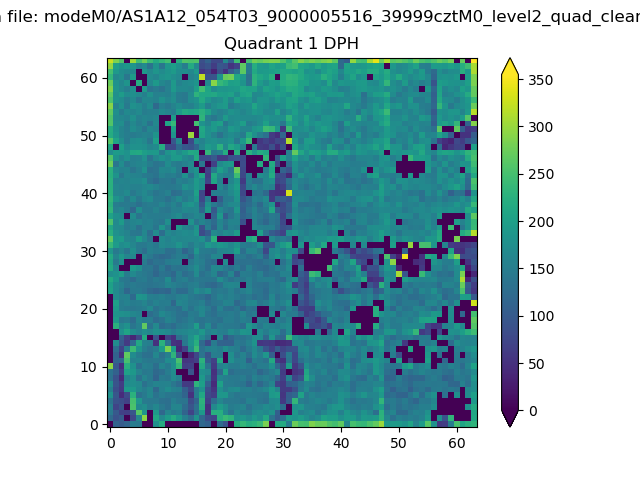 |
Quadrant B |
|---|---|---|---|
| Quadrant D | 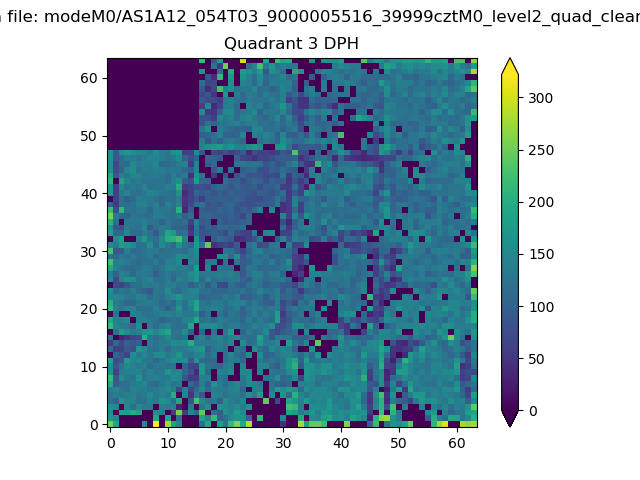 |
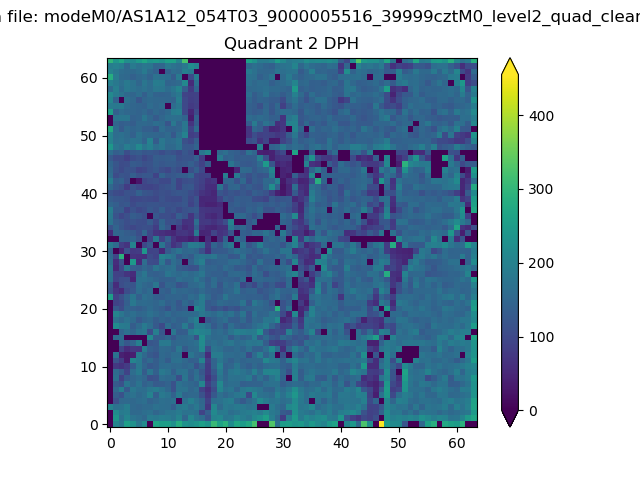 |
Quadrant C |
| Plot type | Count rate plots | Images |
|---|---|---|
| Comparison with Poisson distribution Blue bars denote a histogram of data divided into 1 sec bins. Red curve is a Poisson curve with rate = median count rate of data. |
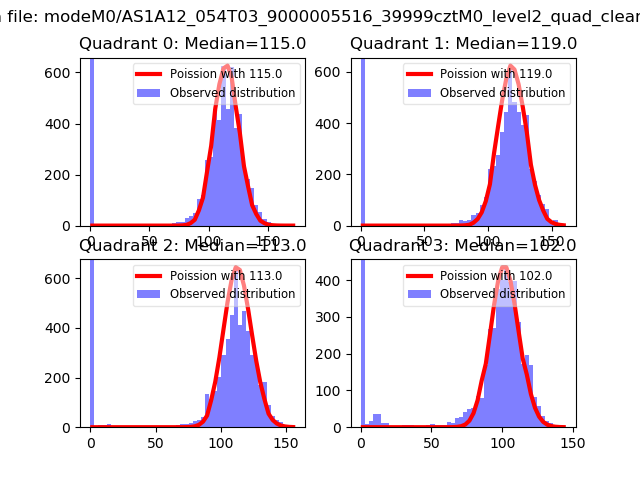 |
 |
| Quadrant-wise count rates Data is divided into 100 sec bins |
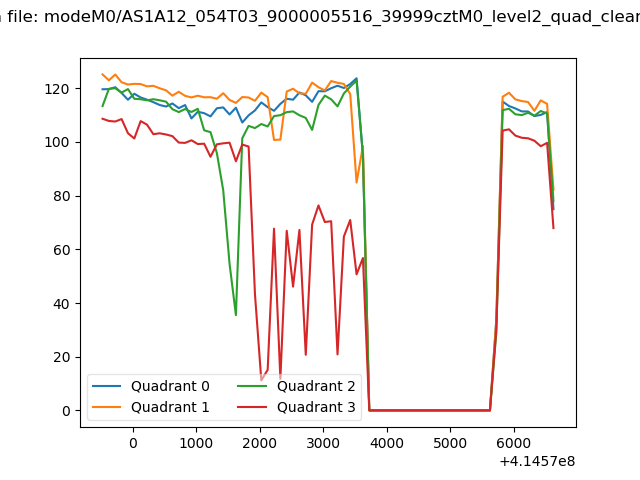 |
|
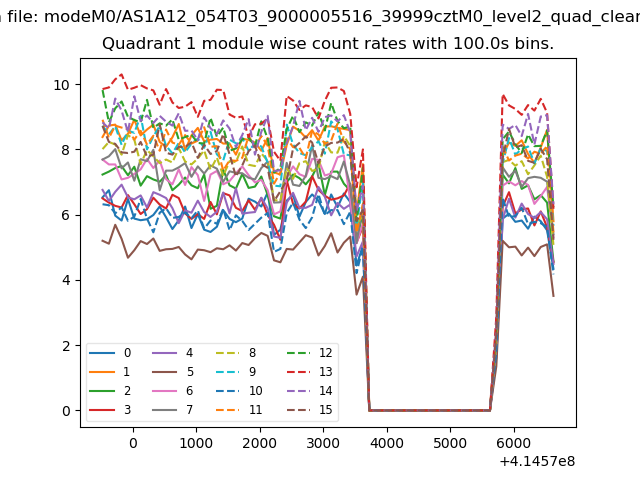
| Module-wise count rates for Quadrant A Data is divided into 100 sec bins |
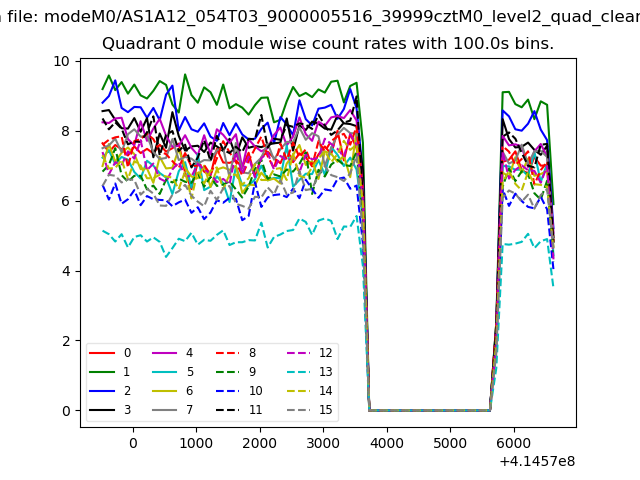 |
 |
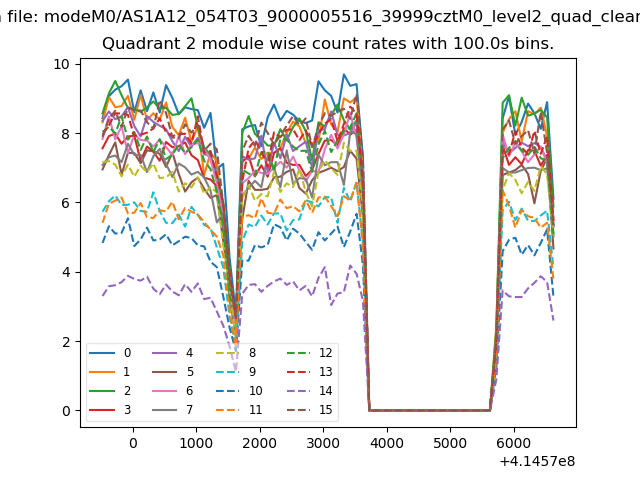
| Module-wise count rates for Quadrant B Data is divided into 100 sec bins |
 |
 |
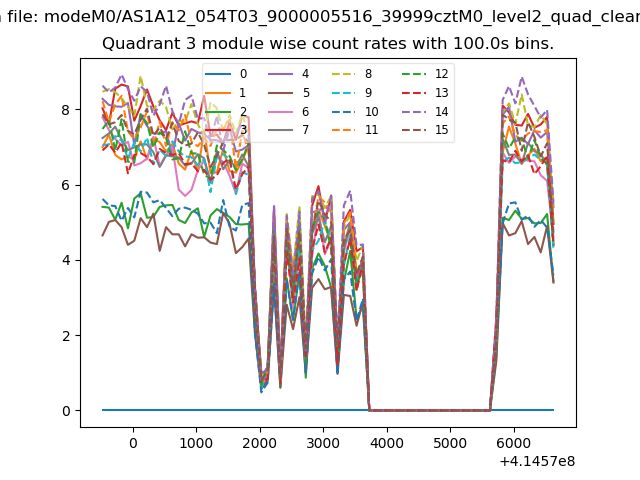
| Module-wise count rates for Quadrant C Data is divided into 100 sec bins |
 |
 |
| Module-wise count rates for Quadrant D Data is divided into 100 sec bins |
 |
 |
| Parameter | Plot |
|---|---|
| CZT HV Monitor | 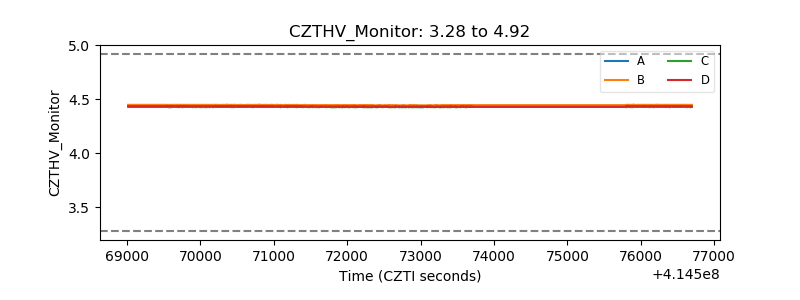 |
| D_VDD | 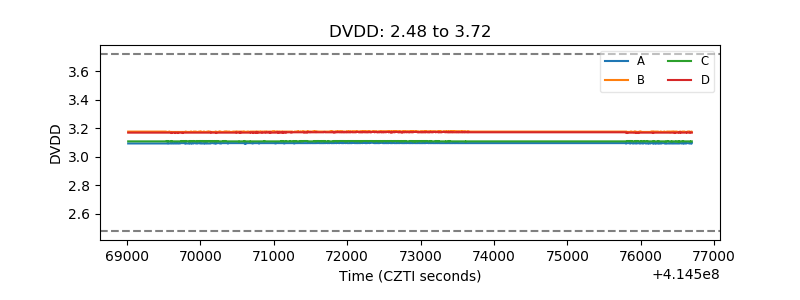 |
| Temperature 1 | 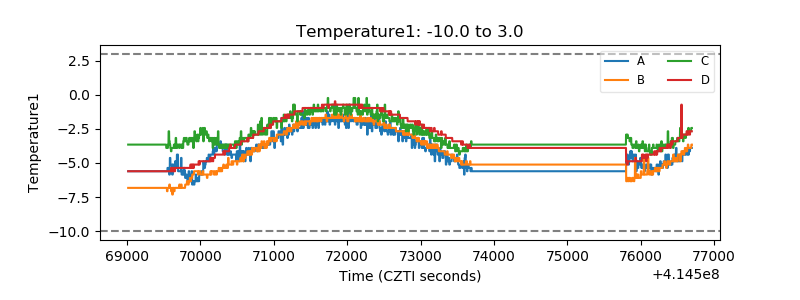 |
| Veto HV Monitor | 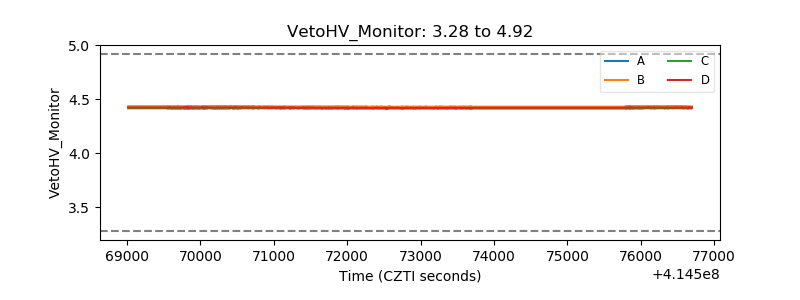 |
| Veto LLD | 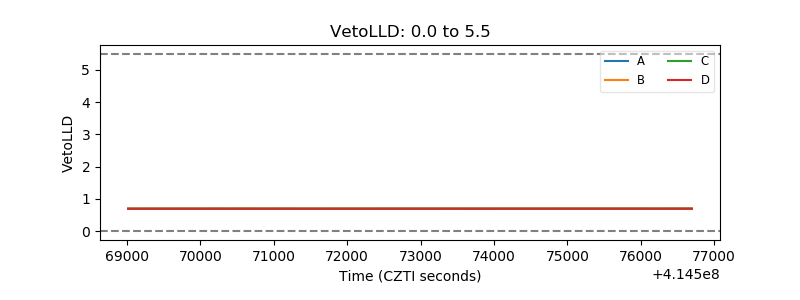 |
| Alpha Counter | 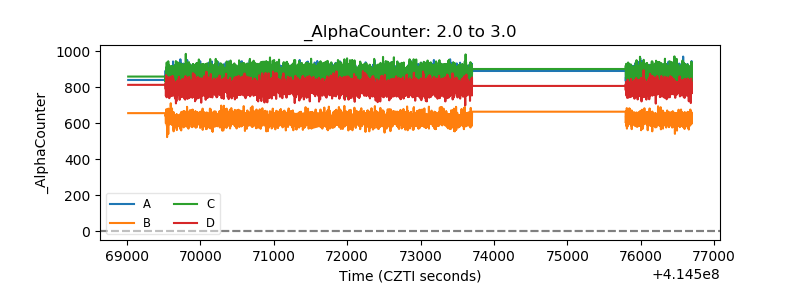 |
| _CPM_Rate | 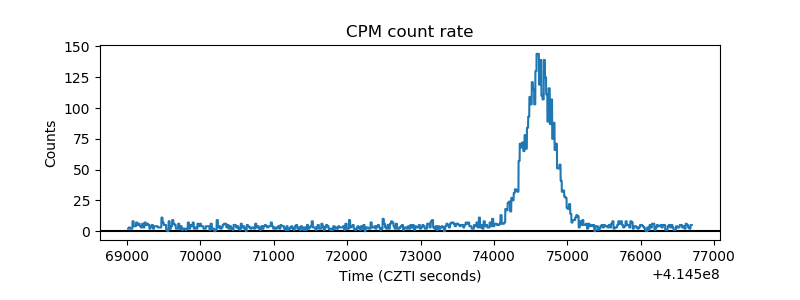 |
| CZT Counter | 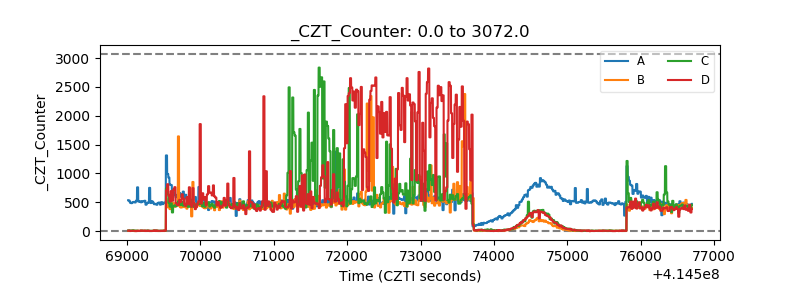 |
| +2.5 Volts monitor | 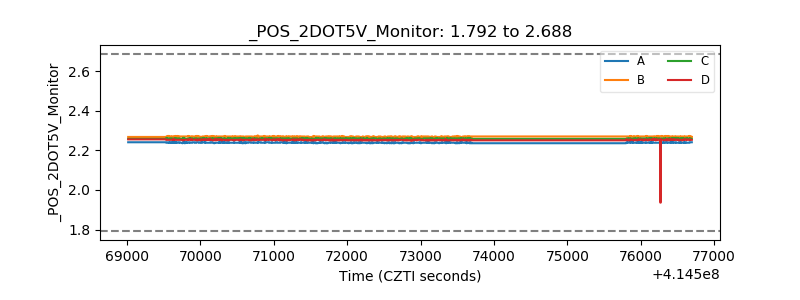 |
| +5 Volts monitor | 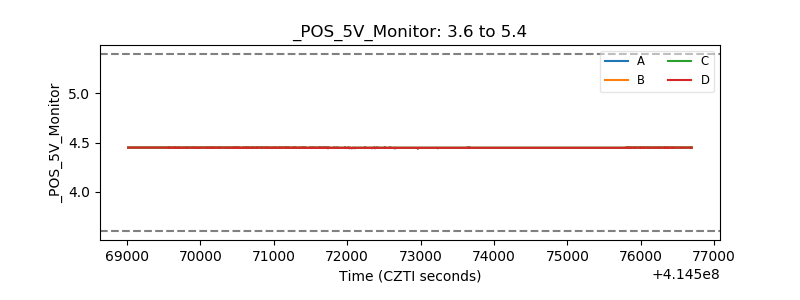 |
| _ROLL_ROT | 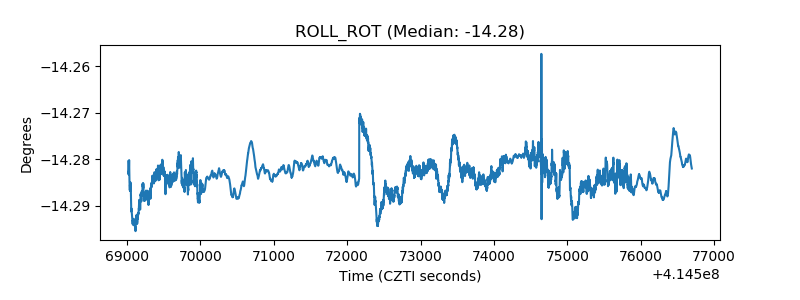 |
| _Roll_DEC | 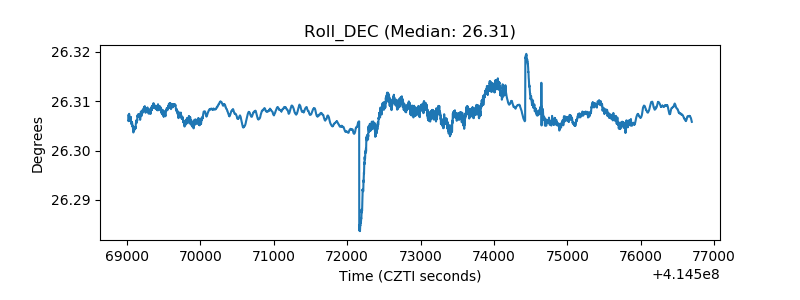 |
| _Roll_RA | 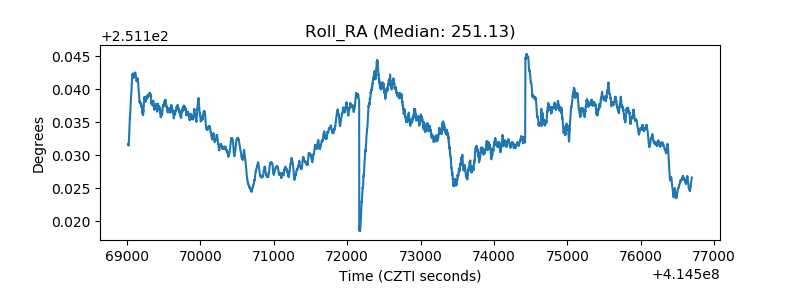 |
| Veto Counter | 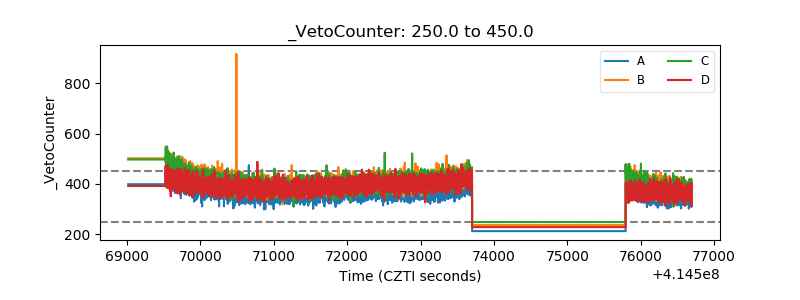 |