| Param | Original file | Final file |
|---|---|---|
| Filename | modeM0/AS1A12_054T03_9000005516_40000cztM0_level2.fits | modeM0/AS1A12_054T03_9000005516_40000cztM0_level2_quad_clean.evt |
| Size (bytes) | 360,495,360 | 84,853,440 |
| Size | 343.8 MB | 80.9 MB |
| Events in quadrant A | 2,915,927 | 580,396 |
| Events in quadrant B | 2,879,800 | 590,097 |
| Events in quadrant C | 2,606,803 | 573,103 |
| Events in quadrant D | 4,532,756 | 458,415 |
| Mode M9 | |||
|---|---|---|---|
| Quadrant | BADHDUFLAG | Total packets | Discarded packets |
| A | 0 | 27 | 0 |
| B | 0 | 27 | 0 |
| C | 0 | 27 | 0 |
| D | 0 | 28 | 0 |
| Mode SS | |||
|---|---|---|---|
| Quadrant | BADHDUFLAG | Total packets | Discarded packets |
| A | 0 | 106 | 0 |
| B | 0 | 106 | 0 |
| C | 0 | 106 | 0 |
| D | 0 | 106 | 0 |
| Mode M0 | |||
|---|---|---|---|
| Quadrant | BADHDUFLAG | Total packets | Discarded packets |
| A | 0 | 11690 | 3 |
| B | 0 | 12103 | 2 |
| C | 0 | 11017 | 2 |
| D | 0 | 17227 | 2 |
| Quadrant | Total seconds | Saturated seconds | Saturation percentage |
|---|---|---|---|
| A | 5249 | 41 | 0.781101% |
| B | 5249 | 145 | 2.762431% |
| C | 5249 | 12 | 0.228615% |
| D | 5249 | 782 | 14.898076% |
Noise dominated data is calculated using 1-second bins in cleaned event files. If a bin has >2000 counts, and if more than 50% of those come from <1% of pixels, then it is considered to be noise-dominated and hence unusable.
| Quadrant | # 1 sec bins | Bins with >0 counts | Bins with >2000 counts | High rate bins dominated by noise | Noise dominated (total time) | Noise dominated (detector-on time) | Marked lightcurve |
|---|---|---|---|---|---|---|---|
| A | 7072 | 5250 | 27 | 27 | 0.38% | 0.51% | 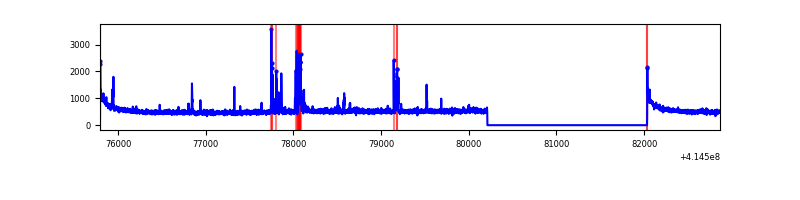 |
| B | 7072 | 5250 | 80 | 80 | 1.13% | 1.52% | 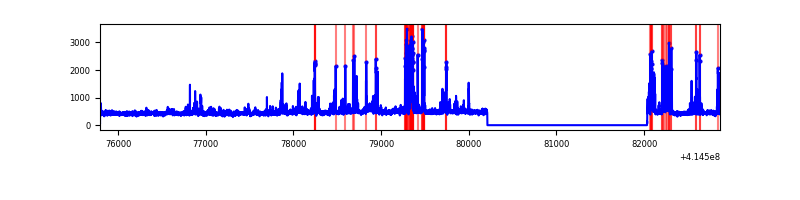 |
| C | 7072 | 5250 | 9 | 9 | 0.13% | 0.17% | 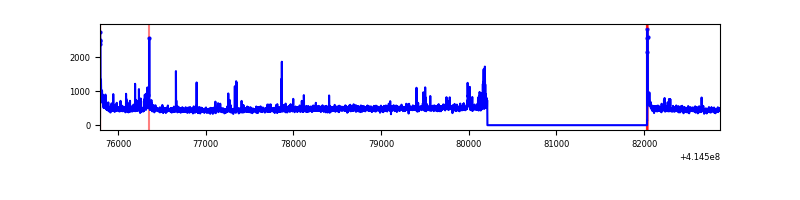 |
| D | 7072 | 5249 | 622 | 622 | 8.80% | 11.85% | 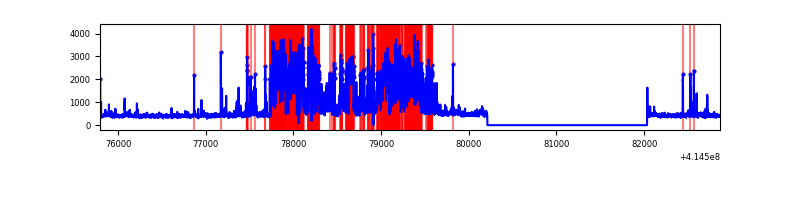 |
Top three noisy pixels from each quadrant. If the there are fewer than three noisy pixels in the level2.evt file, extra rows are filled as -1
| Pixel properties | Quadrant properties | ||||||
|---|---|---|---|---|---|---|---|
| Quadrant | DetID | PixID | Counts | Sigma | Mean | Median | Sigma |
| A | 10 | 83 | 467038 | 3949.32 | 581 | 571 | 118.1 |
| A | 13 | 248 | 159253 | 1343.47 | 581 | 571 | 118.1 |
| A | 15 | 223 | 21708 | 178.96 | 581 | 571 | 118.1 |
| B | 4 | 171 | 548272 | 4883.31 | 573 | 556 | 112.2 |
| B | 0 | 230 | 36849 | 323.58 | 573 | 556 | 112.2 |
| B | 0 | 221 | 23240 | 202.25 | 573 | 556 | 112.2 |
| C | 15 | 214 | 222166 | 1650.33 | 569 | 574 | 134.3 |
| C | 14 | 254 | 91593 | 677.87 | 569 | 574 | 134.3 |
| C | 0 | 10 | 43635 | 320.7 | 569 | 574 | 134.3 |
| D | 2 | 250 | 2020909 | 15441.29 | 529 | 514 | 130.8 |
| D | 12 | 227 | 210504 | 1604.89 | 529 | 514 | 130.8 |
| D | 12 | 233 | 107482 | 817.52 | 529 | 514 | 130.8 |
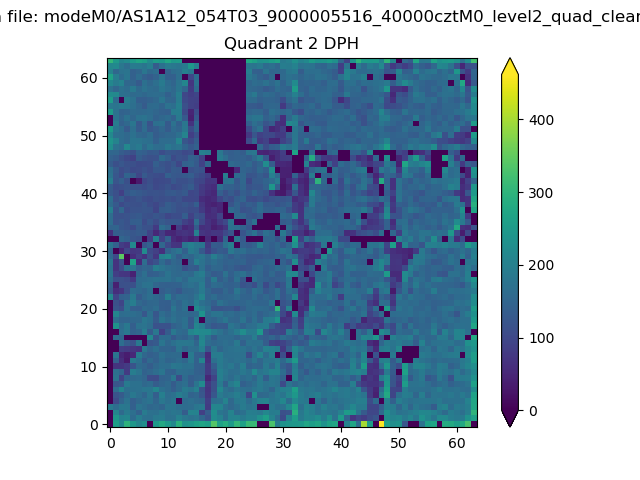
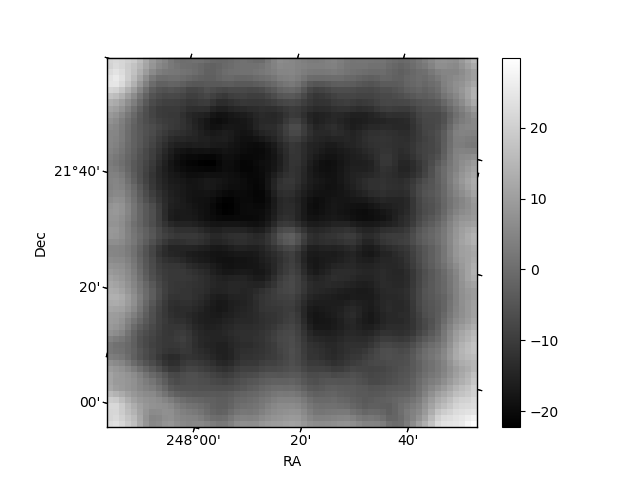
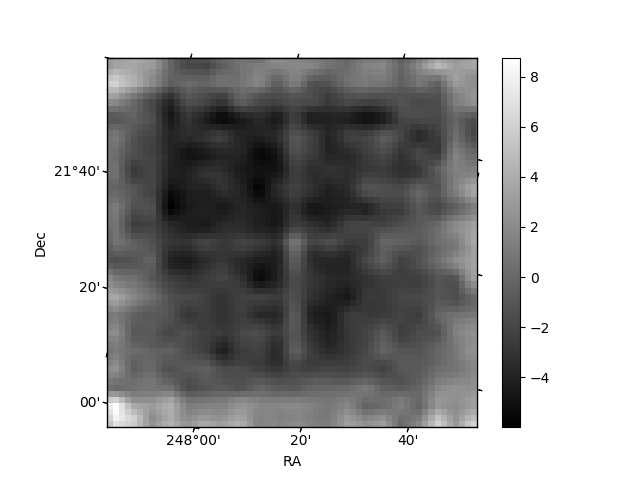
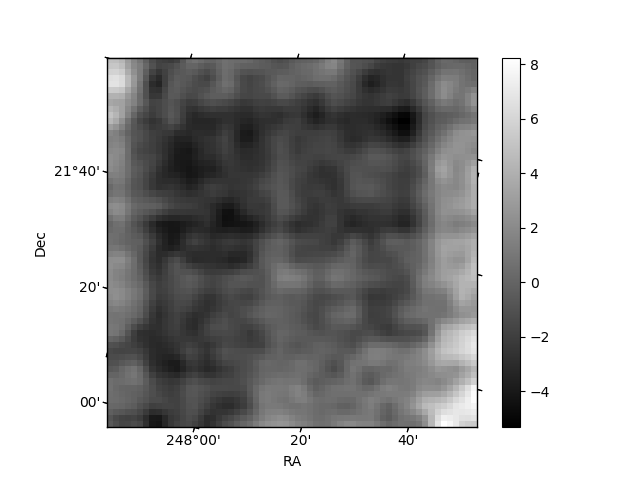
Histogram calculated using DETX and DETY for each event in the final _common_clean file
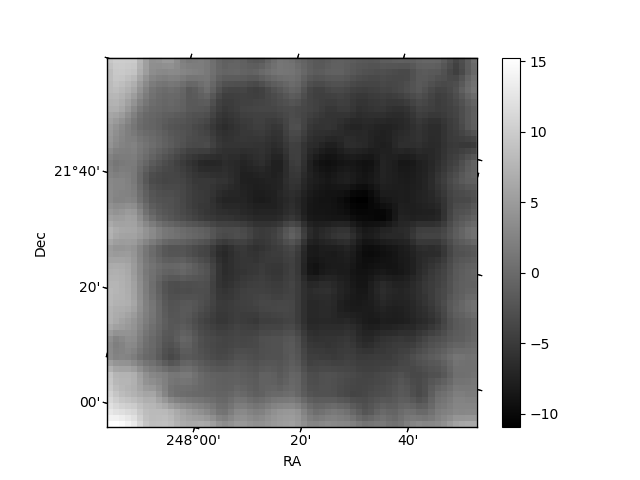
| Quadrant A | 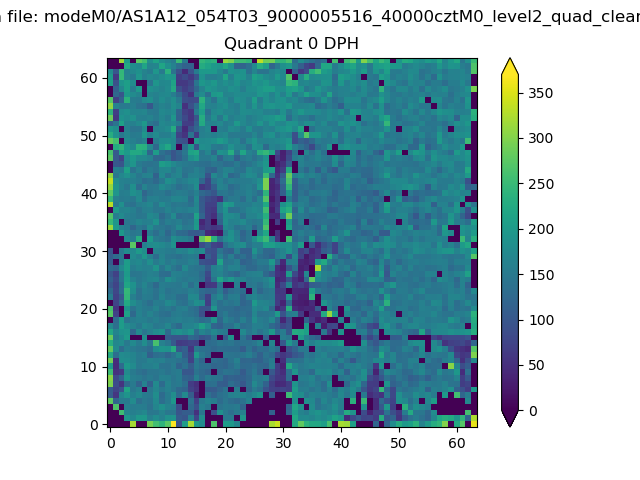 |
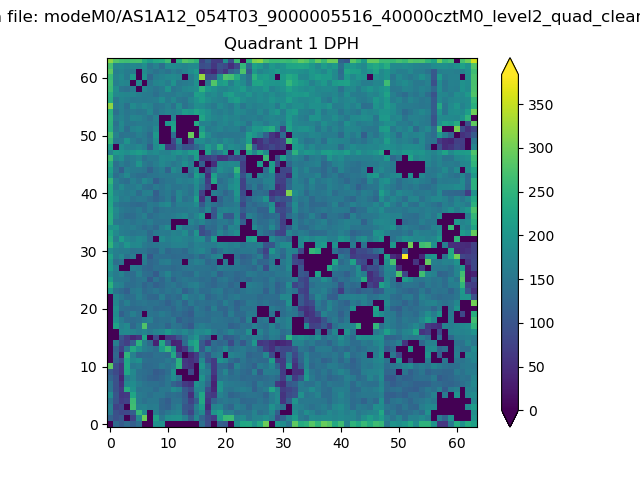 |
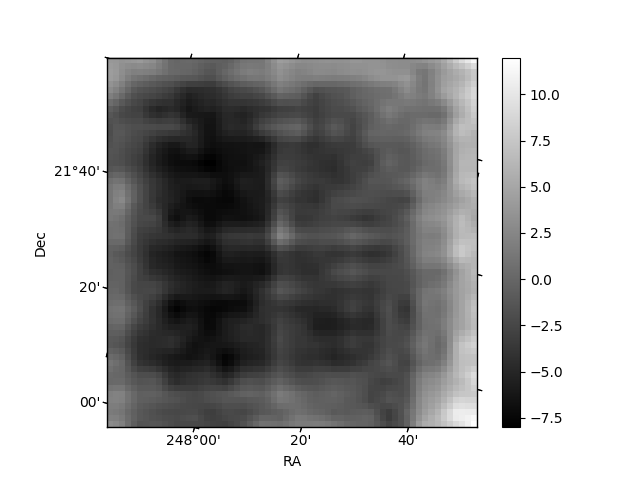
Quadrant B |
|---|---|---|---|
| Quadrant D | 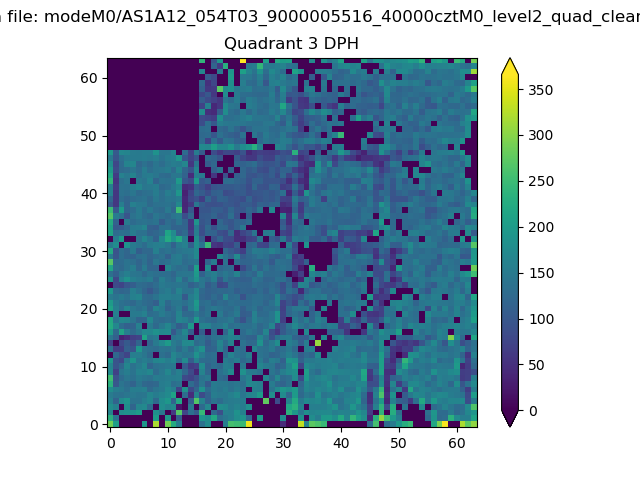 |
 |
Quadrant C |
| Plot type | Count rate plots | Images |
|---|---|---|
| Comparison with Poisson distribution Blue bars denote a histogram of data divided into 1 sec bins. Red curve is a Poisson curve with rate = median count rate of data. |
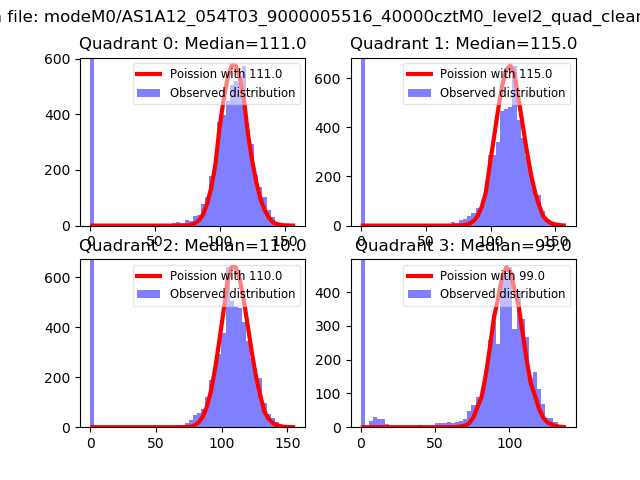 |
 |
| Quadrant-wise count rates Data is divided into 100 sec bins |
 |
|
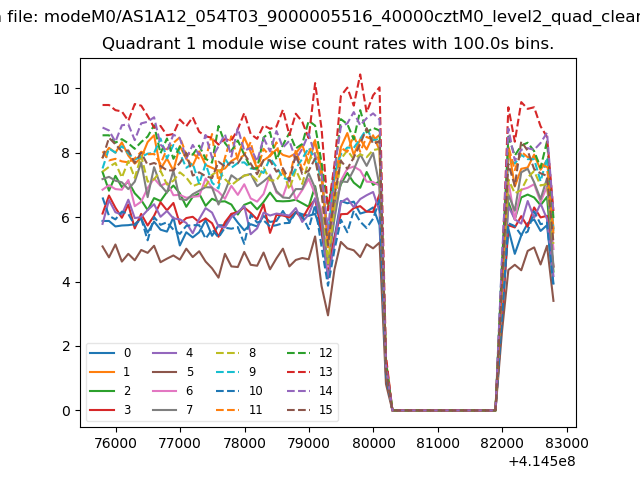
| Module-wise count rates for Quadrant A Data is divided into 100 sec bins |
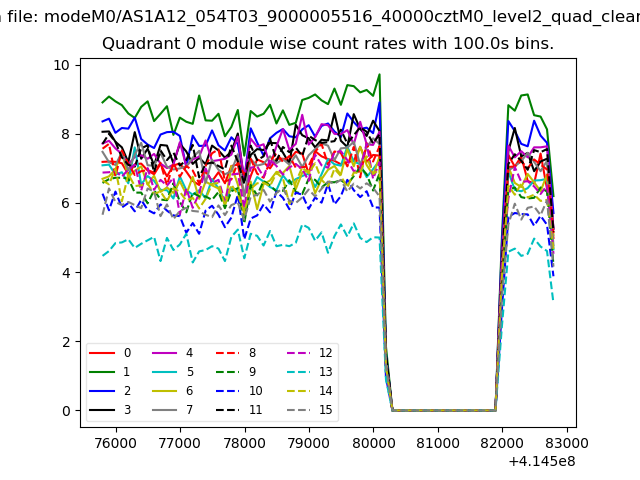 |
 |
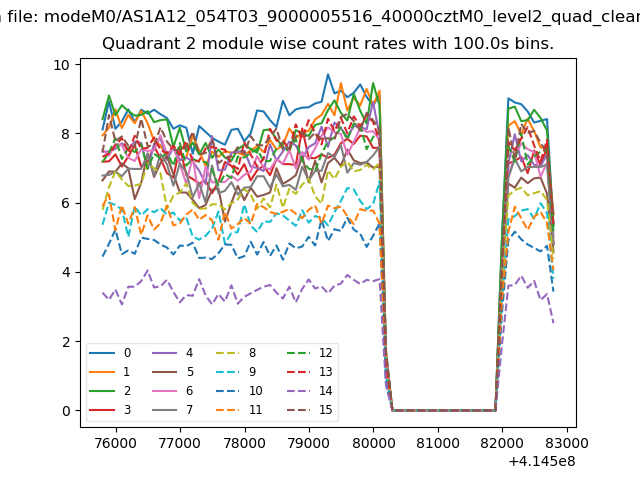
| Module-wise count rates for Quadrant B Data is divided into 100 sec bins |
 |
 |
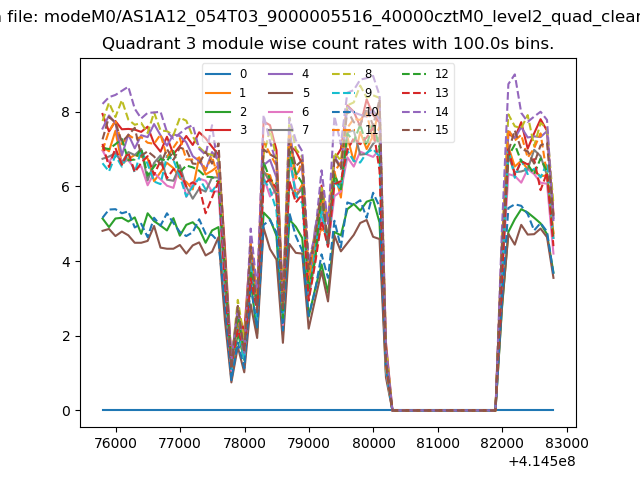
| Module-wise count rates for Quadrant C Data is divided into 100 sec bins |
 |
 |
| Module-wise count rates for Quadrant D Data is divided into 100 sec bins |
 |
 |
| Parameter | Plot |
|---|---|
| CZT HV Monitor | 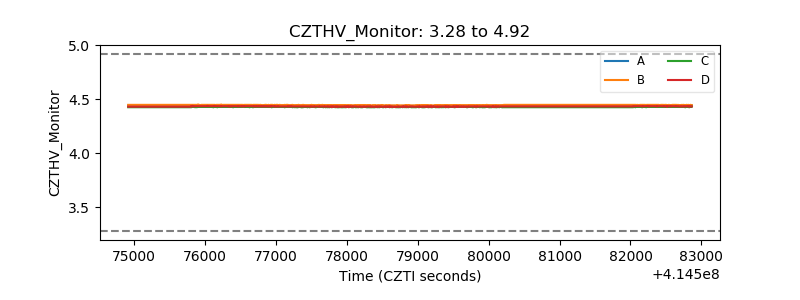 |
| D_VDD | 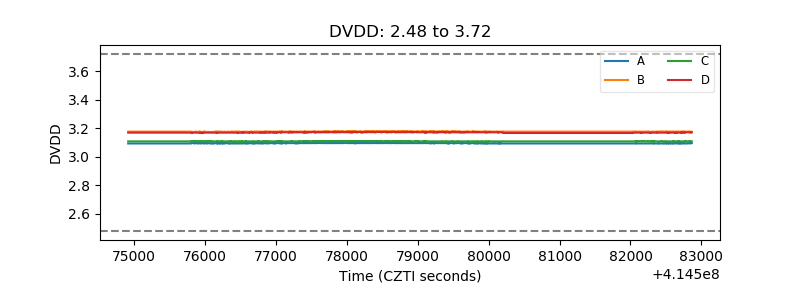 |
| Temperature 1 | 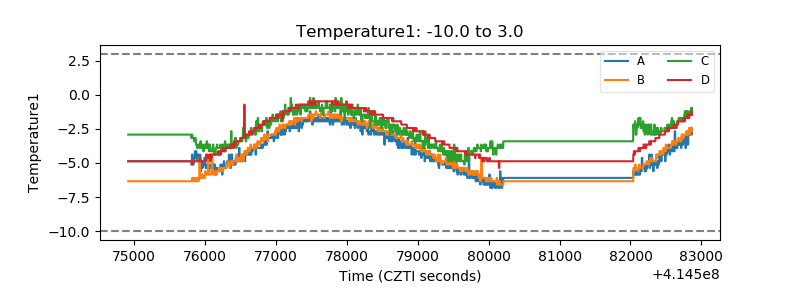 |
| Veto HV Monitor | 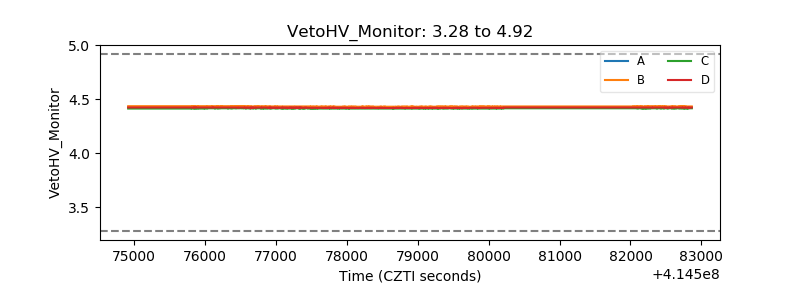 |
| Veto LLD | 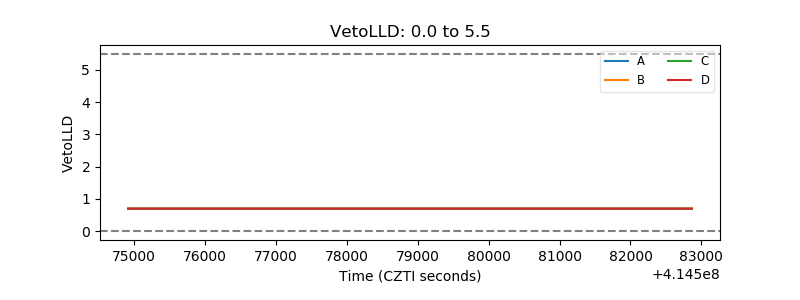 |
| Alpha Counter | 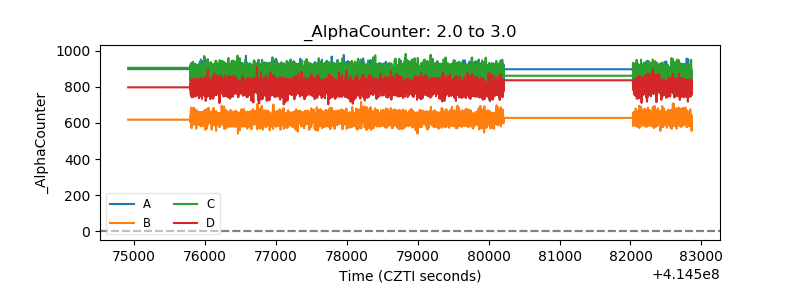 |
| _CPM_Rate | 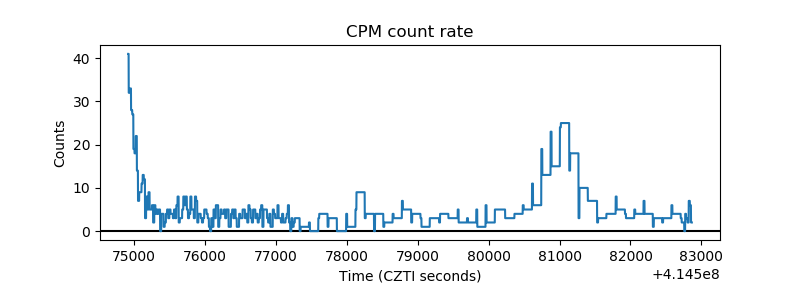 |
| CZT Counter | 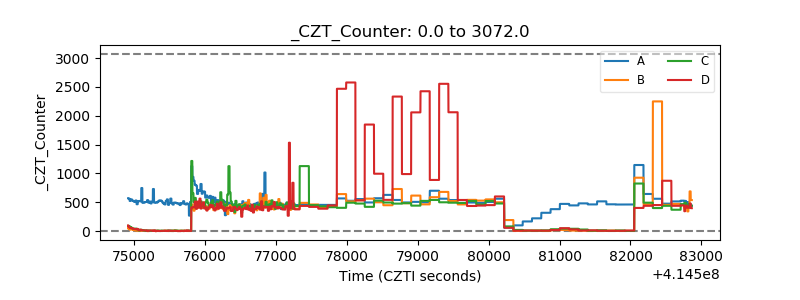 |
| +2.5 Volts monitor | 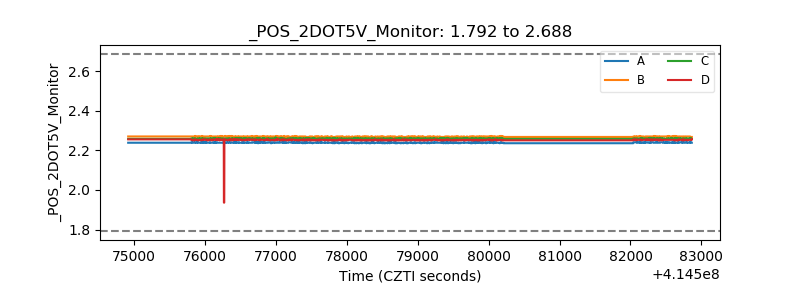 |
| +5 Volts monitor | 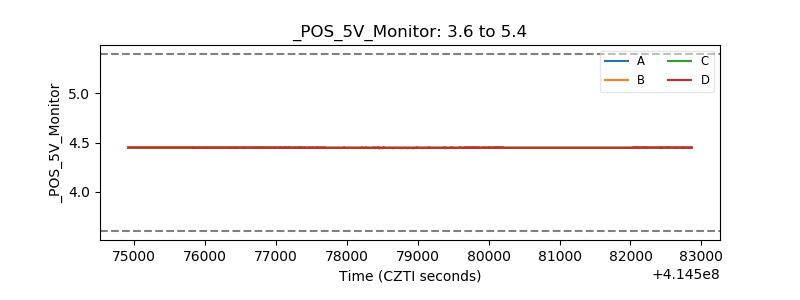 |
| _ROLL_ROT | 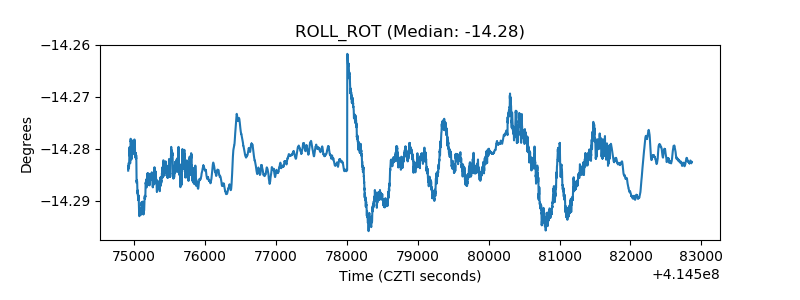 |
| _Roll_DEC | 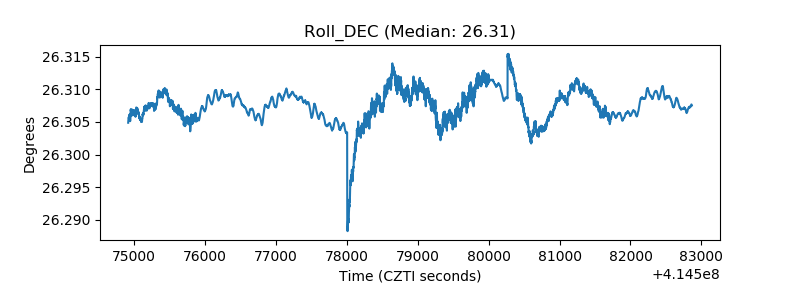 |
| _Roll_RA | 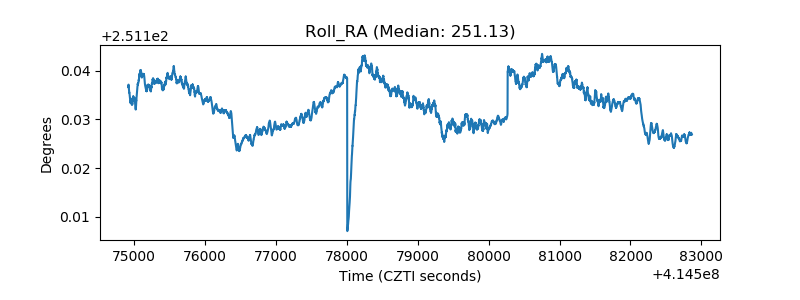 |
| Veto Counter | 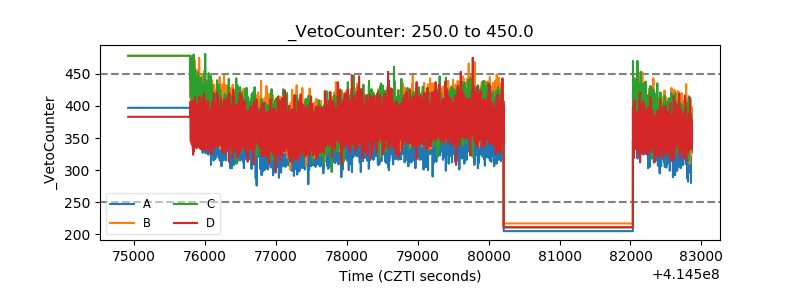 |