| Param | Original file | Final file |
|---|---|---|
| Filename | modeM0/AS1A12_054T03_9000005516_40001cztM0_level2.fits | modeM0/AS1A12_054T03_9000005516_40001cztM0_level2_quad_clean.evt |
| Size (bytes) | 357,624,000 | 89,602,560 |
| Size | 341.1 MB | 85.5 MB |
| Events in quadrant A | 2,927,325 | 603,187 |
| Events in quadrant B | 2,988,471 | 616,291 |
| Events in quadrant C | 2,635,703 | 595,080 |
| Events in quadrant D | 4,255,803 | 511,463 |
| Mode M9 | |||
|---|---|---|---|
| Quadrant | BADHDUFLAG | Total packets | Discarded packets |
| A | 0 | 23 | 0 |
| B | 0 | 23 | 0 |
| C | 0 | 23 | 0 |
| D | 0 | 24 | 0 |
| Mode SS | |||
|---|---|---|---|
| Quadrant | BADHDUFLAG | Total packets | Discarded packets |
| A | 0 | 112 | 0 |
| B | 0 | 112 | 0 |
| C | 0 | 112 | 0 |
| D | 0 | 112 | 0 |
| Mode M0 | |||
|---|---|---|---|
| Quadrant | BADHDUFLAG | Total packets | Discarded packets |
| A | 0 | 11914 | 3 |
| B | 0 | 12585 | 2 |
| C | 0 | 11282 | 2 |
| D | 0 | 16509 | 2 |
| Quadrant | Total seconds | Saturated seconds | Saturation percentage |
|---|---|---|---|
| A | 5532 | 24 | 0.433839% |
| B | 5532 | 92 | 1.663051% |
| C | 5532 | 9 | 0.162690% |
| D | 5532 | 472 | 8.532176% |
Noise dominated data is calculated using 1-second bins in cleaned event files. If a bin has >2000 counts, and if more than 50% of those come from <1% of pixels, then it is considered to be noise-dominated and hence unusable.
| Quadrant | # 1 sec bins | Bins with >0 counts | Bins with >2000 counts | High rate bins dominated by noise | Noise dominated (total time) | Noise dominated (detector-on time) | Marked lightcurve |
|---|---|---|---|---|---|---|---|
| A | 7025 | 5533 | 17 | 17 | 0.24% | 0.31% | 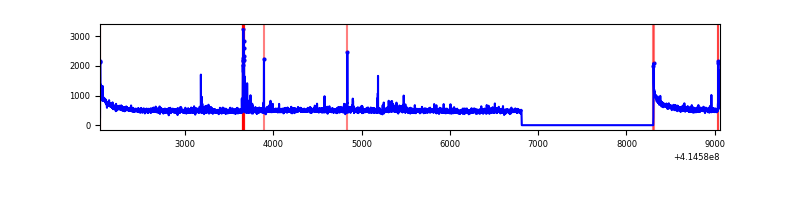 |
| B | 7025 | 5533 | 51 | 51 | 0.73% | 0.92% | 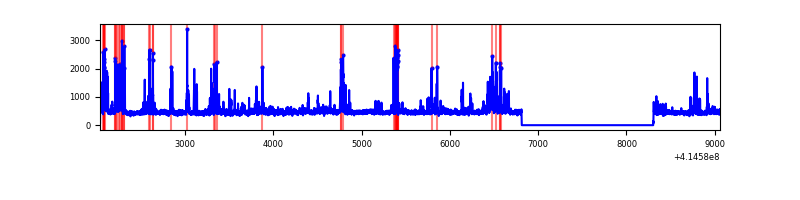 |
| C | 7025 | 5533 | 7 | 7 | 0.10% | 0.13% | 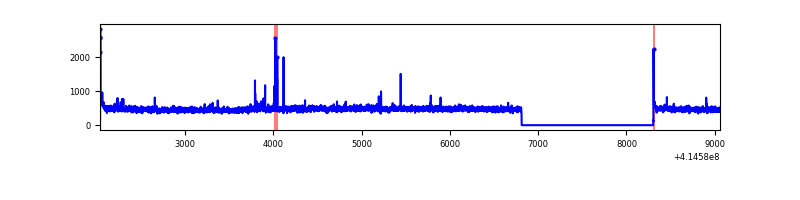 |
| D | 7025 | 5533 | 407 | 407 | 5.79% | 7.36% | 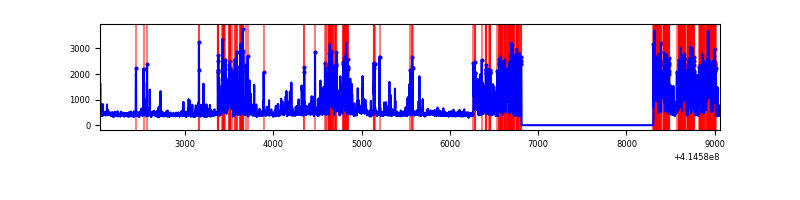 |
Top three noisy pixels from each quadrant. If the there are fewer than three noisy pixels in the level2.evt file, extra rows are filled as -1
| Pixel properties | Quadrant properties | ||||||
|---|---|---|---|---|---|---|---|
| Quadrant | DetID | PixID | Counts | Sigma | Mean | Median | Sigma |
| A | 10 | 83 | 477538 | 3823.33 | 608 | 595 | 124.7 |
| A | 13 | 248 | 63948 | 507.86 | 608 | 595 | 124.7 |
| A | 15 | 223 | 23800 | 186.02 | 608 | 595 | 124.7 |
| B | 4 | 171 | 516243 | 4377.51 | 604 | 587 | 117.8 |
| B | 0 | 230 | 53328 | 447.73 | 604 | 587 | 117.8 |
| B | 12 | 111 | 14634 | 119.25 | 604 | 587 | 117.8 |
| C | 15 | 214 | 233633 | 1670.42 | 595 | 599 | 139.5 |
| C | 0 | 10 | 25506 | 178.54 | 595 | 599 | 139.5 |
| C | 14 | 254 | 23893 | 166.97 | 595 | 599 | 139.5 |
| D | 13 | 171 | 1168106 | 8075.55 | 578 | 559 | 144.6 |
| D | 12 | 233 | 262227 | 1809.87 | 578 | 559 | 144.6 |
| D | 1 | 47 | 182520 | 1258.57 | 578 | 559 | 144.6 |
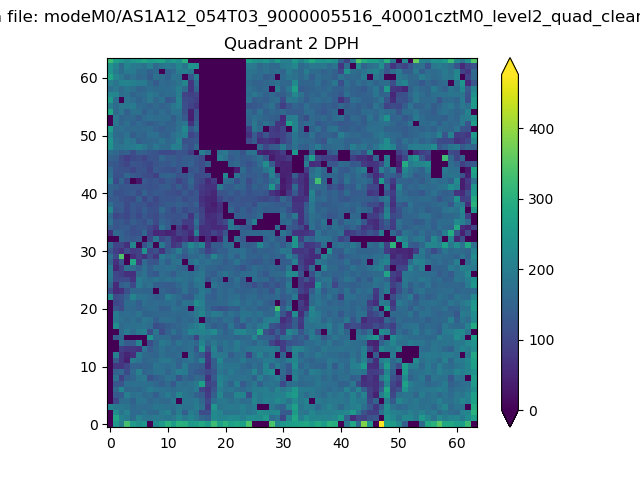
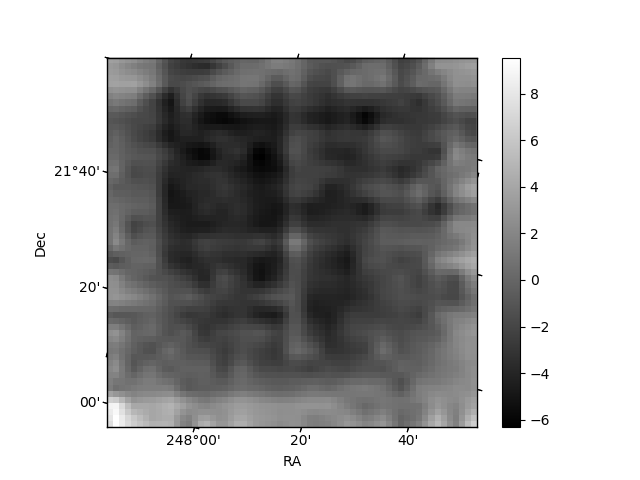
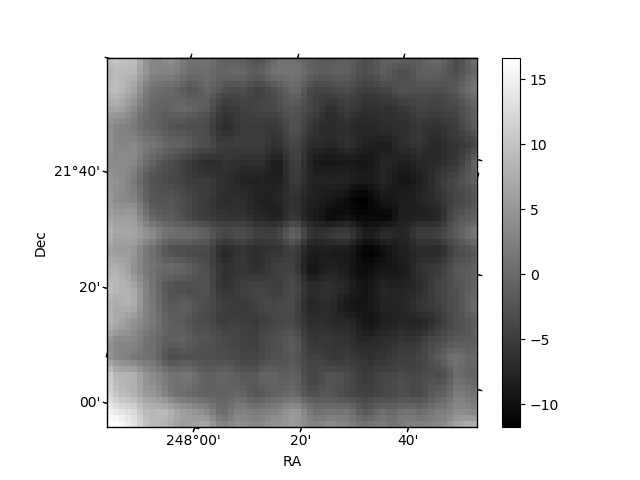
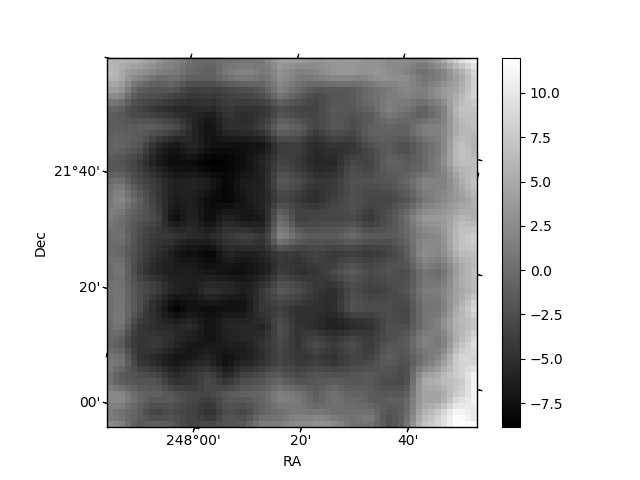
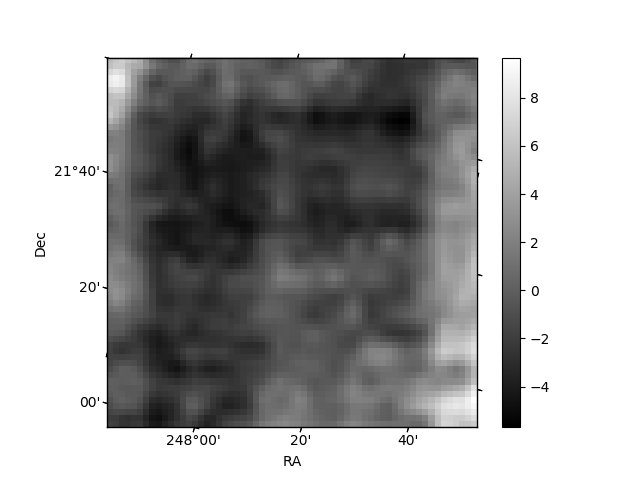
Histogram calculated using DETX and DETY for each event in the final _common_clean file
| Quadrant A | 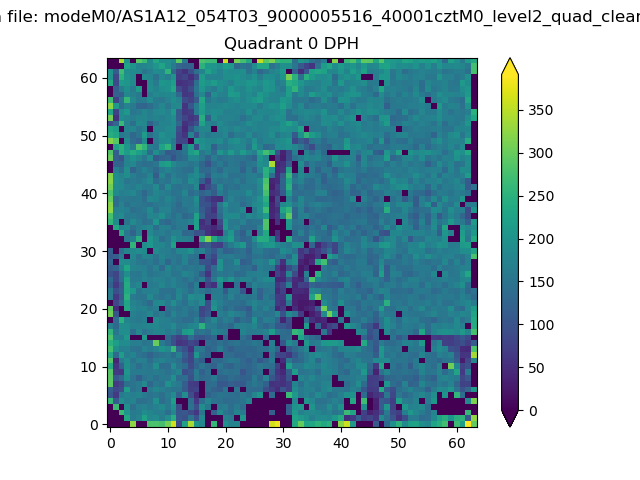 |
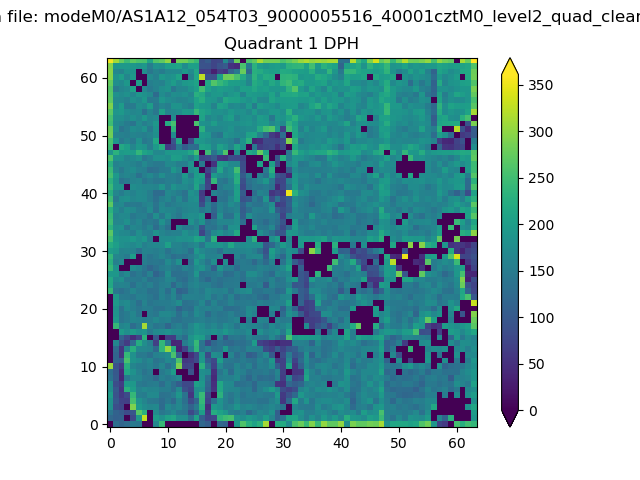 |
Quadrant B |
|---|---|---|---|
| Quadrant D | 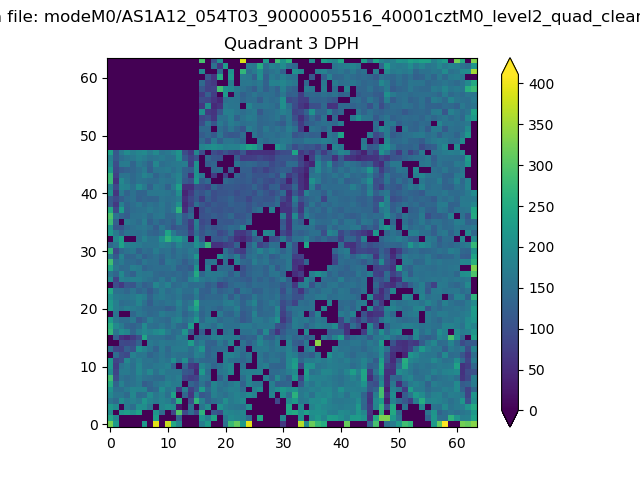 |
 |
Quadrant C |
| Plot type | Count rate plots | Images |
|---|---|---|
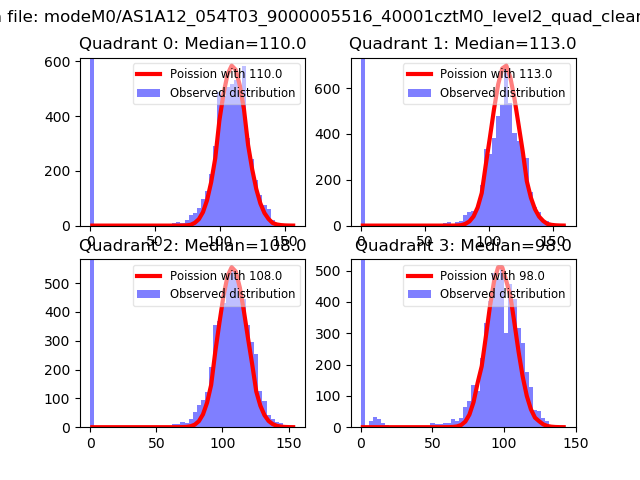
| Comparison with Poisson distribution Blue bars denote a histogram of data divided into 1 sec bins. Red curve is a Poisson curve with rate = median count rate of data. |
 |
 |
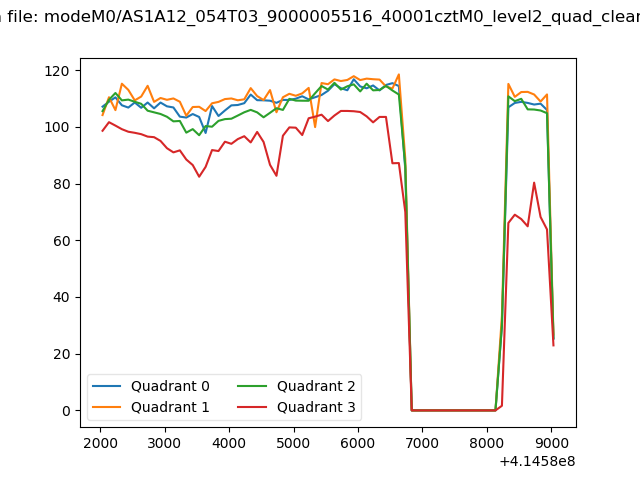
| Quadrant-wise count rates Data is divided into 100 sec bins |
 |
|
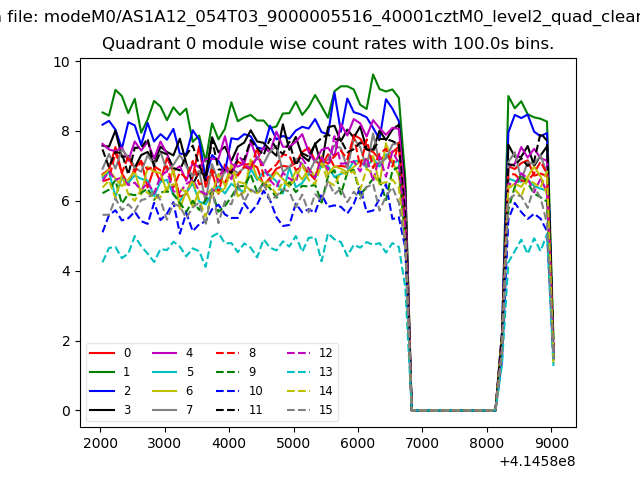
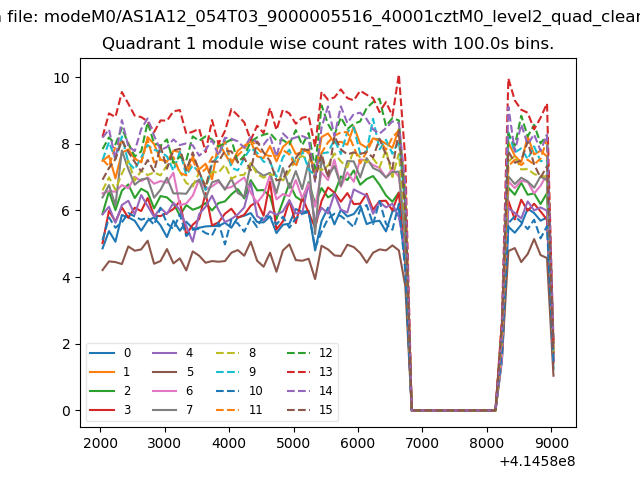
| Module-wise count rates for Quadrant A Data is divided into 100 sec bins |
 |
 |
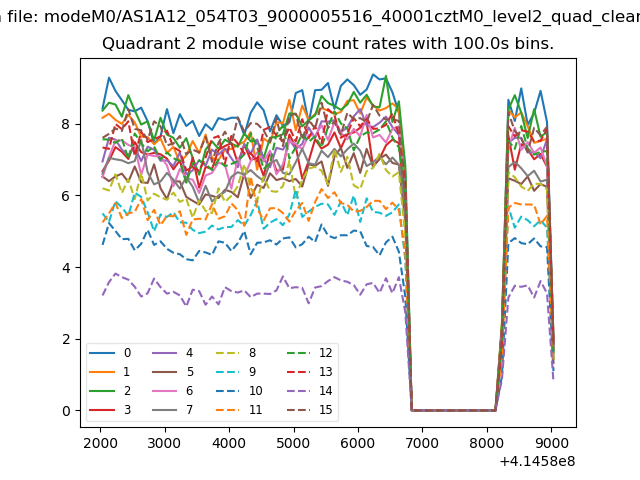
| Module-wise count rates for Quadrant B Data is divided into 100 sec bins |
 |
 |
| Module-wise count rates for Quadrant C Data is divided into 100 sec bins |
 |
 |
| Module-wise count rates for Quadrant D Data is divided into 100 sec bins |
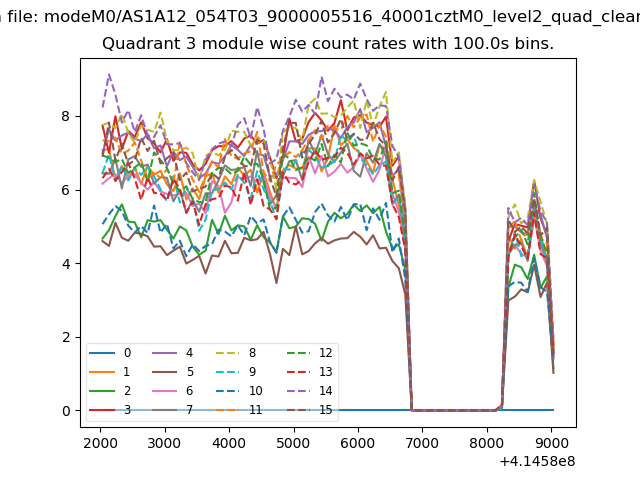 |
 |
| Parameter | Plot |
|---|---|
| CZT HV Monitor | 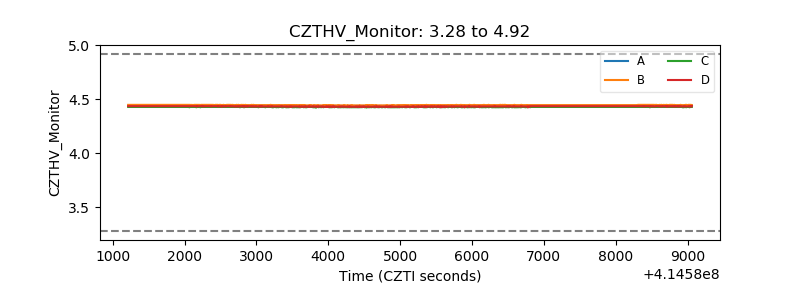 |
| D_VDD | 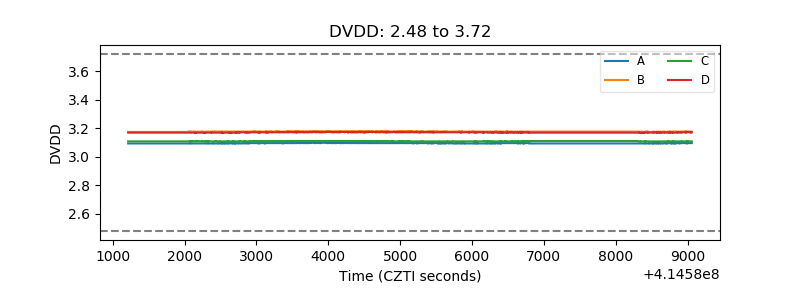 |
| Temperature 1 | 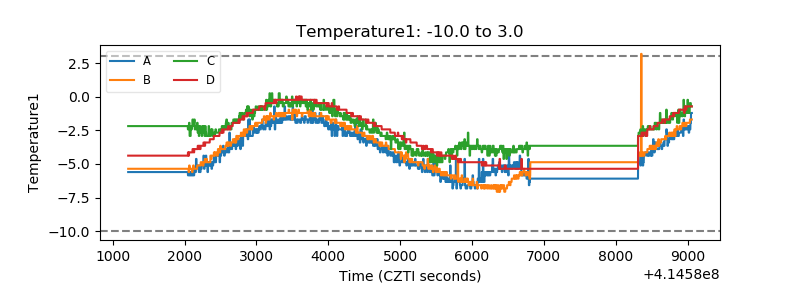 |
| Veto HV Monitor | 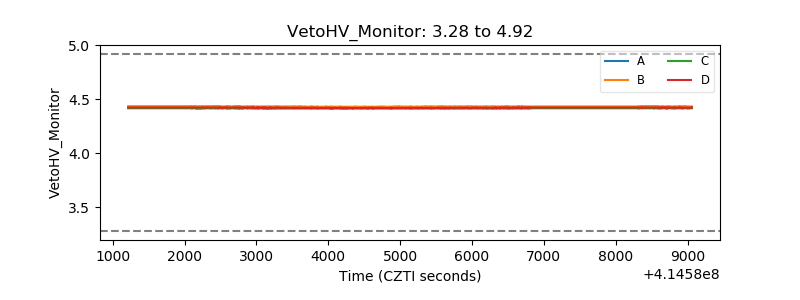 |
| Veto LLD | 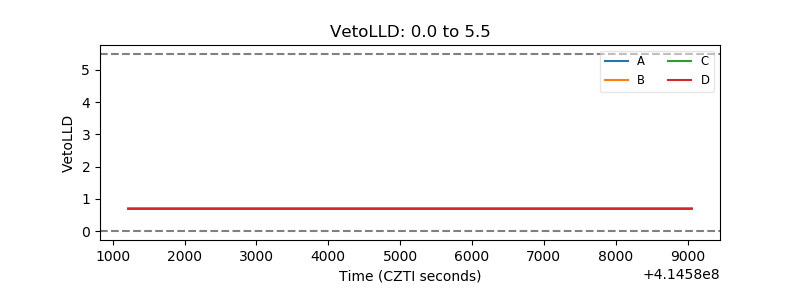 |
| Alpha Counter | 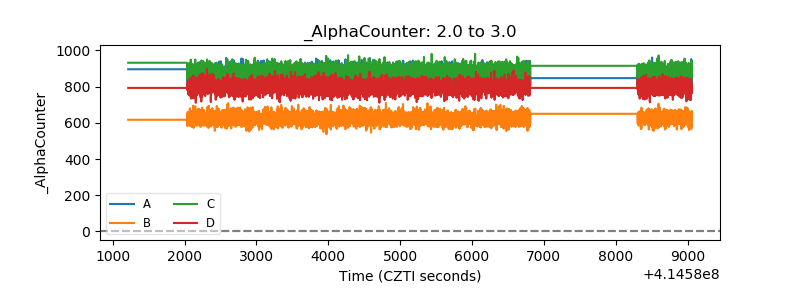 |
| _CPM_Rate | 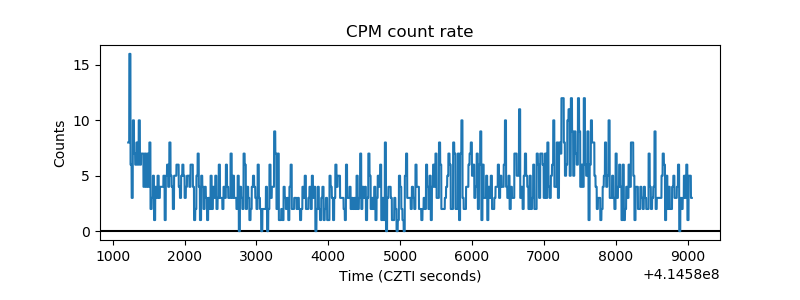 |
| CZT Counter | 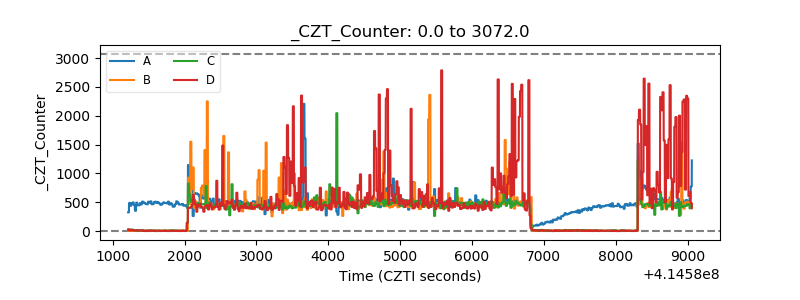 |
| +2.5 Volts monitor | 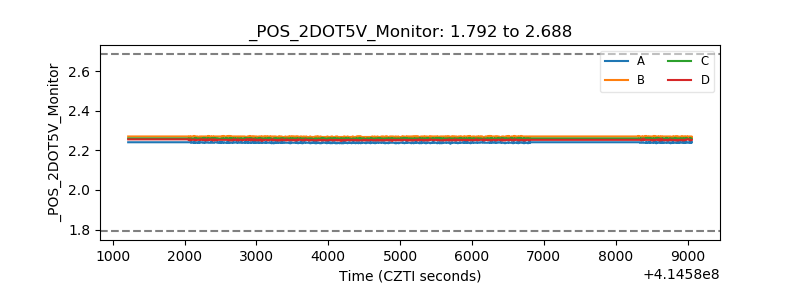 |
| +5 Volts monitor | 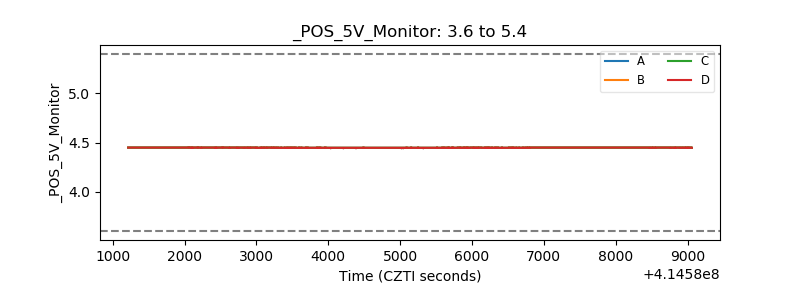 |
| _ROLL_ROT | 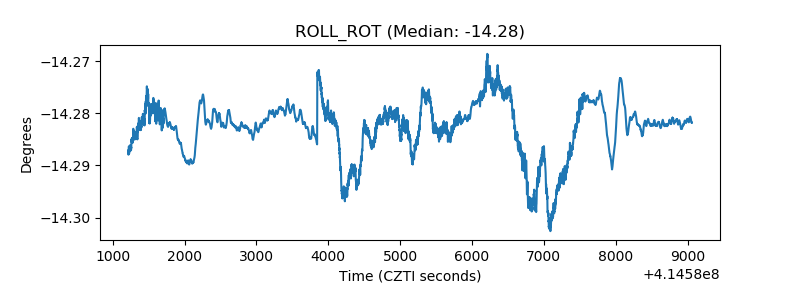 |
| _Roll_DEC | 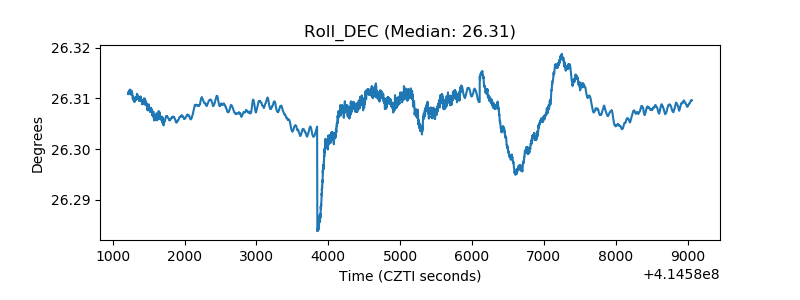 |
| _Roll_RA | 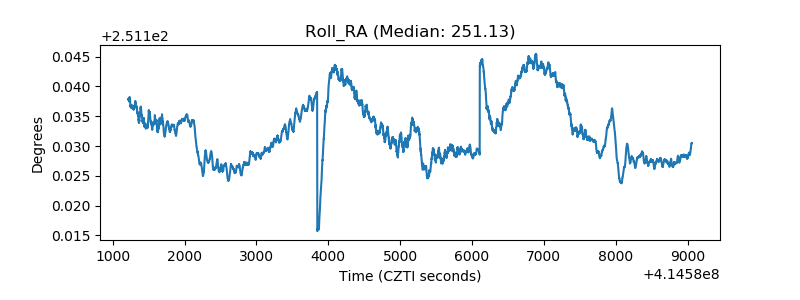 |
| Veto Counter | 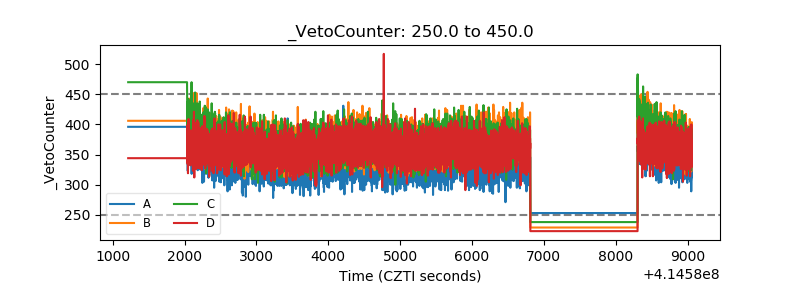 |