| Param | Original file | Final file |
|---|---|---|
| Filename | modeM0/AS1A12_054T03_9000005516_40002cztM0_level2.fits | modeM0/AS1A12_054T03_9000005516_40002cztM0_level2_quad_clean.evt |
| Size (bytes) | 414,138,240 | 93,018,240 |
| Size | 395.0 MB | 88.7 MB |
| Events in quadrant A | 3,397,882 | 632,874 |
| Events in quadrant B | 3,295,765 | 644,572 |
| Events in quadrant C | 2,840,029 | 627,345 |
| Events in quadrant D | 5,334,947 | 497,139 |
| Mode M9 | |||
|---|---|---|---|
| Quadrant | BADHDUFLAG | Total packets | Discarded packets |
| A | 0 | 20 | 0 |
| B | 0 | 20 | 0 |
| C | 0 | 20 | 0 |
| D | 0 | 21 | 0 |
| Mode SS | |||
|---|---|---|---|
| Quadrant | BADHDUFLAG | Total packets | Discarded packets |
| A | 0 | 122 | 0 |
| B | 0 | 122 | 0 |
| C | 0 | 122 | 0 |
| D | 0 | 122 | 0 |
| Mode M0 | |||
|---|---|---|---|
| Quadrant | BADHDUFLAG | Total packets | Discarded packets |
| A | 0 | 13633 | 3 |
| B | 0 | 13818 | 2 |
| C | 0 | 12142 | 2 |
| D | 0 | 20048 | 2 |
| Quadrant | Total seconds | Saturated seconds | Saturation percentage |
|---|---|---|---|
| A | 5927 | 111 | 1.872786% |
| B | 5927 | 160 | 2.699511% |
| C | 5927 | 10 | 0.168719% |
| D | 5927 | 956 | 16.129577% |
Noise dominated data is calculated using 1-second bins in cleaned event files. If a bin has >2000 counts, and if more than 50% of those come from <1% of pixels, then it is considered to be noise-dominated and hence unusable.
| Quadrant | # 1 sec bins | Bins with >0 counts | Bins with >2000 counts | High rate bins dominated by noise | Noise dominated (total time) | Noise dominated (detector-on time) | Marked lightcurve |
|---|---|---|---|---|---|---|---|
| A | 7240 | 5928 | 77 | 77 | 1.06% | 1.30% | 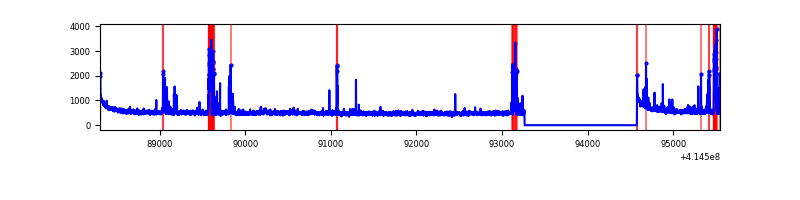 |
| B | 7240 | 5928 | 108 | 108 | 1.49% | 1.82% | 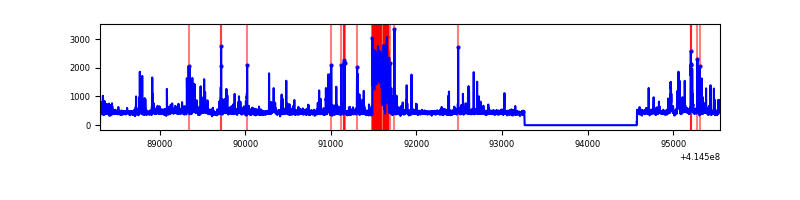 |
| C | 7240 | 5928 | 6 | 6 | 0.08% | 0.10% | 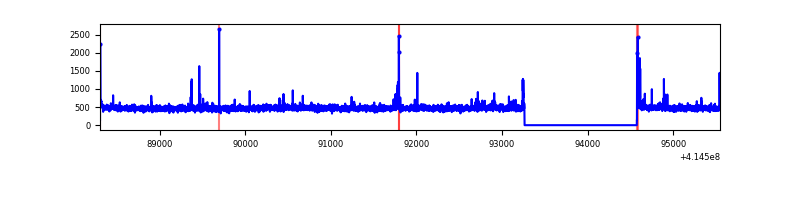 |
| D | 7240 | 5928 | 755 | 755 | 10.43% | 12.74% | 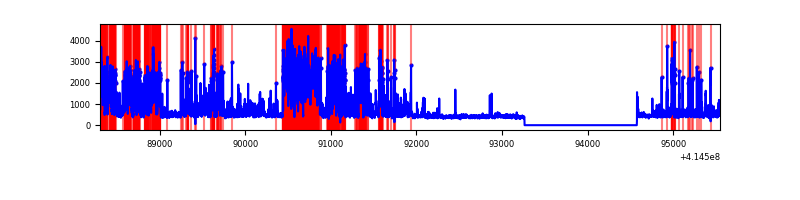 |
Top three noisy pixels from each quadrant. If the there are fewer than three noisy pixels in the level2.evt file, extra rows are filled as -1
| Pixel properties | Quadrant properties | ||||||
|---|---|---|---|---|---|---|---|
| Quadrant | DetID | PixID | Counts | Sigma | Mean | Median | Sigma |
| A | 10 | 83 | 504055 | 3802.36 | 646 | 632 | 132.4 |
| A | 13 | 248 | 323575 | 2439.19 | 646 | 632 | 132.4 |
| A | 15 | 223 | 43242 | 321.83 | 646 | 632 | 132.4 |
| B | 4 | 171 | 695037 | 5605.17 | 640 | 623 | 123.9 |
| B | 0 | 230 | 31747 | 251.23 | 640 | 623 | 123.9 |
| B | 0 | 221 | 17854 | 139.09 | 640 | 623 | 123.9 |
| C | 15 | 214 | 248846 | 1669.79 | 634 | 639 | 148.6 |
| C | 14 | 254 | 43428 | 287.86 | 634 | 639 | 148.6 |
| C | 15 | 208 | 34777 | 229.66 | 634 | 639 | 148.6 |
| D | 2 | 250 | 1538871 | 10531.81 | 586 | 567 | 146.1 |
| D | 13 | 171 | 769054 | 5261.35 | 586 | 567 | 146.1 |
| D | 13 | 249 | 301400 | 2059.61 | 586 | 567 | 146.1 |
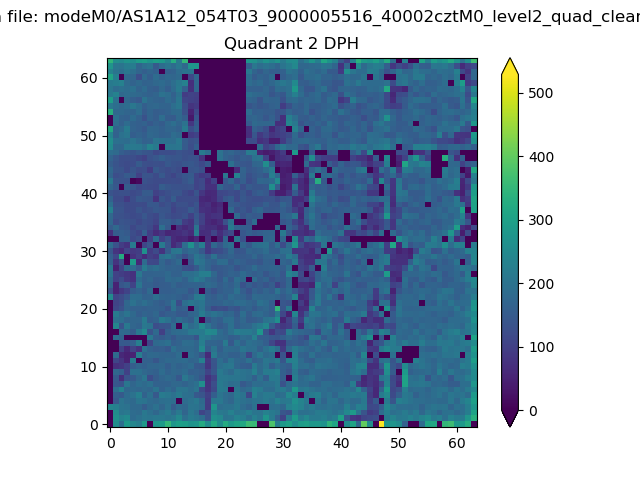
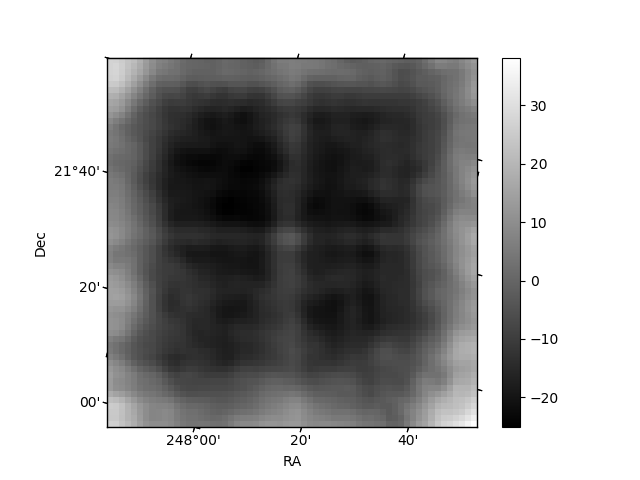
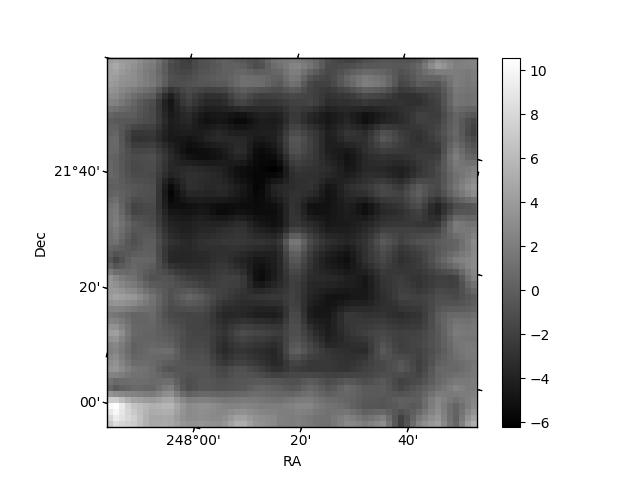
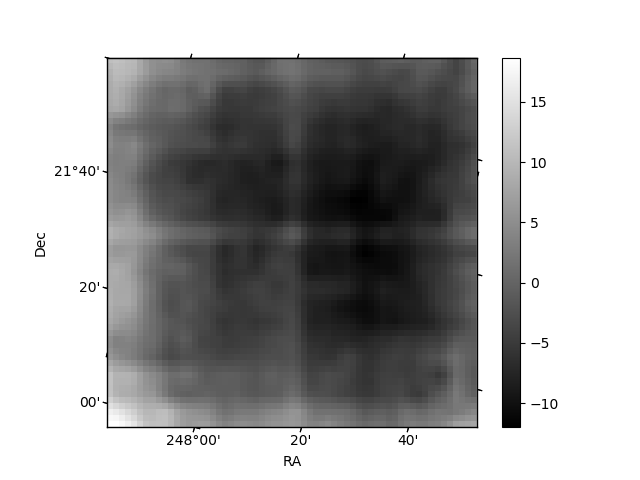
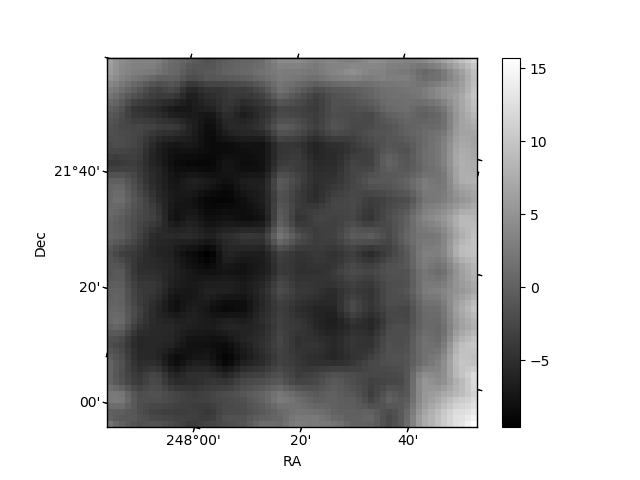
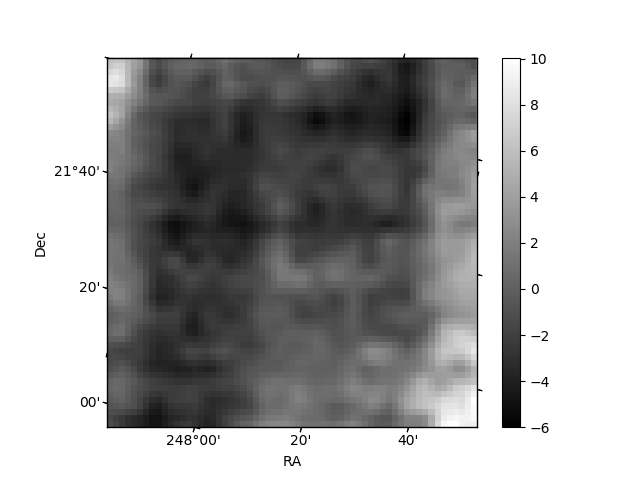
Histogram calculated using DETX and DETY for each event in the final _common_clean file
| Quadrant A | 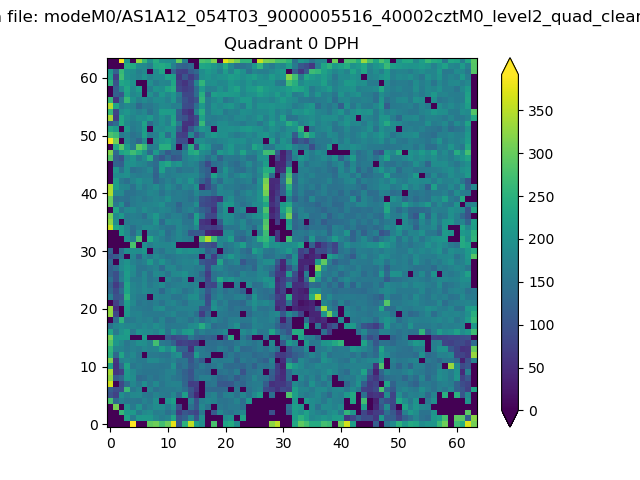 |
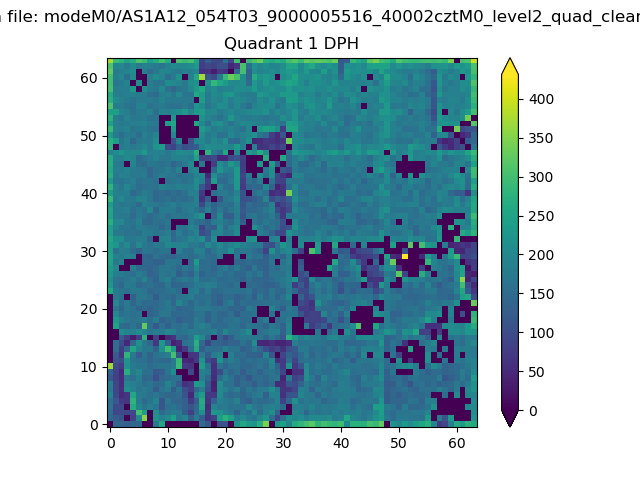 |
Quadrant B |
|---|---|---|---|
| Quadrant D | 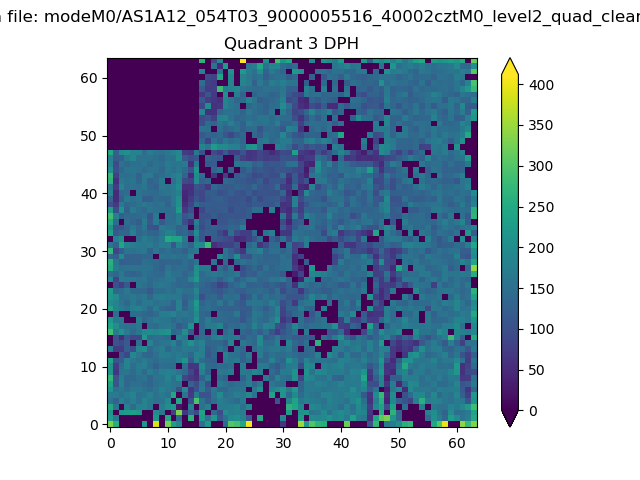 |
 |
Quadrant C |
| Plot type | Count rate plots | Images |
|---|---|---|
| Comparison with Poisson distribution Blue bars denote a histogram of data divided into 1 sec bins. Red curve is a Poisson curve with rate = median count rate of data. |
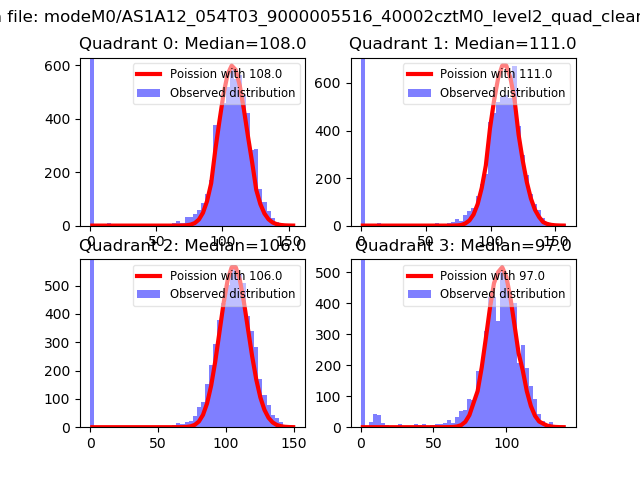 |
 |
| Quadrant-wise count rates Data is divided into 100 sec bins |
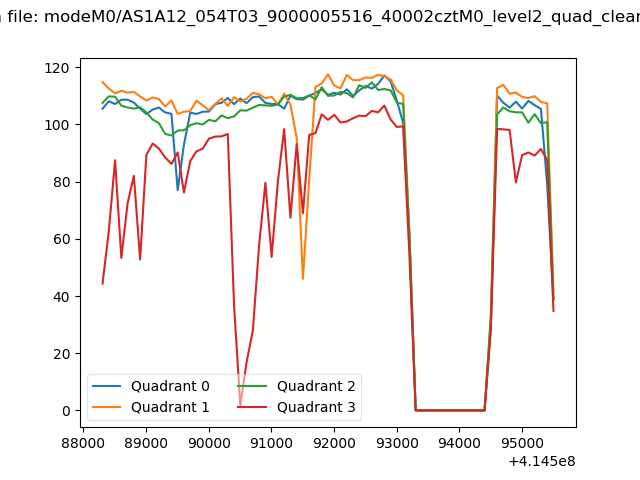 |
|
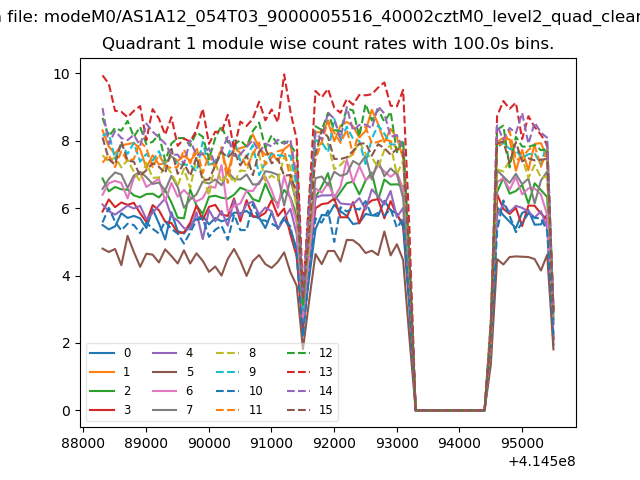
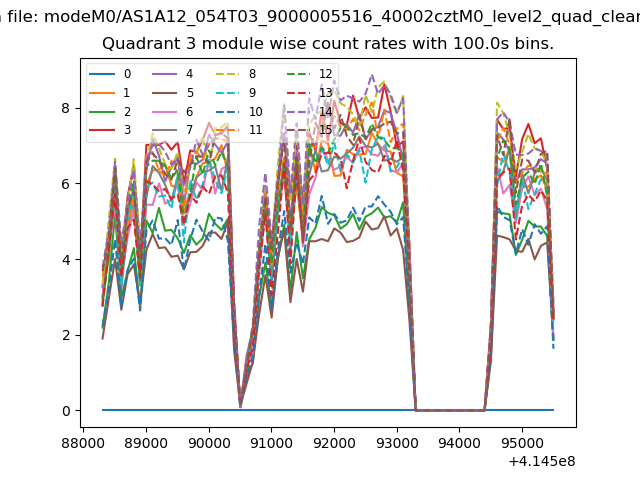
| Module-wise count rates for Quadrant A Data is divided into 100 sec bins |
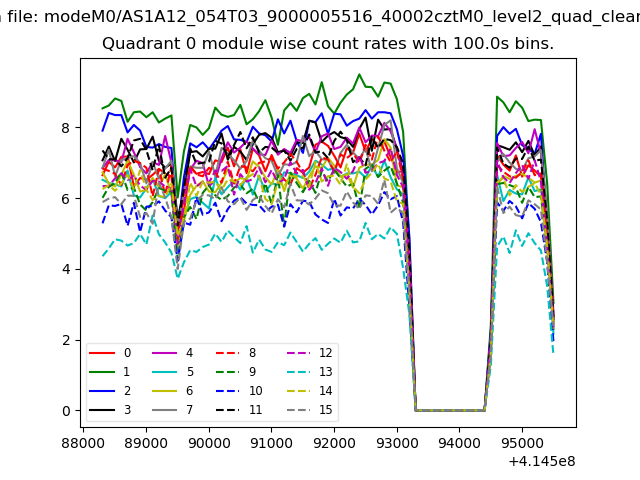 |
 |
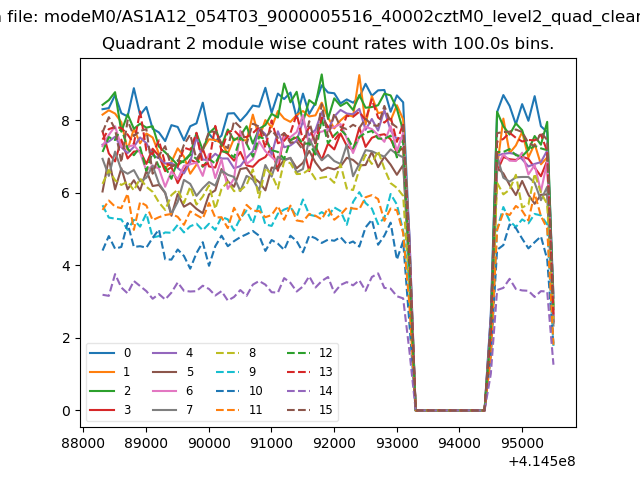
| Module-wise count rates for Quadrant B Data is divided into 100 sec bins |
 |
 |
| Module-wise count rates for Quadrant C Data is divided into 100 sec bins |
 |
 |
| Module-wise count rates for Quadrant D Data is divided into 100 sec bins |
 |
 |
| Parameter | Plot |
|---|---|
| CZT HV Monitor | 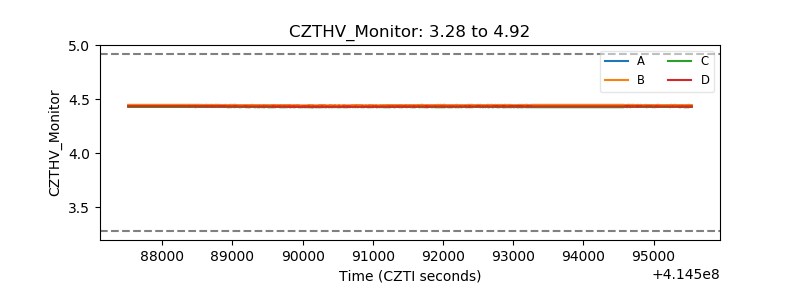 |
| D_VDD | 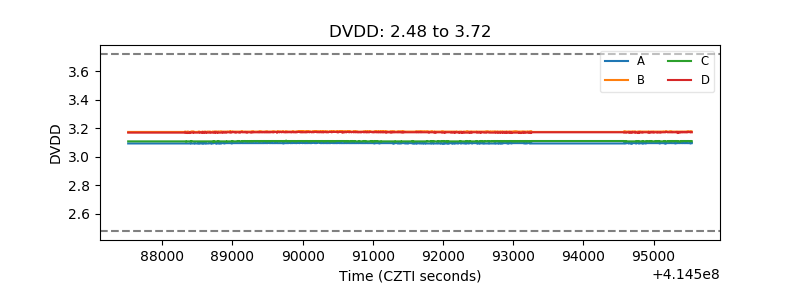 |
| Temperature 1 | 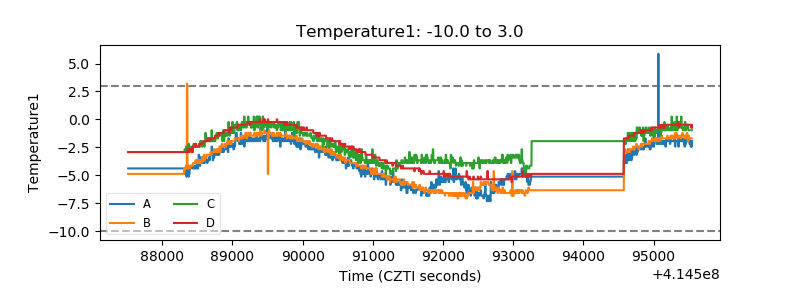 |
| Veto HV Monitor | 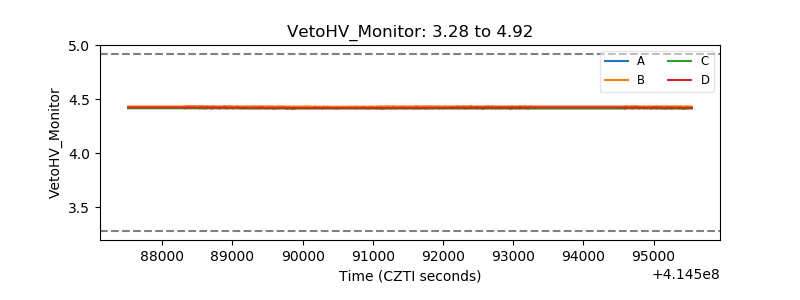 |
| Veto LLD | 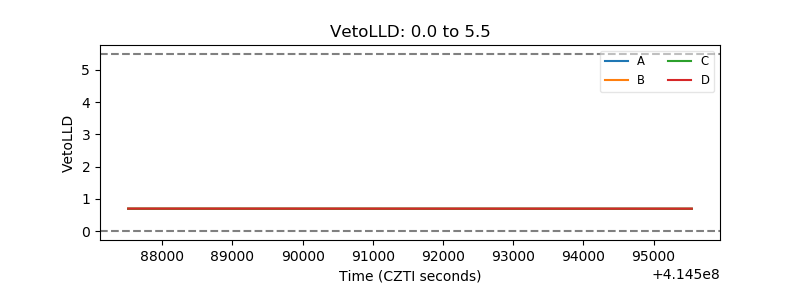 |
| Alpha Counter | 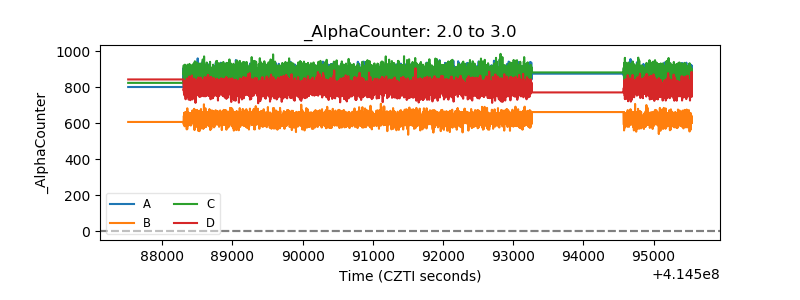 |
| _CPM_Rate | 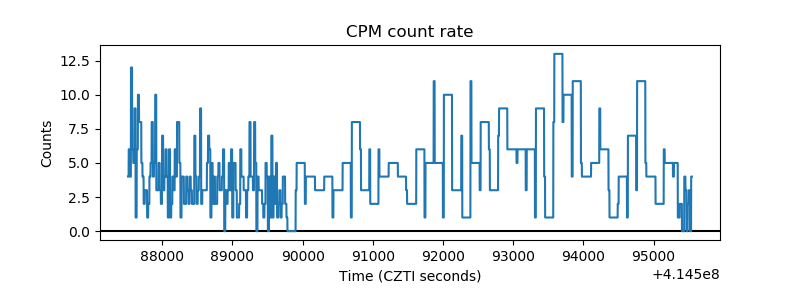 |
| CZT Counter | 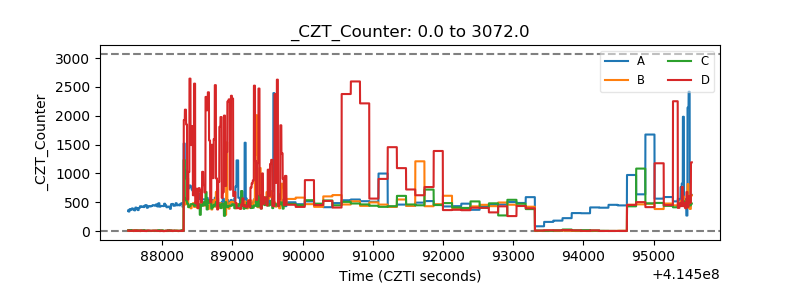 |
| +2.5 Volts monitor | 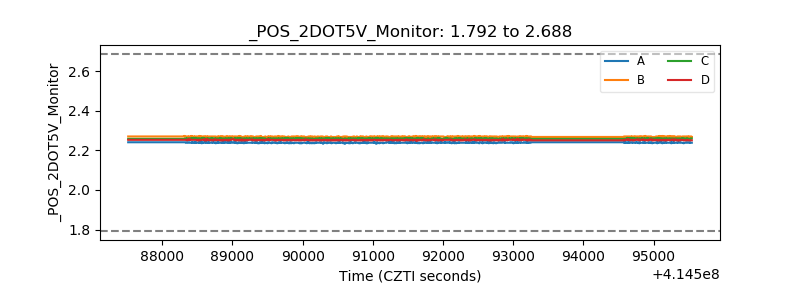 |
| +5 Volts monitor | 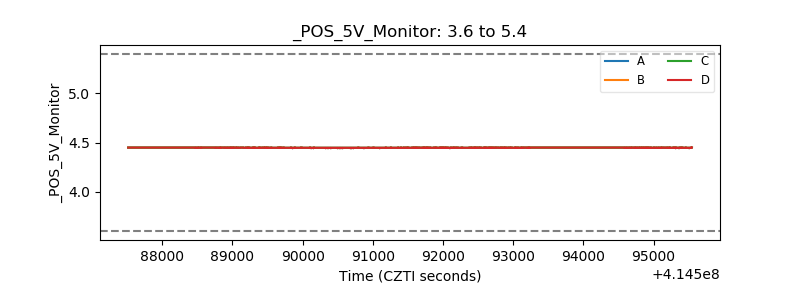 |
| _ROLL_ROT | 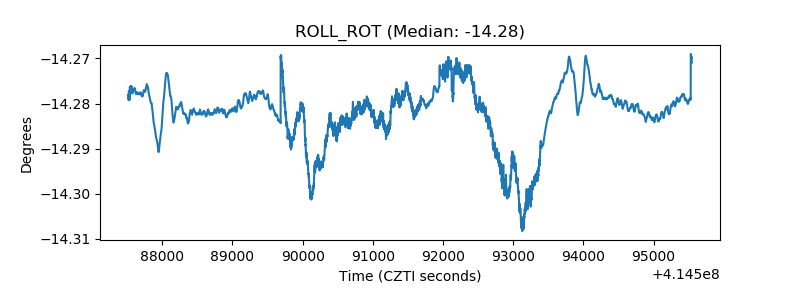 |
| _Roll_DEC | 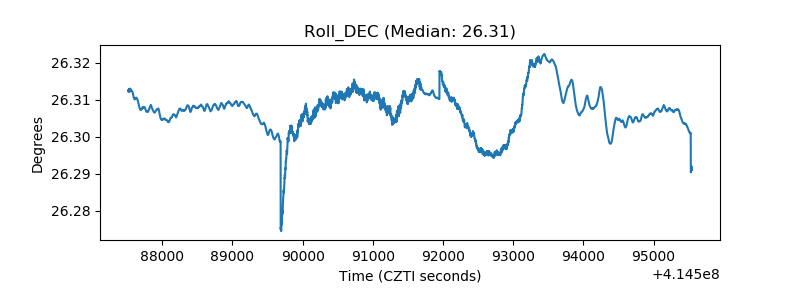 |
| _Roll_RA | 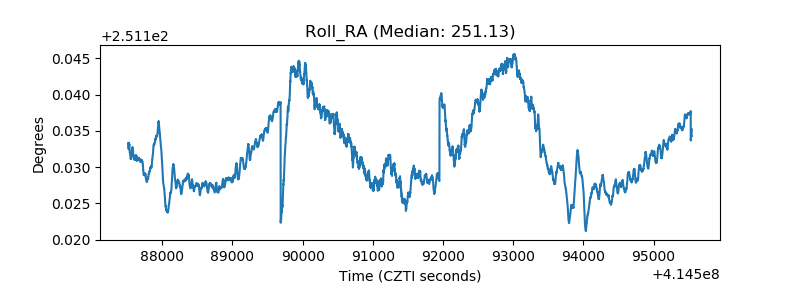 |
| Veto Counter | 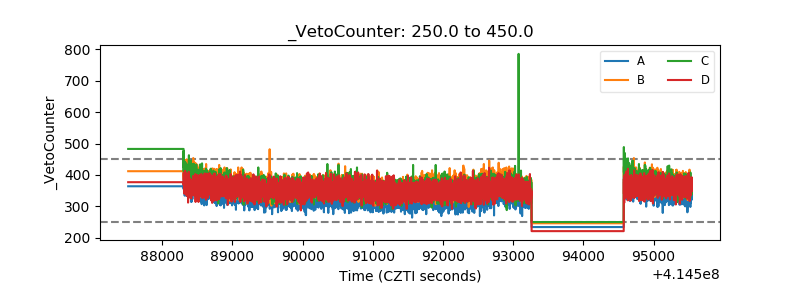 |