| Param | Original file | Final file |
|---|---|---|
| Filename | modeM0/AS1A12_054T03_9000005516_40003cztM0_level2.fits | modeM0/AS1A12_054T03_9000005516_40003cztM0_level2_quad_clean.evt |
| Size (bytes) | 395,527,680 | 94,104,000 |
| Size | 377.2 MB | 89.7 MB |
| Events in quadrant A | 3,458,754 | 632,899 |
| Events in quadrant B | 3,126,159 | 651,244 |
| Events in quadrant C | 3,307,082 | 619,121 |
| Events in quadrant D | 4,288,191 | 532,080 |
| Mode M9 | |||
|---|---|---|---|
| Quadrant | BADHDUFLAG | Total packets | Discarded packets |
| A | 0 | 15 | 0 |
| B | 0 | 15 | 0 |
| C | 0 | 15 | 0 |
| D | 0 | 16 | 0 |
| Mode SS | |||
|---|---|---|---|
| Quadrant | BADHDUFLAG | Total packets | Discarded packets |
| A | 0 | 120 | 0 |
| B | 0 | 120 | 0 |
| C | 0 | 120 | 0 |
| D | 0 | 120 | 0 |
| Mode M0 | |||
|---|---|---|---|
| Quadrant | BADHDUFLAG | Total packets | Discarded packets |
| A | 0 | 13950 | 3 |
| B | 0 | 13342 | 2 |
| C | 0 | 13563 | 2 |
| D | 0 | 16903 | 2 |
| Quadrant | Total seconds | Saturated seconds | Saturation percentage |
|---|---|---|---|
| A | 5926 | 103 | 1.738103% |
| B | 5926 | 104 | 1.754978% |
| C | 5926 | 73 | 1.231860% |
| D | 5926 | 556 | 9.382383% |
Noise dominated data is calculated using 1-second bins in cleaned event files. If a bin has >2000 counts, and if more than 50% of those come from <1% of pixels, then it is considered to be noise-dominated and hence unusable.
| Quadrant | # 1 sec bins | Bins with >0 counts | Bins with >2000 counts | High rate bins dominated by noise | Noise dominated (total time) | Noise dominated (detector-on time) | Marked lightcurve |
|---|---|---|---|---|---|---|---|
| A | 7239 | 5927 | 72 | 72 | 0.99% | 1.21% | 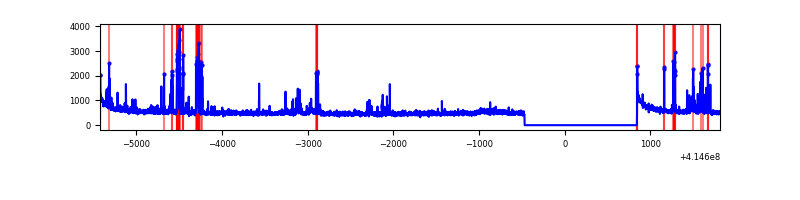 |
| B | 7239 | 5927 | 66 | 66 | 0.91% | 1.11% | 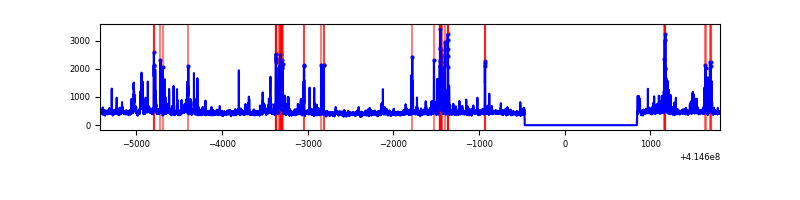 |
| C | 7239 | 5927 | 76 | 76 | 1.05% | 1.28% | 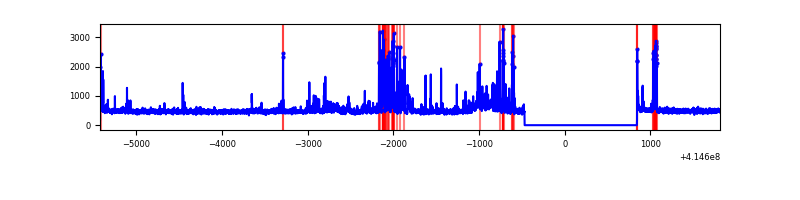 |
| D | 7239 | 5927 | 425 | 425 | 5.87% | 7.17% | 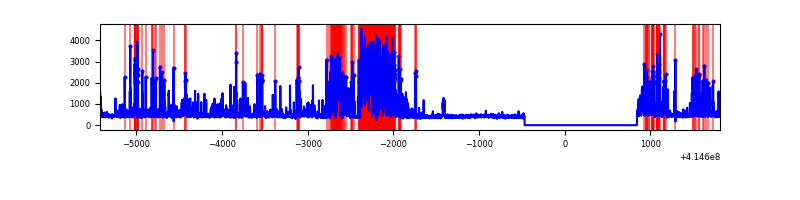 |
Top three noisy pixels from each quadrant. If the there are fewer than three noisy pixels in the level2.evt file, extra rows are filled as -1
| Pixel properties | Quadrant properties | ||||||
|---|---|---|---|---|---|---|---|
| Quadrant | DetID | PixID | Counts | Sigma | Mean | Median | Sigma |
| A | 10 | 83 | 508749 | 3792.4 | 644 | 630 | 134.0 |
| A | 13 | 248 | 361778 | 2695.47 | 644 | 630 | 134.0 |
| A | 2 | 79 | 45000 | 331.16 | 644 | 630 | 134.0 |
| B | 4 | 171 | 557608 | 4446.52 | 643 | 625 | 125.3 |
| B | 12 | 111 | 15768 | 120.89 | 643 | 625 | 125.3 |
| B | 11 | 111 | 14494 | 110.72 | 643 | 625 | 125.3 |
| C | 14 | 254 | 319340 | 2152.3 | 632 | 636 | 148.1 |
| C | 15 | 214 | 246577 | 1660.91 | 632 | 636 | 148.1 |
| C | 9 | 54 | 157496 | 1059.32 | 632 | 636 | 148.1 |
| D | 2 | 250 | 1394383 | 9297.89 | 605 | 587 | 149.9 |
| D | 13 | 249 | 273850 | 1822.91 | 605 | 587 | 149.9 |
| D | 12 | 227 | 103326 | 685.36 | 605 | 587 | 149.9 |
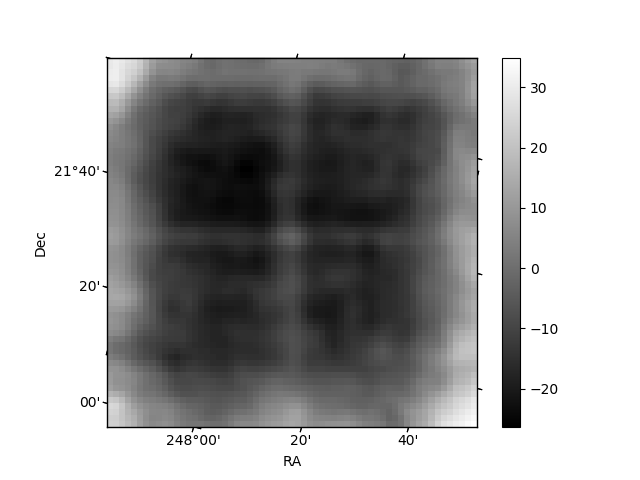
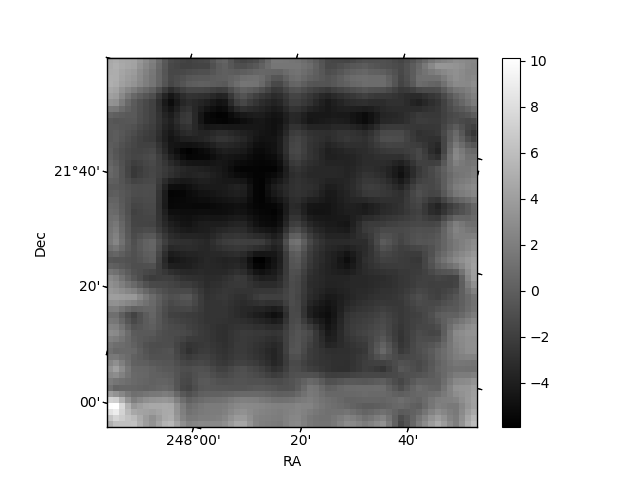
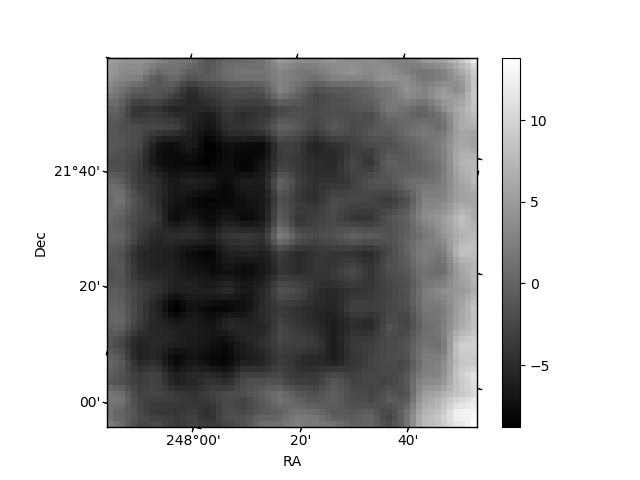
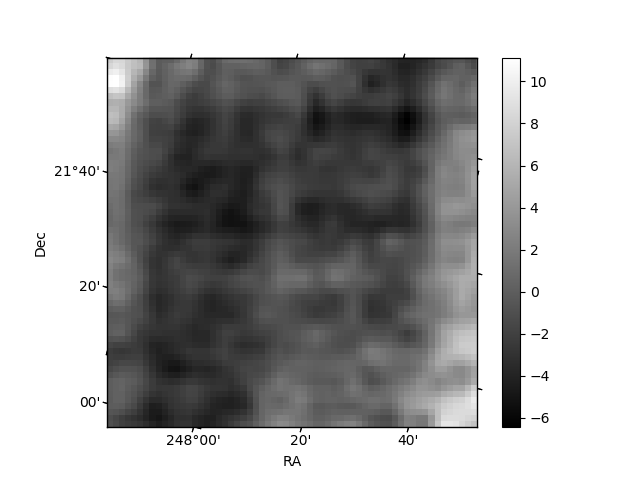
Histogram calculated using DETX and DETY for each event in the final _common_clean file
| Quadrant A | 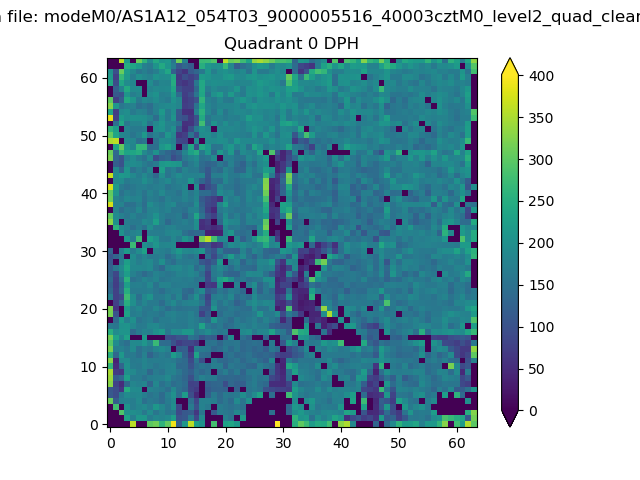 |
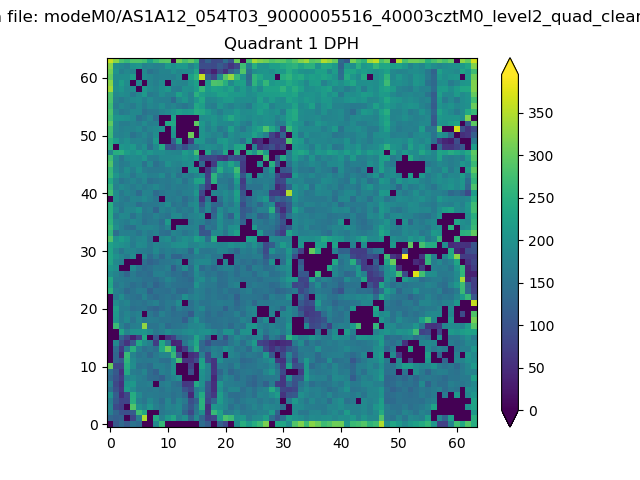 |
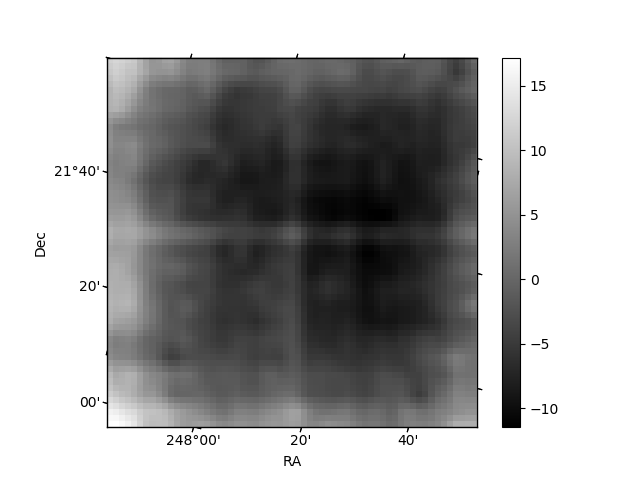
Quadrant B |
|---|---|---|---|
| Quadrant D | 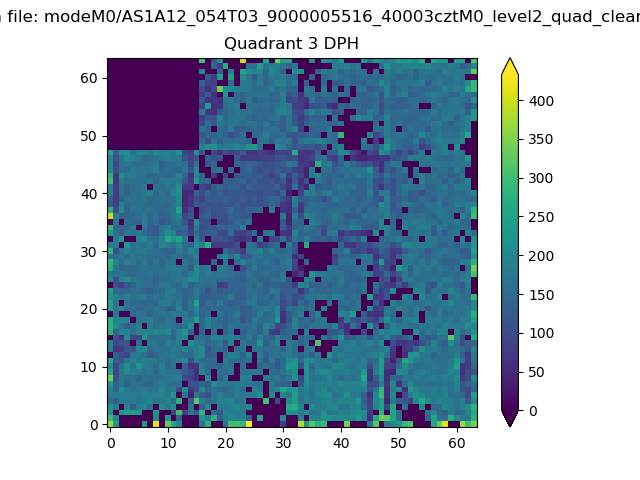 |
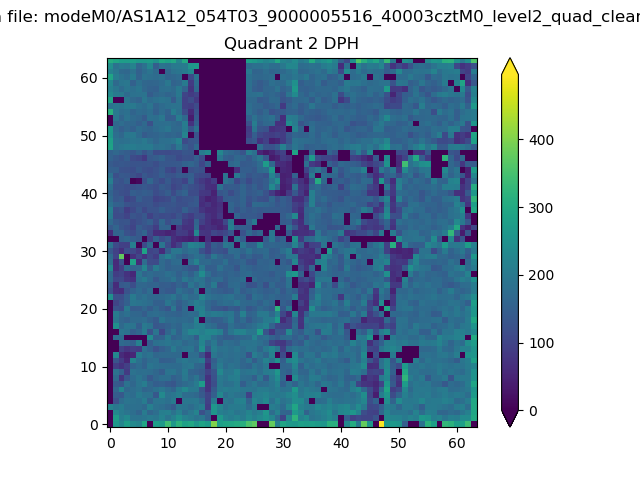 |
Quadrant C |
| Plot type | Count rate plots | Images |
|---|---|---|
| Comparison with Poisson distribution Blue bars denote a histogram of data divided into 1 sec bins. Red curve is a Poisson curve with rate = median count rate of data. |
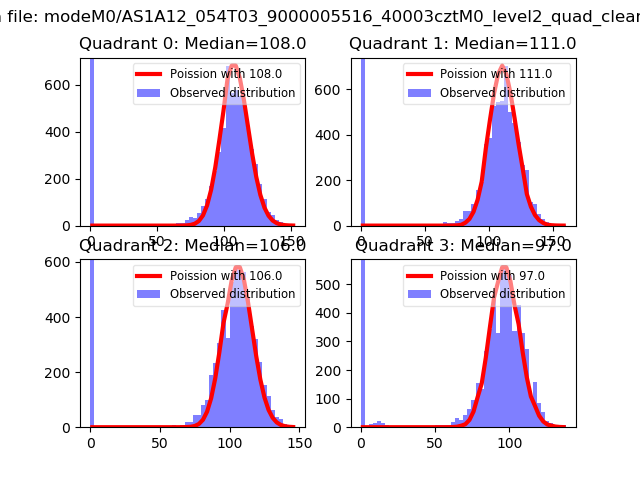 |
 |
| Quadrant-wise count rates Data is divided into 100 sec bins |
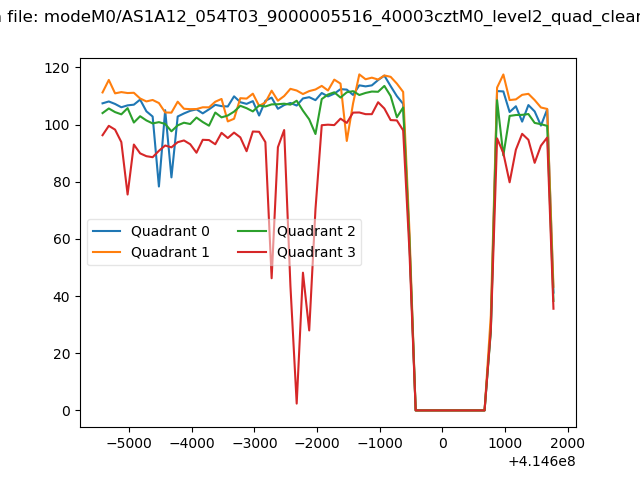 |
|
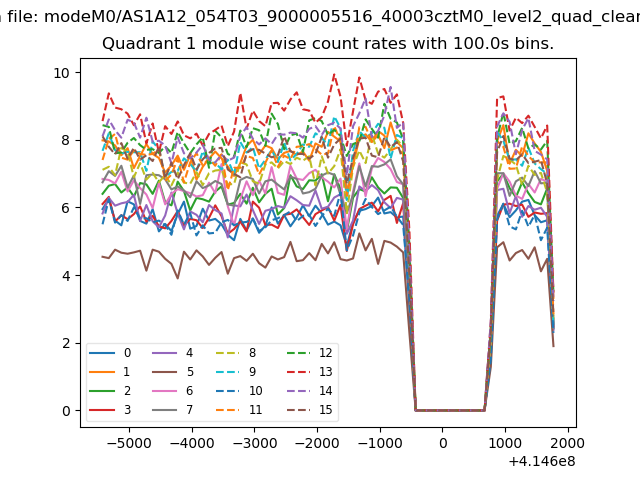
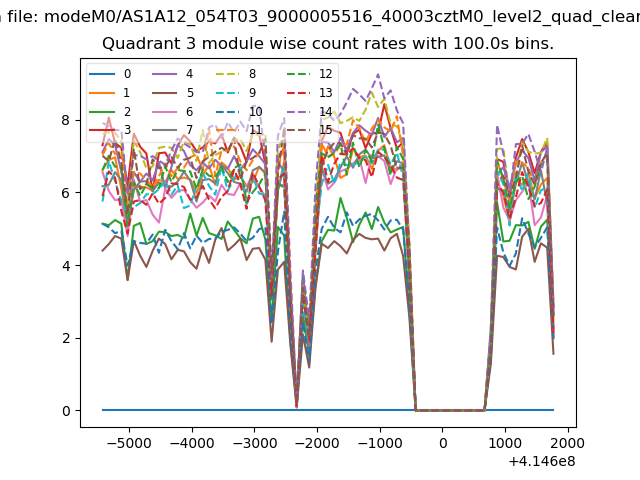
| Module-wise count rates for Quadrant A Data is divided into 100 sec bins |
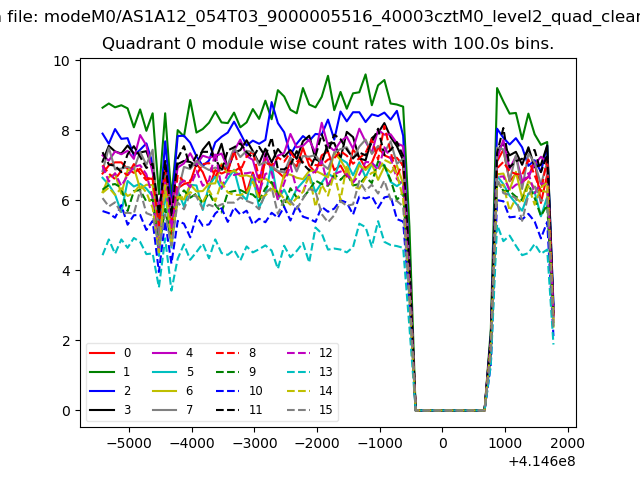 |
 |
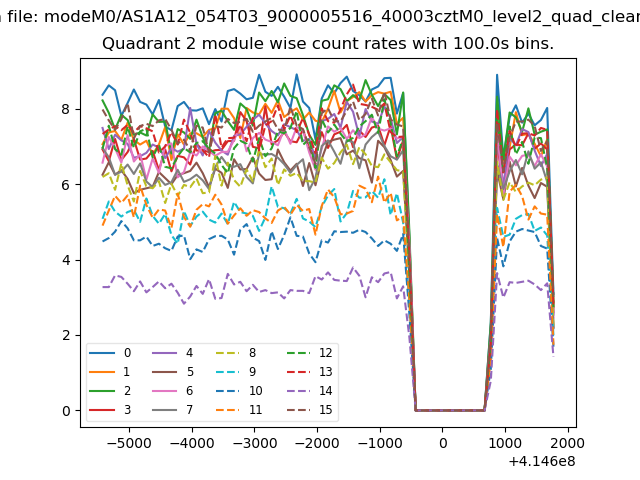
| Module-wise count rates for Quadrant B Data is divided into 100 sec bins |
 |
 |
| Module-wise count rates for Quadrant C Data is divided into 100 sec bins |
 |
 |
| Module-wise count rates for Quadrant D Data is divided into 100 sec bins |
 |
 |
| Parameter | Plot |
|---|---|
| CZT HV Monitor | 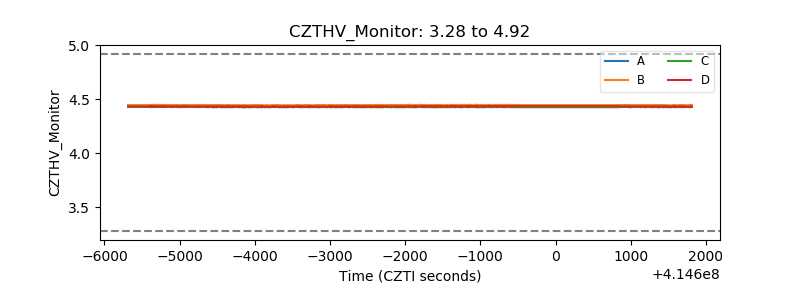 |
| D_VDD | 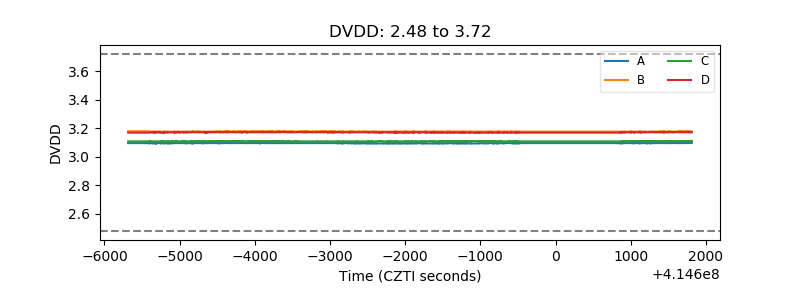 |
| Temperature 1 | 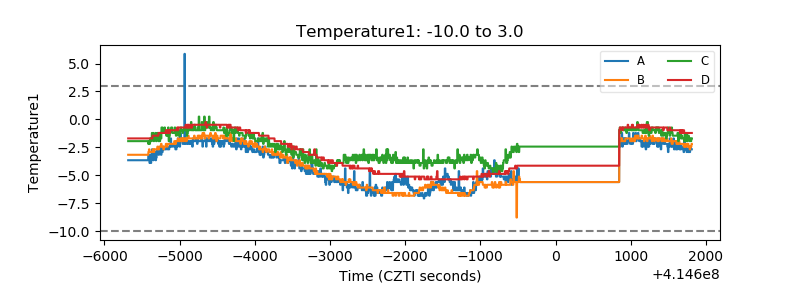 |
| Veto HV Monitor | 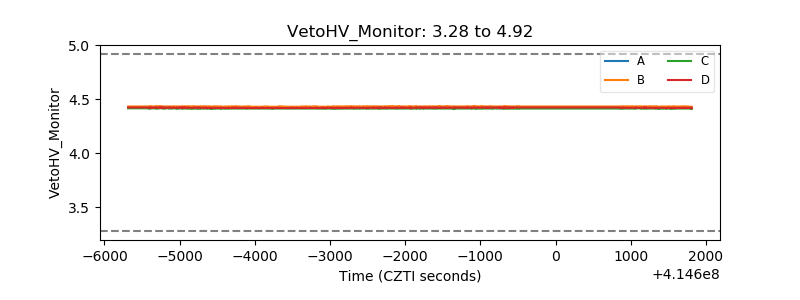 |
| Veto LLD | 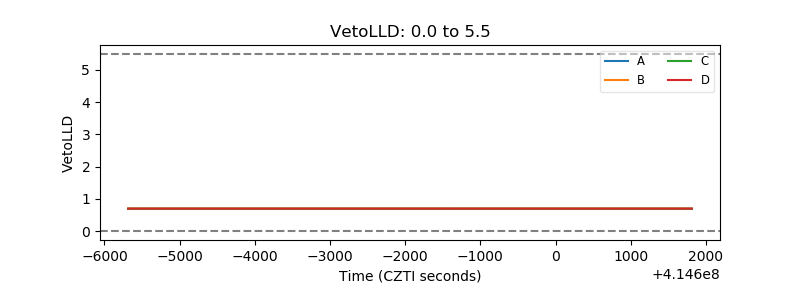 |
| Alpha Counter | 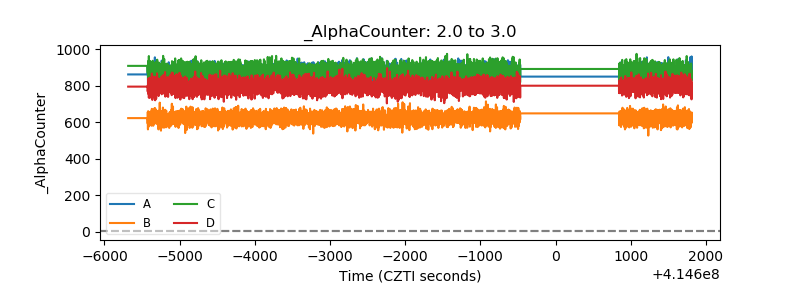 |
| _CPM_Rate | 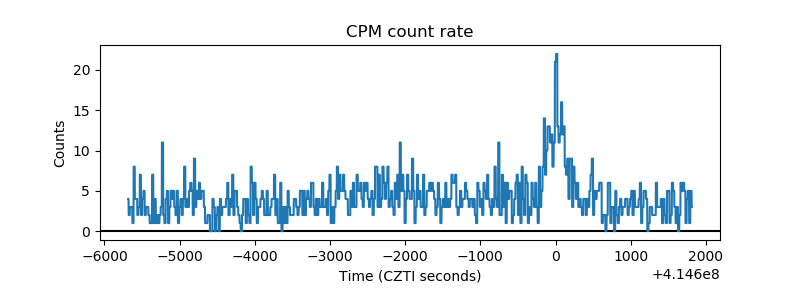 |
| CZT Counter | 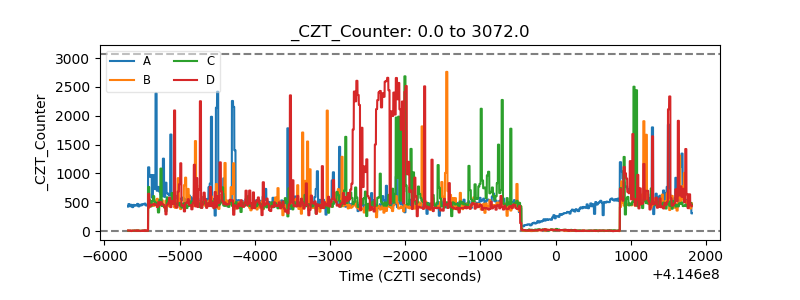 |
| +2.5 Volts monitor | 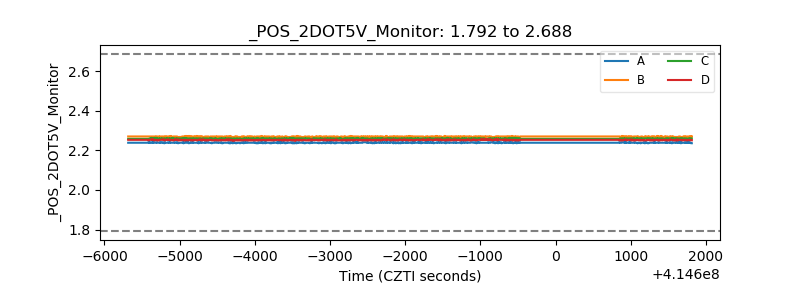 |
| +5 Volts monitor | 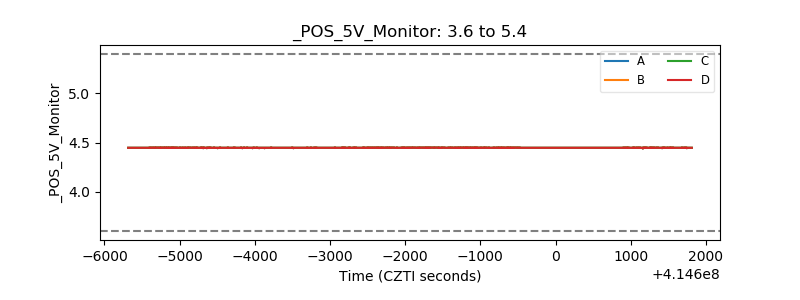 |
| _ROLL_ROT | 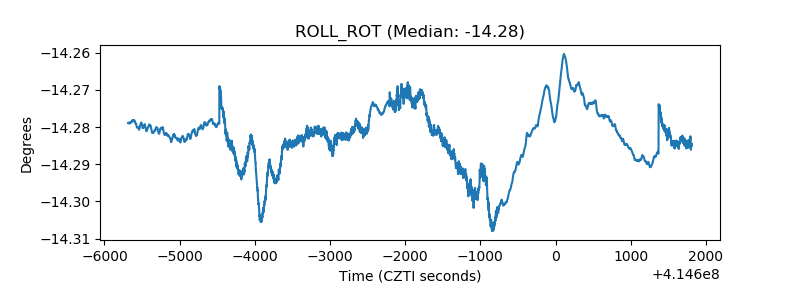 |
| _Roll_DEC | 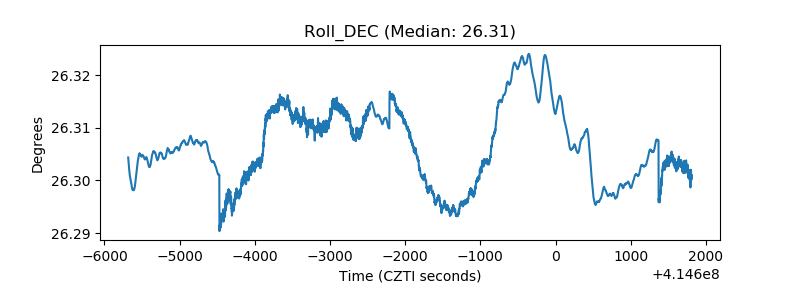 |
| _Roll_RA | 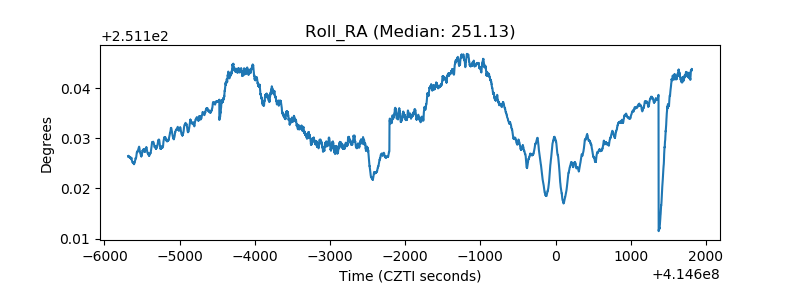 |
| Veto Counter | 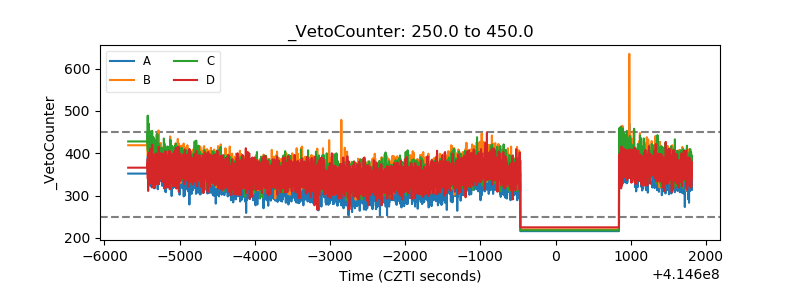 |