| Param | Original file | Final file |
|---|---|---|
| Filename | modeM0/AS1A12_054T03_9000005516_40005cztM0_level2.fits | modeM0/AS1A12_054T03_9000005516_40005cztM0_level2_quad_clean.evt |
| Size (bytes) | 676,304,640 | 170,124,480 |
| Size | 645.0 MB | 162.2 MB |
| Events in quadrant A | 5,678,304 | 1,145,216 |
| Events in quadrant B | 5,784,859 | 1,154,150 |
| Events in quadrant C | 5,211,641 | 1,136,395 |
| Events in quadrant D | 7,529,565 | 974,037 |
| Mode M9 | |||
|---|---|---|---|
| Quadrant | BADHDUFLAG | Total packets | Discarded packets |
| A | 0 | 33 | 0 |
| B | 0 | 33 | 0 |
| C | 0 | 33 | 0 |
| D | 0 | 34 | 0 |
| Mode SS | |||
|---|---|---|---|
| Quadrant | BADHDUFLAG | Total packets | Discarded packets |
| A | 0 | 220 | 0 |
| B | 0 | 220 | 0 |
| C | 0 | 220 | 0 |
| D | 0 | 220 | 0 |
| Mode M0 | |||
|---|---|---|---|
| Quadrant | BADHDUFLAG | Total packets | Discarded packets |
| A | 0 | 23619 | 4 |
| B | 0 | 24569 | 3 |
| C | 0 | 22272 | 3 |
| D | 0 | 30211 | 3 |
| Quadrant | Total seconds | Saturated seconds | Saturation percentage |
|---|---|---|---|
| A | 10696 | 93 | 0.869484% |
| B | 10696 | 303 | 2.832835% |
| C | 10696 | 49 | 0.458115% |
| D | 10696 | 867 | 8.105834% |
Noise dominated data is calculated using 1-second bins in cleaned event files. If a bin has >2000 counts, and if more than 50% of those come from <1% of pixels, then it is considered to be noise-dominated and hence unusable.
| Quadrant | # 1 sec bins | Bins with >0 counts | Bins with >2000 counts | High rate bins dominated by noise | Noise dominated (total time) | Noise dominated (detector-on time) | Marked lightcurve |
|---|---|---|---|---|---|---|---|
| A | 13532 | 10698 | 55 | 55 | 0.41% | 0.51% | 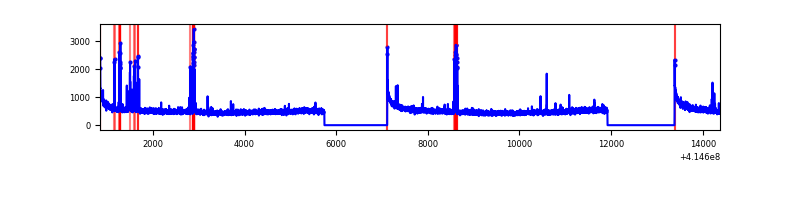 |
| B | 13532 | 10697 | 162 | 162 | 1.20% | 1.51% | 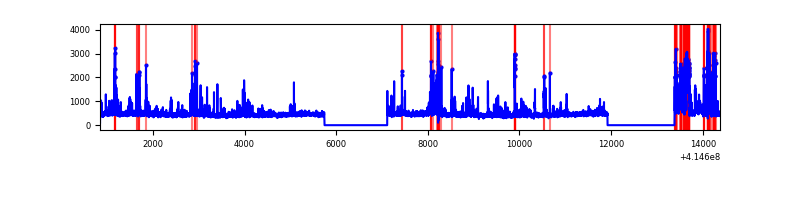 |
| C | 13532 | 10697 | 41 | 41 | 0.30% | 0.38% | 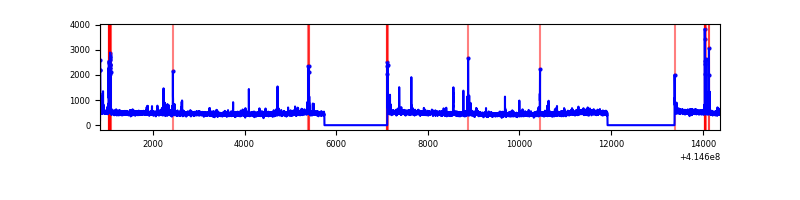 |
| D | 13532 | 10697 | 698 | 698 | 5.16% | 6.53% | 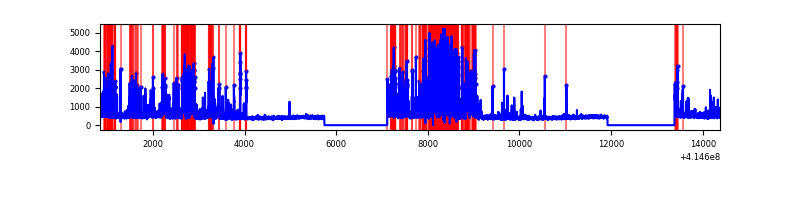 |
Top three noisy pixels from each quadrant. If the there are fewer than three noisy pixels in the level2.evt file, extra rows are filled as -1
| Pixel properties | Quadrant properties | ||||||
|---|---|---|---|---|---|---|---|
| Quadrant | DetID | PixID | Counts | Sigma | Mean | Median | Sigma |
| A | 10 | 83 | 868918 | 3627.23 | 1167 | 1142 | 239.2 |
| A | 13 | 248 | 241163 | 1003.26 | 1167 | 1142 | 239.2 |
| A | 13 | 6 | 16073 | 62.41 | 1167 | 1142 | 239.2 |
| B | 4 | 171 | 1084411 | 4842.87 | 1153 | 1120 | 223.7 |
| B | 5 | 255 | 64245 | 282.2 | 1153 | 1120 | 223.7 |
| B | 0 | 221 | 31034 | 133.73 | 1153 | 1120 | 223.7 |
| C | 15 | 214 | 440581 | 1646.86 | 1145 | 1154 | 266.8 |
| C | 14 | 254 | 96766 | 358.33 | 1145 | 1154 | 266.8 |
| C | 15 | 208 | 93809 | 347.25 | 1145 | 1154 | 266.8 |
| D | 12 | 227 | 1425506 | 5256.31 | 1095 | 1064 | 271.0 |
| D | 2 | 250 | 1141492 | 4208.28 | 1095 | 1064 | 271.0 |
| D | 13 | 249 | 526500 | 1938.9 | 1095 | 1064 | 271.0 |
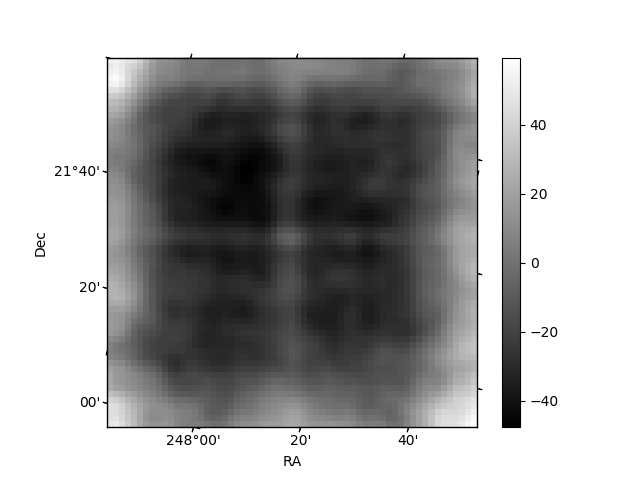
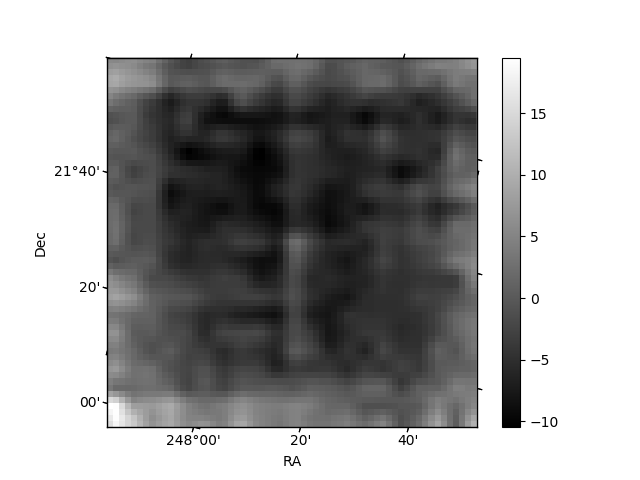
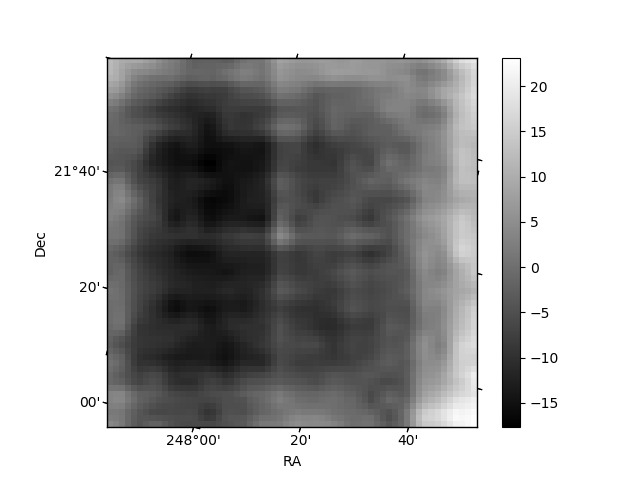
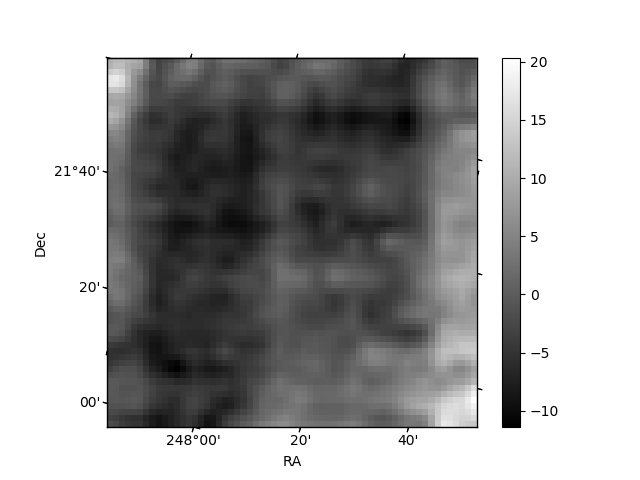
Histogram calculated using DETX and DETY for each event in the final _common_clean file
| Quadrant A | 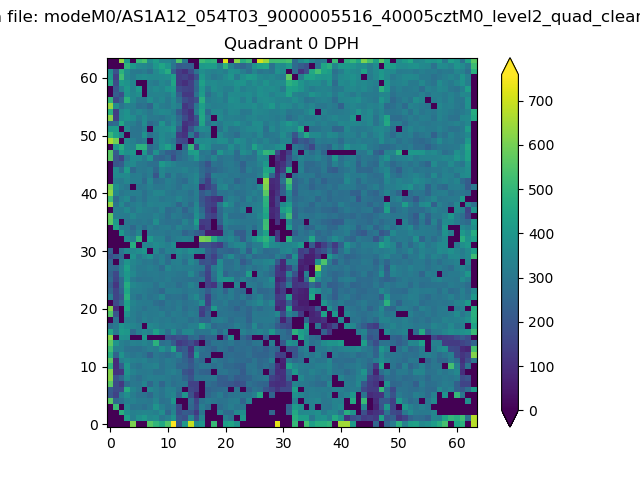 |
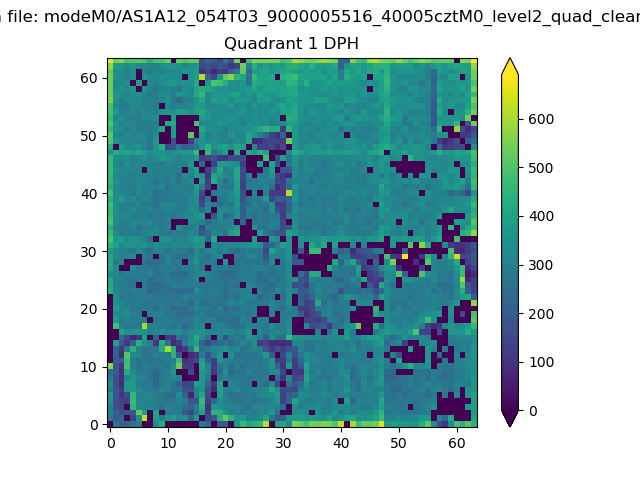 |
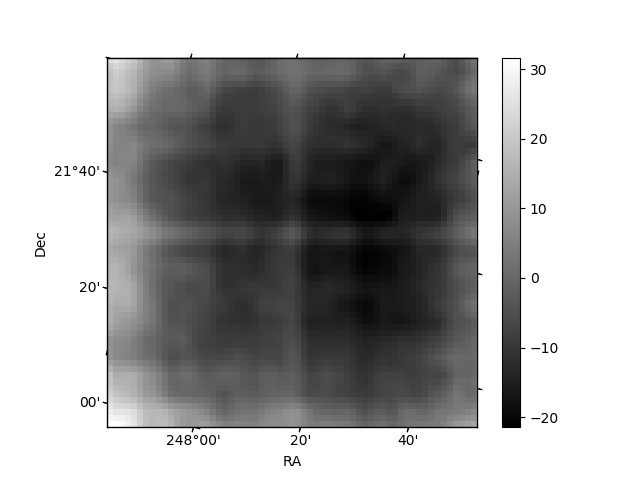
Quadrant B |
|---|---|---|---|
| Quadrant D | 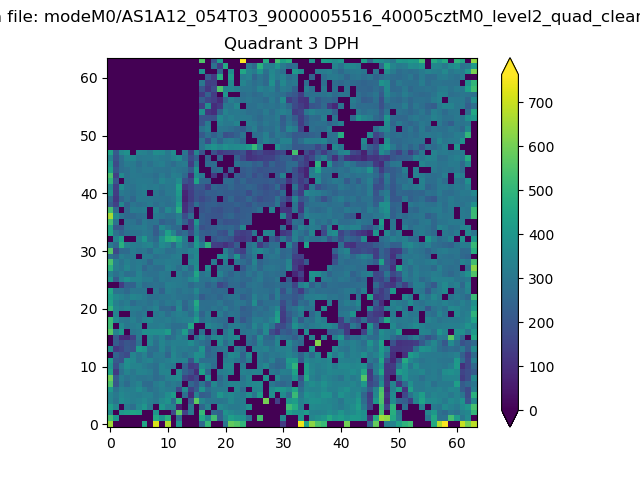 |
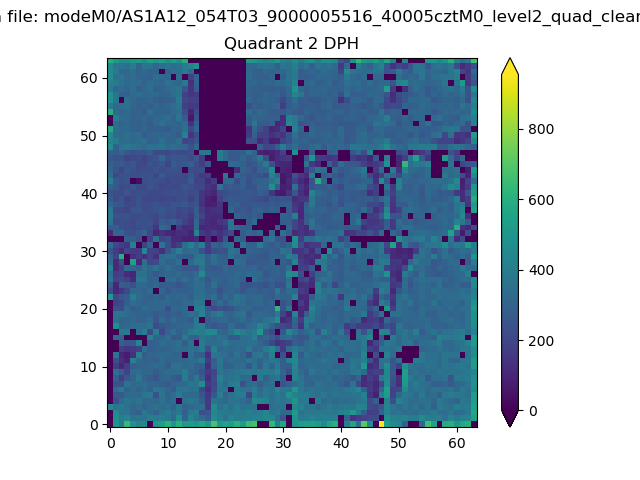 |
Quadrant C |
| Plot type | Count rate plots | Images |
|---|---|---|
| Comparison with Poisson distribution Blue bars denote a histogram of data divided into 1 sec bins. Red curve is a Poisson curve with rate = median count rate of data. |
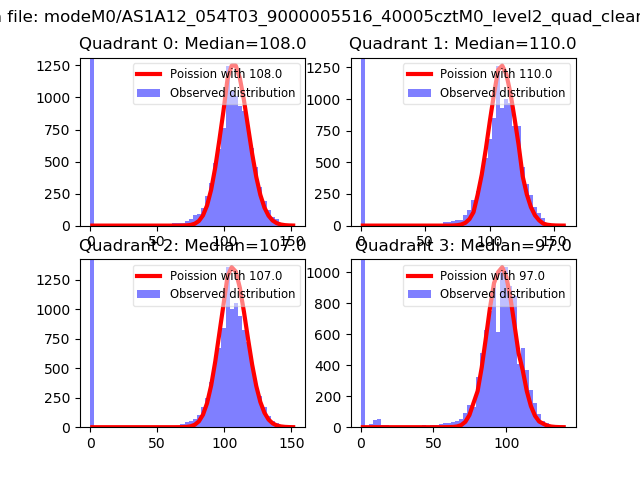 |
 |
| Quadrant-wise count rates Data is divided into 100 sec bins |
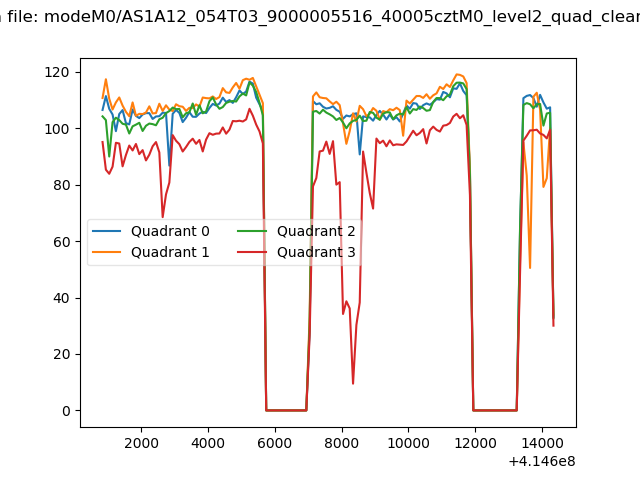 |
|
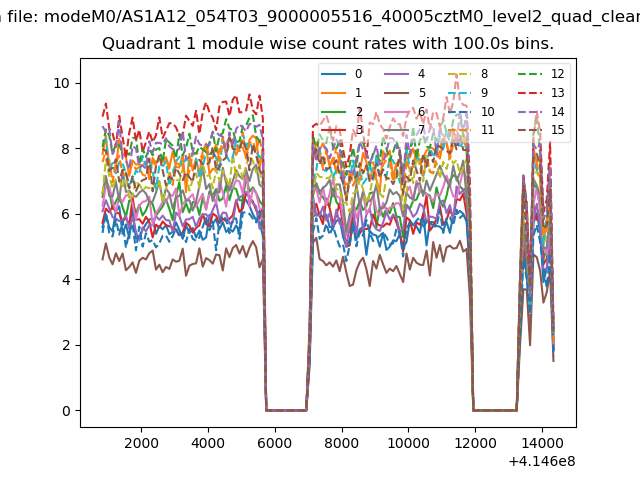
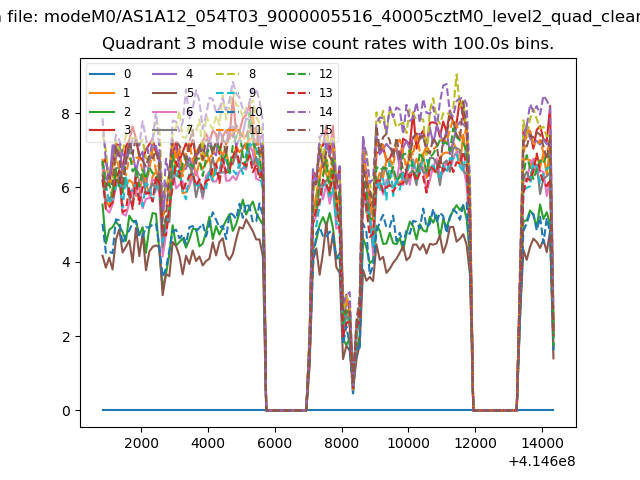
| Module-wise count rates for Quadrant A Data is divided into 100 sec bins |
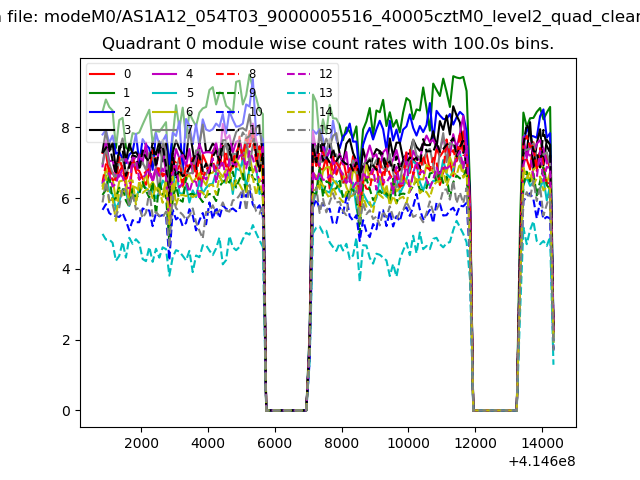 |
 |
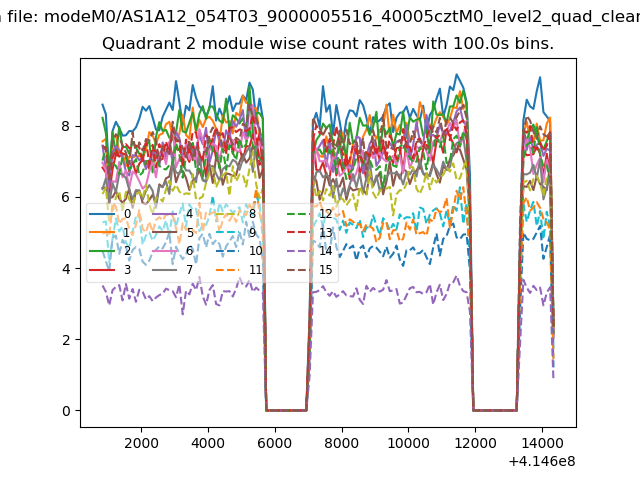
| Module-wise count rates for Quadrant B Data is divided into 100 sec bins |
 |
 |
| Module-wise count rates for Quadrant C Data is divided into 100 sec bins |
 |
 |
| Module-wise count rates for Quadrant D Data is divided into 100 sec bins |
 |
 |
| Parameter | Plot |
|---|---|
| CZT HV Monitor | 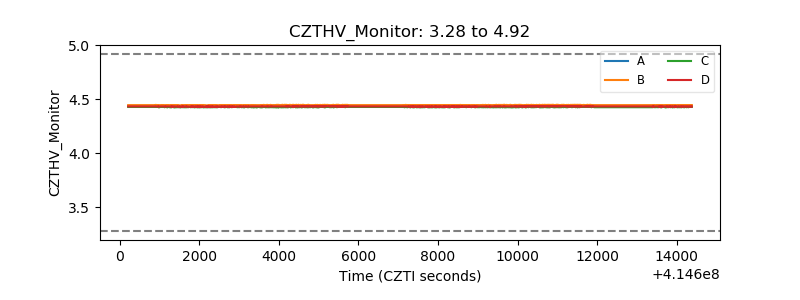 |
| D_VDD | 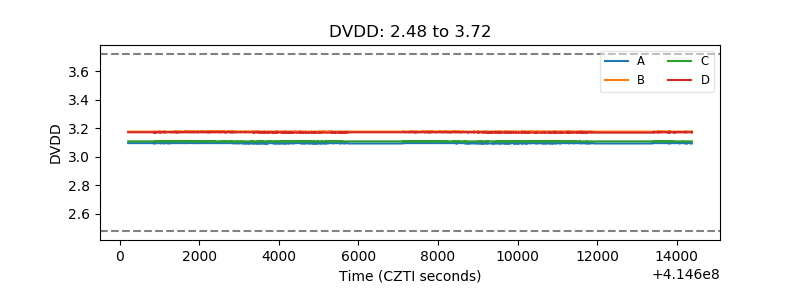 |
| Temperature 1 | 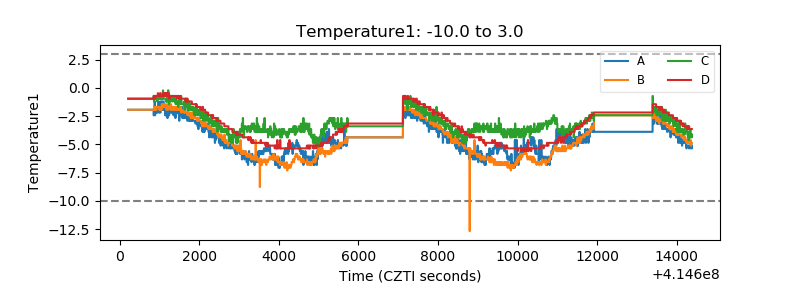 |
| Veto HV Monitor | 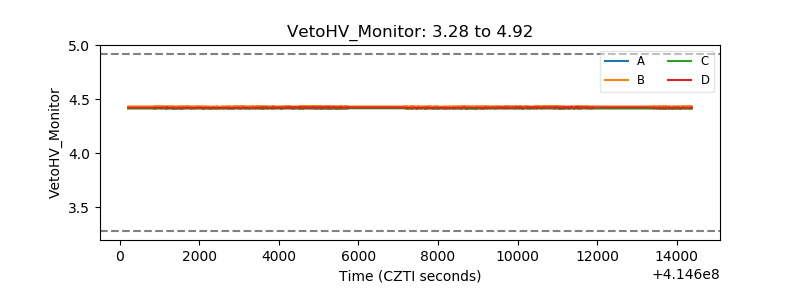 |
| Veto LLD | 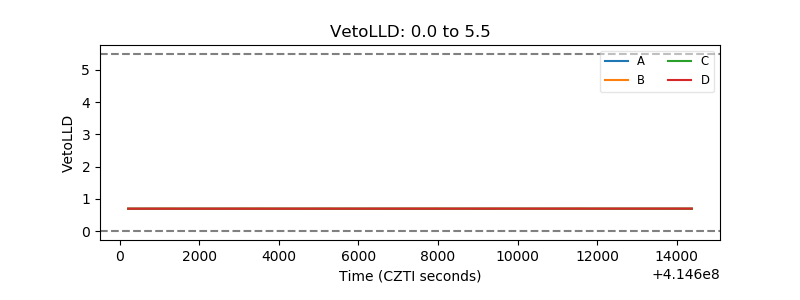 |
| Alpha Counter | 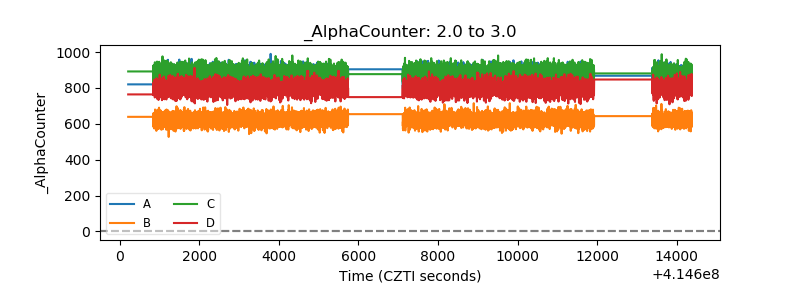 |
| _CPM_Rate | 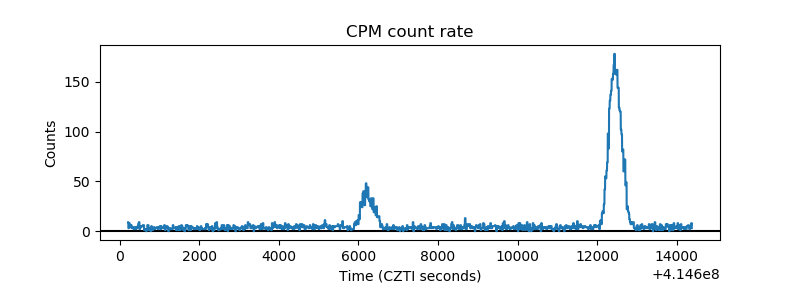 |
| CZT Counter | 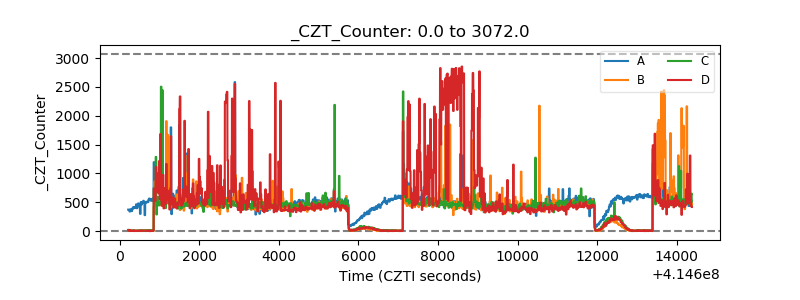 |
| +2.5 Volts monitor | 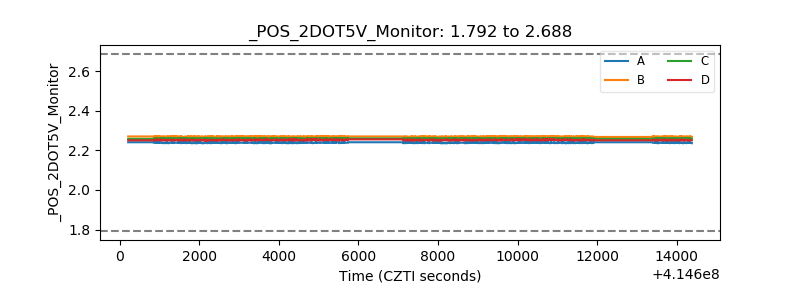 |
| +5 Volts monitor | 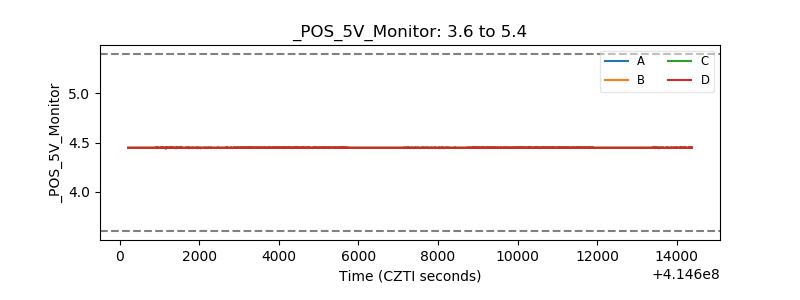 |
| _ROLL_ROT | 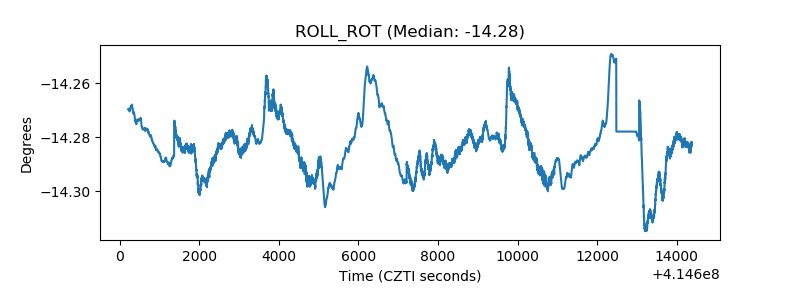 |
| _Roll_DEC | 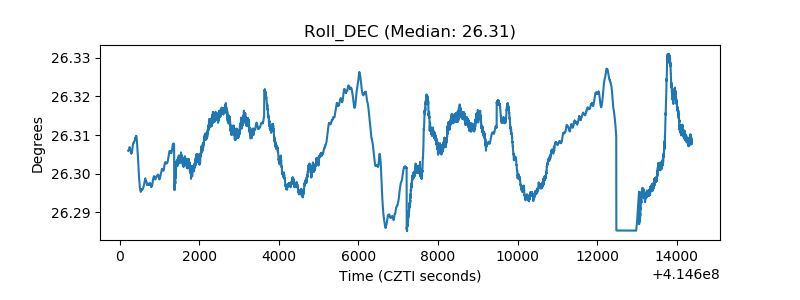 |
| _Roll_RA | 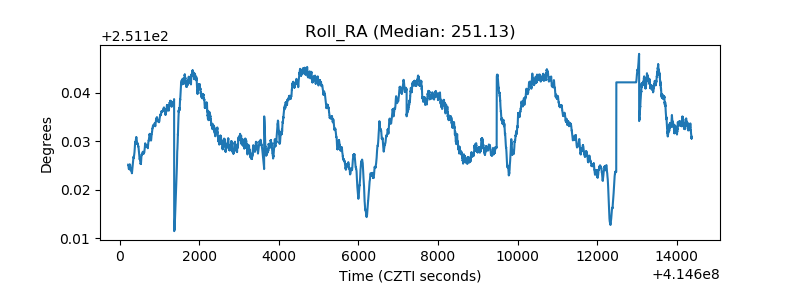 |
| Veto Counter | 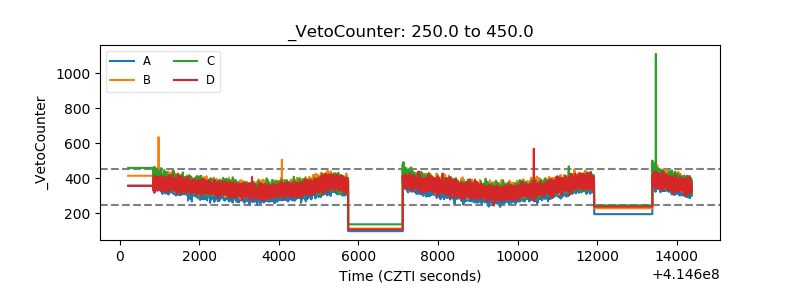 |